Bitcoin Power LawThis is the main body version of the script. The Oscillator version can be found here.
Understanding the Bitcoin Power Law Model
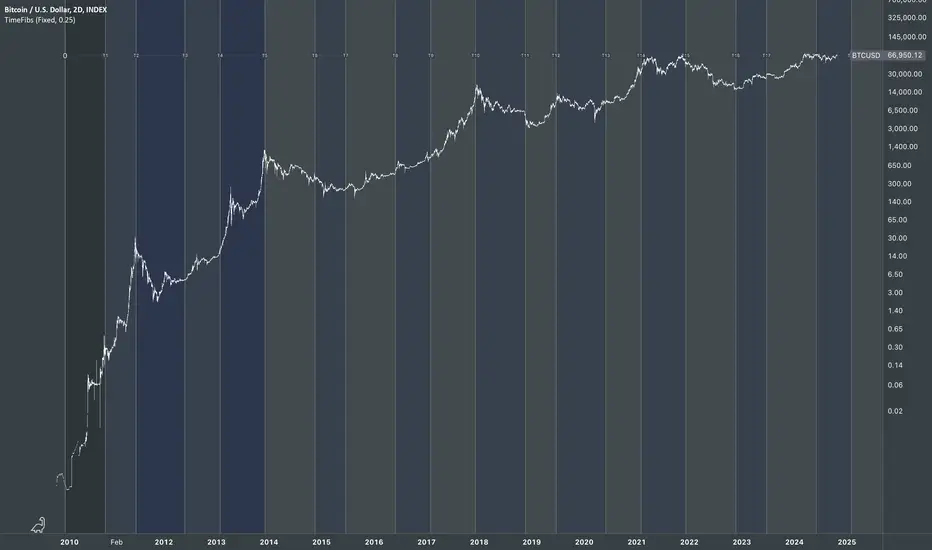
Also called the Long-Term Bitcoin Power Law Model. The Bitcoin Power Law model tries to capture and predict Bitcoin's price growth over time. It assumes that Bitcoin's price follows an exponential growth pattern, where the price increases over time according to a mathematical relationship.
By fitting a power law to historical data, the model creates a trend line that represents this growth. It then generates additional parallel lines (support and resistance lines) to show potential price boundaries, helping to visualize where Bitcoin’s price could move within certain ranges.
In simple terms, the model helps us understand Bitcoin's general growth trajectory and provides a framework to visualize how its price could behave over the long term.
The Bitcoin Power Law has the following function:
Power Law = 10^(a + b * log10(d))
Consisting of the following parameters:
a: Power Law Intercept (default: -17.668).
b: Power Law Slope (default: 5.926).
d: Number of days since a reference point(calculated by counting bars from the reference point with an offset).
Explanation of the a and b parameters:
Roughly explained, the optimal values for the a and b parameters are determined through a process of linear regression on a log-log scale (after applying a logarithmic transformation to both the x and y axes). On this log-log scale, the power law relationship becomes linear, making it possible to apply linear regression. The best fit for the regression is then evaluated using metrics like the R-squared value, residual error analysis, and visual inspection. This process can be quite complex and is beyond the scope of this post.
Applying vertical shifts to generate the other lines:
Once the initial power-law is created, additional lines are generated by applying a vertical shift. This shift is achieved by adding a specific number of days (or years in case of this script) to the d-parameter. This creates new lines perfectly parallel to the initial power law with an added vertical shift, maintaining the same slope and intercept.
In the case of this script, shifts are made by adding +365 days, +2 * 365 days, +3 * 365 days, +4 * 365 days, and +5 * 365 days, effectively introducing one to five years of shifts. This results in a total of six Power Law lines, as outlined below (From lowest to highest):
Base Power Law Line (no shift)
1-year shifted line
2-year shifted line
3-year shifted line
4-year shifted line
5-year shifted line
The six power law lines:
Bitcoin Power Law Oscillator
This publication also includes the oscillator version of the Bitcoin Power Law. This version applies a logarithmic transformation to the price, Base Power Law Line, and 5-year shifted line using the formula: log10(x) .
The log-transformed price is then normalized using min-max normalization relative to the log-transformed Base Power Law Line and 5-year shifted line with the formula:
normalized price = log(close) - log(Base Power Law Line) / log(5-year shifted line) - log(Base Power Law Line)
Finally, the normalized price was multiplied by 5 to map its value between 0 and 5, aligning with the shifted lines.
Interpretation of the Bitcoin Power Law Model:
The shifted Power Law lines provide a framework for predicting Bitcoin's future price movements based on historical trends. These lines are created by applying a vertical shift to the initial Power Law line, with each shifted line representing a future time frame (e.g., 1 year, 2 years, 3 years, etc.).
By analyzing these shifted lines, users can make predictions about minimum price levels at specific future dates. For example, the 5-year shifted line will act as the main support level for Bitcoin’s price in 5 years, meaning that Bitcoin’s price should not fall below this line, ensuring that Bitcoin will be valued at least at this level by that time. Similarly, the 2-year shifted line will serve as the support line for Bitcoin's price in 2 years, establishing that the price should not drop below this line within that time frame.
On the other hand, the 5-year shifted line also functions as an absolute resistance , meaning Bitcoin's price will not exceed this line prior to the 5-year mark. This provides a prediction that Bitcoin cannot reach certain price levels before a specific date. For example, the price of Bitcoin is unlikely to reach $100,000 before 2021, and it will not exceed this price before the 5-year shifted line becomes relevant. After 2028, however, the price is predicted to never fall below $100,000, thanks to the support established by the shifted lines.
In essence, the shifted Power Law lines offer a way to predict both the minimum price levels that Bitcoin will hit by certain dates and the earliest dates by which certain price points will be reached. These lines help frame Bitcoin's potential future price range, offering insight into long-term price behavior and providing a guide for investors and analysts. Lets examine some examples:
Example 1:
In Example 1 it can be seen that point A on the 5-year shifted line acts as major resistance . Also it can be seen that 5 years later this price level now corresponds to the Base Power Law Line and acts as a major support at point B (Note: Vertical yearly grid lines have been added for this purpose👍).
Example 2:
In Example 2, the price level at point C on the 3-year shifted line becomes a major support three years later at point D, now aligning with the Base Power Law Line.
Finally, let's explore some future price predictions, as this script provides projections on the weekly timeframe :
Example 3:
In Example 3, the Bitcoin Power Law indicates that Bitcoin's price cannot surpass approximately $808K before 2030 as can be seen at point E, while also ensuring it will be at least $224K by then (point F).
Cycle

Yearly History Calendar-Aligned Price up to 10 Years)Overview
This indicator helps traders compare historical price patterns from the past 10 calendar years with the current price action. It overlays translucent lines (polylines) for each year’s price data on the same calendar dates, providing a visual reference for recurring trends. A dynamic table at the top of the chart summarizes the active years, their price sources, and history retention settings.
Key Features
Historical Projections
Displays price data from the last 10 years (e.g., January 5, 2023 vs. January 5, 2024).
Price Source Selection
Choose from Open, Low, High, Close, or HL2 ((High + Low)/2) for historical alignment.
The selected source is shown in the legend table.
Bulk Control Toggles
Show All Years : Display all 10 years simultaneously.
Keep History for All : Preserve historical lines on year transitions.
Hide History for All : Automatically delete old lines to update with current data.
Individual Year Settings
Toggle visibility for each year (-1 to -10) independently.
Customize color and line width for each year.
Control whether to keep or delete historical lines for specific years.
Visual Alignment Aids
Vertical lines mark yearly transitions for reference.
Polylines are semi-transparent for clarity.
Dynamic Legend Table
Shows active years, their price sources, and history status (On/Off).
Updates automatically when settings change.
How to Use
Configure Settings
Projection Years : Select how many years to display (1–10).
Price Source : Choose Open, Low, High, Close, or HL2 for historical alignment.
History Precision : Set granularity (Daily, 60m, or 15m).
Daily (D) is recommended for long-term analysis (covers 10 years).
60m/15m provides finer precision but may only cover 1–3 years due to data limits.
Adjust Visibility & History
Show Year -X : Enable/disable specific years for comparison.
Keep History for Year -X : Choose whether to retain historical lines or delete them on new year transitions.
Bulk Controls
Show All Years : Display all 10 years at once (overrides individual toggles).
Keep History for All / Hide History for All : Globally enable/disable history retention for all years.
Customize Appearance
Line Width : Adjust polyline thickness for better visibility.
Colors : Assign unique colors to each year for easy identification.
Interpret the Legend Table
The table shows:
Year : Label (e.g., "Year -1").
Source : The selected price type (e.g., "Close", "HL2").
Keep History : Indicates whether lines are preserved (On) or deleted (Off).
Tips for Optimal Use
Use Daily Timeframes for Long-Term Analysis :
Daily (1D) allows 10+ years of data. Smaller timeframes (60m/15m) may have limited historical coverage.
Compare Recurring Patterns :
Look for overlaps between historical polylines and current price to identify potential support/resistance levels.
Customize Colors & Widths :
Use contrasting colors for years you want to highlight. Adjust line widths to avoid clutter.
Leverage Global Toggles :
Enable Show All Years for a quick overview. Use Keep History for All to maintain continuity across transitions.
Example Workflow
Set Up :
Select Projection Years = 5.
Choose Price Source = Close.
Set History Precision = 1D for long-term data.
Customize :
Enable Show Year -1 to Show Year -5.
Assign distinct colors to each year.
Disable Keep History for All to ensure lines update on year transitions.
Analyze :
Observe how the 2023 close prices align with 2024’s price action.
Use vertical lines to identify yearly boundaries.
Common Questions
Why are some years missing?
Ensure the chart has sufficient historical data (e.g., daily charts cover 10 years, 60m/15m may only cover 1–3 years).
How do I update the data?
Adjust the Price Source or toggle years/history settings. The legend table updates automatically.

Bitcoin Monthly Seasonality [Alpha Extract]The Bitcoin Monthly Seasonality indicator analyzes historical Bitcoin price performance across different months of the year, enabling traders to identify seasonal patterns and potential trading opportunities. This tool helps traders:
Visualize which months historically perform best and worst for Bitcoin.
Track average returns and win rates for each month of the year.
Identify seasonal patterns to enhance trading strategies.
Compare cumulative or individual monthly performance.
🔶 CALCULATION
The indicator processes historical Bitcoin price data to calculate monthly performance metrics
Monthly Return Calculation
Inputs:
Monthly open and close prices.
User-defined lookback period (1-15 years).
Return Types:
Percentage: (monthEndPrice / monthStartPrice - 1) × 100
Price: monthEndPrice - monthStartPrice
Statistical Measures
Monthly Averages: ◦ Average return for each month calculated from historical data.
Win Rate: ◦ Percentage of positive returns for each month.
Best/Worst Detection: ◦ Identifies months with highest and lowest average returns.
Cumulative Option
Standard View: Shows discrete monthly performance.
Cumulative View: Shows compounding effect of consecutive months.
Example Calculation (Pine Script):
monthReturn = returnType == "Percentage" ?
(monthEndPrice / monthStartPrice - 1) * 100 :
monthEndPrice - monthStartPrice
calcWinRate(arr) =>
winCount = 0
totalCount = array.size(arr)
if totalCount > 0
for i = 0 to totalCount - 1
if array.get(arr, i) > 0
winCount += 1
(winCount / totalCount) * 100
else
0.0
🔶 DETAILS
Visual Features
Monthly Performance Bars: ◦ Color-coded bars (teal for positive, red for negative returns). ◦ Special highlighting for best (yellow) and worst (fuchsia) months.
Optional Trend Line: ◦ Shows continuous performance across months.
Monthly Axis Labels: ◦ Clear month names for easy reference.
Statistics Table: ◦ Comprehensive view of monthly performance metrics. ◦ Color-coded rows based on performance.
Interpretation
Strong Positive Months: Historically bullish periods for Bitcoin.
Strong Negative Months: Historically bearish periods for Bitcoin.
Win Rate Analysis: Higher win rates indicate more consistently positive months.
Pattern Recognition: Identify recurring seasonal patterns across years.
Best/Worst Identification: Quickly spot the historically strongest and weakest months.
🔶 EXAMPLES
The indicator helps identify key seasonal patterns
Bullish Seasons: Visualize historically strong months where Bitcoin tends to perform well, allowing traders to align long positions with favorable seasonality.
Bearish Seasons: Identify historically weak months where Bitcoin tends to underperform, helping traders avoid unfavorable periods or consider short positions.
Seasonal Strategy Development: Create trading strategies that capitalize on recurring monthly patterns, such as entering positions in historically strong months and reducing exposure during weak months.
Year-to-Year Comparison: Assess how current year performance compares to historical seasonal patterns to identify anomalies or confirmation of trends.
🔶 SETTINGS
Customization Options
Lookback Period: Adjust the number of years (1-15) used for historical analysis.
Return Type: Choose between percentage returns or absolute price changes.
Cumulative Option: Toggle between discrete monthly performance or cumulative effect.
Visual Style Options: Bar Display: Enable/disable and customize colors for positive/negative bars, Line Display: Enable/disable and customize colors for trend line, Axes Display: Show/hide reference axes.
Visual Enhancement: Best/Worst Month Highlighting: Toggle special highlighting of extreme months, Custom highlight colors for best and worst performing months.
The Bitcoin Monthly Seasonality indicator provides traders with valuable insights into Bitcoin's historical performance patterns throughout the year, helping to identify potentially favorable and unfavorable trading periods based on seasonal tendencies.

NY Time Cycles# New York Time Cycles Indicator
## Overview
The Time Cycles indicator is a specialized technical analysis tool designed to divide the trading day into distinct time blocks based on New York trading hours. Developed for TradingView, this indicator helps traders identify and analyze market behavior during specific time periods throughout the trading session. The indicator displays six consecutive time blocks, each representing 90-minute segments of the trading day, while tracking price ranges within each block.
## Core Concept
The Time Cycles indicator is built on the premise that different periods during the trading day often exhibit unique market characteristics and behaviors. By segmenting the trading day into standardized 90-minute blocks, traders can:
1. Identify recurring patterns at specific times of day
2. Compare price action across different time blocks
3. Recognize potential support and resistance levels based on the high and low of previous time blocks
4. Develop time-based trading strategies specific to certain market hours
## Time Block Structure
The indicator divides the trading day into six sequential 90-minute blocks based on New York time:
1. **Box 1**: 07:00 - 08:30 ET
2. **Box 2**: 08:30 - 10:00 ET
3. **Box 3**: 10:00 - 11:30 ET
4. **Box 4**: 11:30 - 13:00 ET
5. **Box 5**: 13:00 - 14:30 ET
6. **Box 6**: 14:30 - 16:00 ET
These time blocks cover the core US trading session from pre-market into regular market hours.
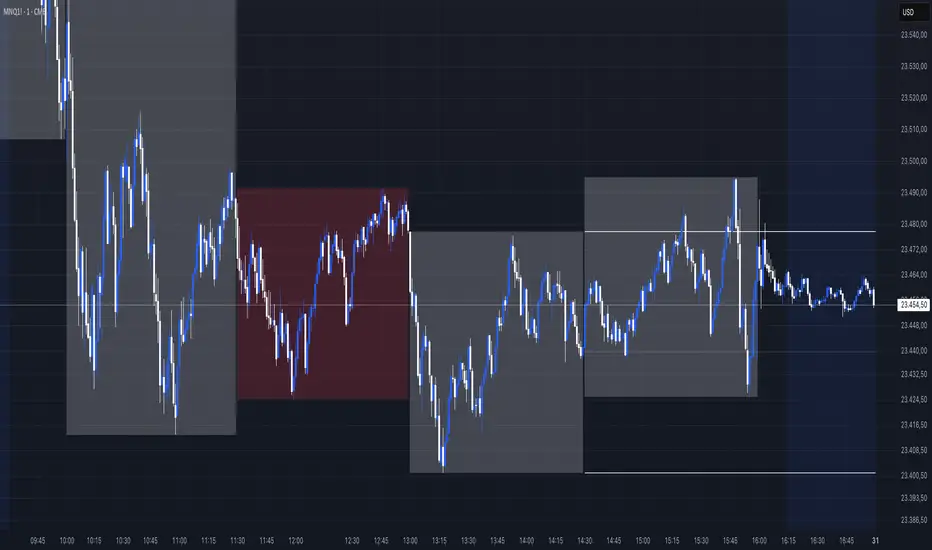
## Visual Representation
Each time block is represented on the chart as a visual box that:
- Spans the exact time period of the block (horizontally)
- Extends from the highest high to the lowest low recorded during that time period (vertically)
- Is displayed with customizable colors and transparency levels
- Automatically builds in real-time as price action develops
Additionally, the indicator draws dashed projection lines that:
- Display the high and low of the most recently completed time block
- Extend forward in time (for up to 24 hours)
- Help traders identify potential support and resistance levels
## Technical Implementation
The indicator employs several key technical features:
1. **Time Detection**: Accurately identifies the current New York time to place each box in the correct time period
2. **Dynamic Box Creation**: Initializes and updates boxes in real-time as price action develops
3. **Range Tracking**: Continuously monitors and adjusts the high and low of each active time block
4. **Projection Lines**: Creates horizontal dashed lines projecting the high and low of the most recently completed time block
5. **Daily Reset**: Automatically resets all boxes and lines at the start of each new trading day
6. **Customization**: Allows users to set custom colors and transparency levels for each time block
This Time Cycles indicator provides traders with a structured framework for analyzing intraday market movements based on specific time periods. By understanding how the market typically behaves during each 90-minute block, traders can develop more targeted strategies and potentially identify higher-probability trading opportunities throughout the trading day.
My-Indicator - Global Liquidity & Money Supply M2 + Time OffsetThis script is designed to visualize a global liquidity and money supply index by combining data from various regions and, optionally, central bank activity. Visualizing this data on a chart allows you to see how central banks are intervening in the financial system and how the total amount of money in the economy is changing. Let’s take a look at how it works:
Central Bank Liquidity
Shows the actions of central banks (e.g. FED, ECB) providing short-term cash to commercial banks. If you see spikes or a steady increase in these indicators, it may suggest that liquidity is being increased through intervention, which often stimulates the market.
Money Supply
M2 money supply is a monetary aggregate that includes M1 (cash and current deposits) plus savings deposits, small term deposits, and other financial instruments that, while not as liquid as M1, can be quickly converted into cash. As a result, M2 provides a broader picture of the available money in the economy, which is useful for analyzing market conditions and potential economic trends.
How does it help investors?
It allows you to quickly see when central banks are injecting additional liquidity, which could signal higher prices.
It allows you to see trends in the money supply, which informs potential changes in inflation and the economic cycle.
Combining both sets of data provides a more complete picture – both in the short and long term – which makes it easier to predict upcoming price movements.
This allows investors to better respond to changes in central bank policy and broader monetary trends, increasing their chances of making better investment decisions.
Data Collection
The script retrieves money supply data for key markets such as the USA (USM2), Europe (EUM2), China (CNM2), and Japan (JPM2). It also offers additional money supply series for other markets—like Canada (CAM2), Great Britain (GBM2), Russia (RUM2), Brazil (BRM2), Mexico (MXM2), and New Zealand (NZM2)—with extra options (e.g., Australia, India, Korea, Indonesia, Malaysia, Sweden) disabled by default. Moreover, you can enable data for central bank liquidity (such as FED, RRP, TGA, ECB, PBC, BOJ, and other central banks), which are also disabled by default.
Index Calculation
The indicator calculates the index by adding together all the enabled money supply series (and the central bank data if activated) and then scales the sum by dividing it by 1,000,000,000,000 (one trillion). This scaling makes the resulting values more manageable and easier to read on the chart.
Time Offset Feature
A key feature of the script is the time offset. With the input parameter "Time Offset (days)", the user can shift the plotted index line by a specific number of days. The script converts the given offset in days into a number of bars based on the current chart's timeframe. This allows you to adjust for the delay between liquidity changes and their effect on asset prices.
Overall, the indicator plots a line on your chart representing the global liquidity and money supply index, allowing you to visually monitor trends and better understand how liquidity and central bank actions may influence market movements.
What makes this script different from others?
Every supported market—both major regions (USA, Eurozone, China, Japan, etc.) and additional ones—is available. You can toggle each series on or off, so you can view only Money Supply data, only Central Bank Liquidity, or any custom combination.
Separated Data Groups. Inputs are organized into clear groups (“Money Supply”, “Other Money Supply”, “Central Bank Liquidity”), making it easy to focus on just the data you need without clutter.
True Day‑Based Offset. This script converts your chosen “Time Offset (days)” into actual days regardless of timeframe. Whether you’re on a 5‑minute or daily chart, the index is always shifted by exactly the number of days you specify.

Zig Zag Trend Metrics“ Zig Zag Trend Metrics ” is a highly versatile indicator, built on the classic Zig Zag concept and thoughtfully designed for technical traders seeking a deeper, more structured view of market dynamics. This tool identifies significant swing highs and lows, classifies them, and annotates each with key metrics, offering a precise snapshot of each movement. It enhances visual analysis by drawing connecting lines that outline the flow of market structure, making trend progression and reversals instantly recognizable. Beyond visual mapping, it features a compact, real-time statistics table that calculates the average price and time deltas for both bullish and bearish swings, giving traders deep insights into trend momentum and rhythm. With extensive customization options, this indicator adapts seamlessly to vast trading styles or chart setups, empowering traders to spot patterns, evaluate trend strength, and make more confident, data-backed decisions.
❖ FEATURES
✦ Automatic Swing Detection
At its core, this indicator automatically identifies swing highs and lows based on a customizable lookback period (default: 10 bars).
✦ Labeling Swing Points
Each swing is visualized with a label that includes:
Swing Classification : “HH” (Higher High), “LH” (Lower High), “LL” (Lower Low), or “HL” (Higher Low).
Price Difference : Displayed in percentage or absolute value from the previous opposite swing.
Time Difference : The number of bars since the previous swing of the opposite type.
These labels offer traders clear, immediate insight into price movements and structural changes.
✦ Visual Lines
The indicator draws three types of lines:
Bullish Lines: Connect recent swing lows to new swing highs, indicating uptrends.
Bearish Lines: Connect recent swing highs to new swing lows, indicating downtrends.
Range Lines: Connect consecutive highs or lows to outline price channels.
Each line type can be color-coded and customized for visibility.
✦ Statistics Table
An on-screen metrics table provides a live summary of trends. Script uses Relative Averaging to smooth price and time changes. This prevents outliers from distorting the data and provides a more reliable sense of typical swing behavior.
Uptrend Metrics: Shows average price and time differences from recent bullish swings.
Downtrend Metrics: Shows the same for bearish swings.
🛠️ Customization Options
Ability to tailor the indicator to suit their strategy and aesthetic preferences:
Swing Period: Adjust sensitivity to short- or long-term swings.
Color Settings: Customize line and label colors.
Label Display: Choose between absolute or percentage price differences.
Table Settings: Modify size, location, or visibility.
This makes the indicator highly flexible and useful across various timeframes and assets.

Bitcoin Polynomial Regression ModelThis is the main version of the script. Click here for the Oscillator part of the script.
💡Why this model was created:
One of the key issues with most existing models, including our own Bitcoin Log Growth Curve Model , is that they often fail to realistically account for diminishing returns. As a result, they may present overly optimistic bull cycle targets (hence, we introduced alternative settings in our previous Bitcoin Log Growth Curve Model).
This new model however, has been built from the ground up with a primary focus on incorporating the principle of diminishing returns. It directly responds to this concept, which has been briefly explored here .
📉The theory of diminishing returns:
This theory suggests that as each four-year market cycle unfolds, volatility gradually decreases, leading to more tempered price movements. It also implies that the price increase from one cycle peak to the next will decrease over time as the asset matures. The same pattern applies to cycle lows and the relationship between tops and bottoms. In essence, these price movements are interconnected and should generally follow a consistent pattern. We believe this model provides a more realistic outlook on bull and bear market cycles.
To better understand this theory, the relationships between cycle tops and bottoms are outlined below:https://www.tradingview.com/x/7Hldzsf2/
🔧Creation of the model:
For those interested in how this model was created, the process is explained here. Otherwise, feel free to skip this section.
This model is based on two separate cubic polynomial regression lines. One for the top price trend and another for the bottom. Both follow the general cubic polynomial function:
ax^3 +bx^2 + cx + d.
In this equation, x represents the weekly bar index minus an offset, while a, b, c, and d are determined through polynomial regression analysis. The input (x, y) values used for the polynomial regression analysis are as follows:
Top regression line (x, y) values:
113, 18.6
240, 1004
451, 19128
655, 65502
Bottom regression line (x, y) values:
103, 2.5
267, 211
471, 3193
676, 16255
The values above correspond to historical Bitcoin cycle tops and bottoms, where x is the weekly bar index and y is the weekly closing price of Bitcoin. The best fit is determined using metrics such as R-squared values, residual error analysis, and visual inspection. While the exact details of this evaluation are beyond the scope of this post, the following optimal parameters were found:
Top regression line parameter values:
a: 0.000202798
b: 0.0872922
c: -30.88805
d: 1827.14113
Bottom regression line parameter values:
a: 0.000138314
b: -0.0768236
c: 13.90555
d: -765.8892
📊Polynomial Regression Oscillator:
This publication also includes the oscillator version of the this model which is displayed at the bottom of the screen. The oscillator applies a logarithmic transformation to the price and the regression lines using the formula log10(x) .
The log-transformed price is then normalized using min-max normalization relative to the log-transformed top and bottom regression line with the formula:
normalized price = log(close) - log(bottom regression line) / log(top regression line) - log(bottom regression line)
This transformation results in a price value between 0 and 1 between both the regression lines. The Oscillator version can be found here.
🔍Interpretation of the Model:
In general, the red area represents a caution zone, as historically, the price has often been near its cycle market top within this range. On the other hand, the green area is considered an area of opportunity, as historically, it has corresponded to the market bottom.
The top regression line serves as a signal for the absolute market cycle peak, while the bottom regression line indicates the absolute market cycle bottom.
Additionally, this model provides a predicted range for Bitcoin's future price movements, which can be used to make extrapolated predictions. We will explore this further below.
🔮Future Predictions:
Finally, let's discuss what this model actually predicts for the potential upcoming market cycle top and the corresponding market cycle bottom. In our previous post here , a cycle interval analysis was performed to predict a likely time window for the next cycle top and bottom:
In the image, it is predicted that the next top-to-top cycle interval will be 208 weeks, which translates to November 3rd, 2025. It is also predicted that the bottom-to-top cycle interval will be 152 weeks, which corresponds to October 13th, 2025. On the macro level, these two dates align quite well. For our prediction, we take the average of these two dates: October 24th 2025. This will be our target date for the bull cycle top.
Now, let's do the same for the upcoming cycle bottom. The bottom-to-bottom cycle interval is predicted to be 205 weeks, which translates to October 19th, 2026, and the top-to-bottom cycle interval is predicted to be 259 weeks, which corresponds to October 26th, 2026. We then take the average of these two dates, predicting a bear cycle bottom date target of October 19th, 2026.
Now that we have our predicted top and bottom cycle date targets, we can simply reference these two dates to our model, giving us the Bitcoin top price prediction in the range of 152,000 in Q4 2025 and a subsequent bottom price prediction in the range of 46,500 in Q4 2026.
For those interested in understanding what this specifically means for the predicted diminishing return top and bottom cycle values, the image below displays these predicted values. The new values are highlighted in yellow:
And of course, keep in mind that these targets are just rough estimates. While we've done our best to estimate these targets through a data-driven approach, markets will always remain unpredictable in nature. What are your targets? Feel free to share them in the comment section below.

Bitcoin Polynomial Regression OscillatorThis is the oscillator version of the script. Click here for the other part of the script.
💡Why this model was created:
One of the key issues with most existing models, including our own Bitcoin Log Growth Curve Model , is that they often fail to realistically account for diminishing returns. As a result, they may present overly optimistic bull cycle targets (hence, we introduced alternative settings in our previous Bitcoin Log Growth Curve Model).
This new model however, has been built from the ground up with a primary focus on incorporating the principle of diminishing returns. It directly responds to this concept, which has been briefly explored here .
📉The theory of diminishing returns:
This theory suggests that as each four-year market cycle unfolds, volatility gradually decreases, leading to more tempered price movements. It also implies that the price increase from one cycle peak to the next will decrease over time as the asset matures. The same pattern applies to cycle lows and the relationship between tops and bottoms. In essence, these price movements are interconnected and should generally follow a consistent pattern. We believe this model provides a more realistic outlook on bull and bear market cycles.
To better understand this theory, the relationships between cycle tops and bottoms are outlined below:https://www.tradingview.com/x/7Hldzsf2/
🔧Creation of the model:
For those interested in how this model was created, the process is explained here. Otherwise, feel free to skip this section.
This model is based on two separate cubic polynomial regression lines. One for the top price trend and another for the bottom. Both follow the general cubic polynomial function:
ax^3 +bx^2 + cx + d.
In this equation, x represents the weekly bar index minus an offset, while a, b, c, and d are determined through polynomial regression analysis. The input (x, y) values used for the polynomial regression analysis are as follows:
Top regression line (x, y) values:
113, 18.6
240, 1004
451, 19128
655, 65502
Bottom regression line (x, y) values:
103, 2.5
267, 211
471, 3193
676, 16255
The values above correspond to historical Bitcoin cycle tops and bottoms, where x is the weekly bar index and y is the weekly closing price of Bitcoin. The best fit is determined using metrics such as R-squared values, residual error analysis, and visual inspection. While the exact details of this evaluation are beyond the scope of this post, the following optimal parameters were found:
Top regression line parameter values:
a: 0.000202798
b: 0.0872922
c: -30.88805
d: 1827.14113
Bottom regression line parameter values:
a: 0.000138314
b: -0.0768236
c: 13.90555
d: -765.8892
📊Polynomial Regression Oscillator:
This publication also includes the oscillator version of the this model which is displayed at the bottom of the screen. The oscillator applies a logarithmic transformation to the price and the regression lines using the formula log10(x) .
The log-transformed price is then normalized using min-max normalization relative to the log-transformed top and bottom regression line with the formula:
normalized price = log(close) - log(bottom regression line) / log(top regression line) - log(bottom regression line)
This transformation results in a price value between 0 and 1 between both the regression lines.
🔍Interpretation of the Model:
In general, the red area represents a caution zone, as historically, the price has often been near its cycle market top within this range. On the other hand, the green area is considered an area of opportunity, as historically, it has corresponded to the market bottom.
The top regression line serves as a signal for the absolute market cycle peak, while the bottom regression line indicates the absolute market cycle bottom.
Additionally, this model provides a predicted range for Bitcoin's future price movements, which can be used to make extrapolated predictions. We will explore this further below.
🔮Future Predictions:
Finally, let's discuss what this model actually predicts for the potential upcoming market cycle top and the corresponding market cycle bottom. In our previous post here , a cycle interval analysis was performed to predict a likely time window for the next cycle top and bottom:
In the image, it is predicted that the next top-to-top cycle interval will be 208 weeks, which translates to November 3rd, 2025. It is also predicted that the bottom-to-top cycle interval will be 152 weeks, which corresponds to October 13th, 2025. On the macro level, these two dates align quite well. For our prediction, we take the average of these two dates: October 24th 2025. This will be our target date for the bull cycle top.
Now, let's do the same for the upcoming cycle bottom. The bottom-to-bottom cycle interval is predicted to be 205 weeks, which translates to October 19th, 2026, and the top-to-bottom cycle interval is predicted to be 259 weeks, which corresponds to October 26th, 2026. We then take the average of these two dates, predicting a bear cycle bottom date target of October 19th, 2026.
Now that we have our predicted top and bottom cycle date targets, we can simply reference these two dates to our model, giving us the Bitcoin top price prediction in the range of 152,000 in Q4 2025 and a subsequent bottom price prediction in the range of 46,500 in Q4 2026.
For those interested in understanding what this specifically means for the predicted diminishing return top and bottom cycle values, the image below displays these predicted values. The new values are highlighted in yellow:
And of course, keep in mind that these targets are just rough estimates. While we've done our best to estimate these targets through a data-driven approach, markets will always remain unpredictable in nature. What are your targets? Feel free to share them in the comment section below.

Adaptive Trend FinderAdaptive Trend Finder - The Ultimate Trend Detection Tool
Introducing Adaptive Trend Finder, the next evolution of trend analysis on TradingView. This powerful indicator is an enhanced and refined version of Adaptive Trend Finder (Log), designed to offer even greater flexibility, accuracy, and ease of use.
What’s New?
Unlike the previous version, Adaptive Trend Finder allows users to fully configure and adjust settings directly within the indicator menu, eliminating the need to modify chart settings manually. A major improvement is that users no longer need to adjust the chart's logarithmic scale manually in the chart settings; this can now be done directly within the indicator options, ensuring a smoother and more efficient experience. This makes it easier to switch between linear and logarithmic scaling without disrupting the analysis. This provides a seamless user experience where traders can instantly adapt the indicator to their needs without extra steps.
One of the most significant improvements is the complete code overhaul, which now enables simultaneous visualization of both long-term and short-term trend channels without needing to add the indicator twice. This not only improves workflow efficiency but also enhances chart readability by allowing traders to monitor multiple trend perspectives at once.
The interface has been entirely redesigned for a more intuitive user experience. Menus are now clearer, better structured, and offer more customization options, making it easier than ever to fine-tune the indicator to fit any trading strategy.
Key Features & Benefits
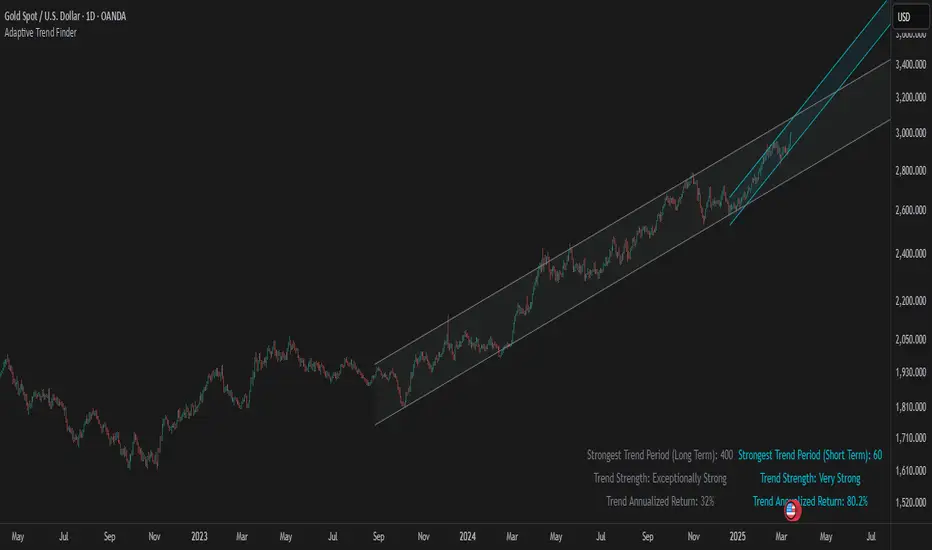
Automatic Trend Period Selection: The indicator dynamically identifies and applies the strongest trend period, ensuring optimal trend detection with no manual adjustments required. By analyzing historical price correlations, it selects the most statistically relevant trend duration automatically.
Dual Channel Display: Traders can view both long-term and short-term trend channels simultaneously, offering a broader perspective of market movements. This feature eliminates the need to apply the indicator twice, reducing screen clutter and improving efficiency.
Fully Adjustable Settings: Users can customize trend detection parameters directly within the indicator settings. No more switching chart settings – everything is accessible in one place.
Trend Strength & Confidence Metrics: The indicator calculates and displays a confidence score for each detected trend using Pearson correlation values. This helps traders gauge the reliability of a given trend before making decisions.
Midline & Channel Transparency Options: Users can fine-tune the visibility of trend channels, adjusting transparency levels to fit their personal charting style without overwhelming the price chart.
Annualized Return Calculation: For daily and weekly timeframes, the indicator provides an estimate of the trend’s performance over a year, helping traders evaluate potential long-term profitability.
Logarithmic Adjustment Support: Adaptive Trend Finder is compatible with both logarithmic and linear charts. Traders who analyze assets like cryptocurrencies, where log scaling is common, can enable this feature to refine trend calculations.
Intuitive & User-Friendly Interface: The updated menu structure is designed for ease of use, allowing quick and efficient modifications to settings, reducing the learning curve for new users.
Why is this the Best Trend Indicator?
Adaptive Trend Finder stands out as one of the most advanced trend analysis tools available on TradingView. Unlike conventional trend indicators, which rely on fixed parameters or lagging signals, Adaptive Trend Finder dynamically adjusts its settings based on real-time market conditions. By combining automatic trend detection, dual-channel visualization, real-time performance metrics, and an intuitive user interface, this indicator offers an unparalleled edge in trend identification and trading decision-making.
Traders no longer have to rely on guesswork or manually tweak settings to identify trends. Adaptive Trend Finder does the heavy lifting, ensuring that users are always working with the strongest and most reliable trends. The ability to simultaneously display both short-term and long-term trends allows for a more comprehensive market overview, making it ideal for scalpers, swing traders, and long-term investors alike.
With its state-of-the-art algorithms, fully customizable interface, and professional-grade accuracy, Adaptive Trend Finder is undoubtedly one of the most powerful trend indicators available.
Try it today and experience the future of trend analysis.
This indicator is a technical analysis tool designed to assist traders in identifying trends. It does not guarantee future performance or profitability. Users should conduct their own research and apply proper risk management before making trading decisions.
// Created by Julien Eche - @Julien_Eche
Fibonacci Cycle Finder🟩 Fibonacci Cycle Finder is an indicator designed to explore Fibonacci-based waves and cycles through visualization and experimentation, introducing a trigonometric approach to market structure analysis. Unlike traditional Fibonacci tools that rely on static horizontal levels, this indicator incorporates the dynamic nature of market cycles, using adjustable wavelength, phase, and amplitude settings to visualize the rhythm of price movements. By applying a sine function, it provides a structured way to examine Fibonacci relationships in a non-linear context.
Fibonacci Cycle Finder unifies Fibonacci principles with a wave-based method by employing adjustable parameters to align each wave with real-time price action. By default, the wave begins with minimal curvature, preserving the structural familiarity of horizontal Fibonacci retracements. By adjusting the input parameters, the wave can subtly transition from a horizontal line to a more pronounced cycle,visualizing cyclical structures within price movement. This projective structure extends potential cyclical outlines on the chart, opening deeper exploration of how Fibonacci relationships may emerge over time.
Fibonacci Cycle Finder further underscores a non-linear representation of price by illustrating how wave-based logic can uncover shifts that are missed by static retracement tools. Rather than imposing immediate oscillatory behavior, the indicator encourages a progressive approach, where the parameters may be incrementally modified to align wave structures with observed price action. This refinement process deepens the exploration of Fibonacci relationships, offering a systematic way to experiment with non-linear price dynamics. In doing so, it revisits fundamental Fibonacci concepts, demonstrating their broader adaptability beyond fixed horizontal retracements.
🌀 THEORY & CONCEPT 🌀
What if Fibonacci relationships could be visualized as dynamic waves rather than confined to fixed horizontal levels? Fibonacci Cycle Finder introduces a trigonometric approach to market structure analysis, offering a different perspective on Fibonacci-based cycles. This tool provides a way to visualize market fluctuations through cyclical wave motion, opening the door to further exploration of Fibonacci’s role in non-linear price behavior.
Traditional Fibonacci tools, such as retracements and extensions, have long been used to identify potential support and resistance levels. While valuable for analyzing price trends, these tools assume linear price movement and rely on static horizontal levels. However, market fluctuations often exhibit cyclical tendencies , where price follows natural wave-like structures rather than strictly adhering to fixed retracement points. Although Fibonacci-based tools such as arcs, fans, and time zones attempt to address these patterns, they primarily apply geometric projections. The Fibonacci Cycle Finder takes a different approach by mapping Fibonacci ratios along structured wave cycles, aligning these relationships with the natural curvature of market movement rather than forcing them onto rigid price levels.
Rather than replacing traditional Fibonacci methods, the Fibonacci Cycle Finder supplements existing Fibonacci theory by introducing an exploratory approach to price structure analysis. It encourages traders to experiment with how Fibonacci ratios interact with cyclical price structures, offering an additional layer of insight beyond static retracements and extensions. This approach allows Fibonacci levels to be examined beyond their traditional static form, providing deeper insights into market fluctuations.
📊 FIBONACCI WAVE IMPLEMENTATION 📊
The Fibonacci Cycle Finder uses two user-defined swing points, A and B, as the foundation for projecting these Fibonacci waves. It first establishes standard horizontal levels that correspond to traditional Fibonacci retracements, ensuring a baseline reference before wave adjustments are applied. By default, the wave is intentionally subtle— Wavelength is set to 1 , Amplitude is set to 1 , and Phase is set to 0 . In other words, the wave starts as “stretched out.” This allows a slow, measured start, encouraging users to refine parameters incrementally rather than producing abrupt oscillations. As these parameters are increased, the wave takes on more distinct sine and cosine characteristics, offering a flexible approach to exploring Fibonacci-based cyclicity within price action.
Three parameters control the shape of the Fibonacci wave:
1️⃣ Wavelength Controls the horizontal spacing of the wave along the time axis, determining the length of one full cycle from peak to peak (or trough to trough). In this indicator, Wavelength acts as a scaling input that adjusts how far the wave extends across time, rather than a strict mathematical “wavelength.” Lower values further stretch the wave, increasing the spacing between oscillations, while higher values compress it into a more frequent cycle. Each full cycle is divided into four quarter-cycle segments, a deliberate design choice to minimize curvature by default. This allows for subtle oscillations and smoother transitions, preventing excessive distortion while maintaining flexibility in wave projections. The wavelength is calculated relative to the A-B swing, ensuring that its scale adapts dynamically to the selected price range.
2️⃣ Amplitude Defines the vertical displacement of the wave relative to the baseline Fibonacci level. Higher values increase the height of oscillations, while lower values reduce the height, Negative values will invert the wave’s initial direction. The amplitude is dynamically applied in relation to the A-B swing direction, ensuring that an upward swing results in upward oscillations and a downward swing results in downward oscillations.
3️⃣ Phase Shifts the wave’s starting position along its cycle, adjusting alignment relative to the swing points. A phase of 0 aligns with a sine wave, where the cycle starts at zero and rises. A phase of 25 aligns with a cosine wave, starting at a peak and descending. A phase of 50 inverts the sine wave, beginning at zero but falling first, while a phase of 75 aligns with an inverted cosine , starting at a trough and rising. Intermediate values between these phases create gradual shifts in wave positioning, allowing for finer alignment with observed market structures.
By fine-tuning these parameters, users can adapt Fibonacci waves to better reflect observed market behaviors. The wave structure integrates with price movements rather than simply overlaying static levels, allowing for a more dynamic representation of cyclical price tendencies. This indicator serves as an exploratory tool for understanding potential market rhythms, encouraging traders to test and visualize how Fibonacci principles extend beyond their traditional applications.
🖼️ CHART EXAMPLES 🖼️
Following this downtrend, price interacts with curved Fibonacci levels, highlighting resistance at the 0.236 and 0.382 levels, where price stalls before pulling back. Support emerges at the 0.5, 0.618, and 0.786 levels, where price finds stability and rebounds
In this Fibonacci retracement, price initially finds support at the 1.0 level, following the natural curvature of the cycle. Resistance forms at 0.786, leading to a pullback before price breaks through and tests 0.618 as resistance. Once 0.618 is breached, price moves upward to test 0.5, illustrating how Fibonacci-based cycles may align with evolving market structure beyond static, horizontal retracements.
Following this uptrend, price retraces downward and interacts with the Fibonacci levels, demonstrating both support and resistance at key levels such as 0.236, 0.382, 0.5, and 0.618.
With only the 0.5 and 1.0 levels enabled, this chart remains uncluttered while still highlighting key price interactions. The short cycle length results in a mild curvature, aligning smoothly with market movement. Price finds resistance at the 0.5 level while showing strong support at 1.0, which follows the natural flow of the market. Keeping the focus on fewer levels helps maintain clarity while still capturing how price reacts within the cycle.
🛠️ CONFIGURATION AND SETTINGS 🛠️
Wave Parameters
Wavelength : Stretches or compresses the wave along the time axis, determining the length of one full cycle. Higher values extend the wave across more bars, while lower values compress it into a shorter time frame.
Amplitude : Expands or contracts the wave along the price axis, determining the height of oscillations relative to Fibonacci levels. Higher values increase the vertical range, while negative values invert the wave’s initial direction.
Phase : Offsets the wave along the time axis, adjusting where the cycle begins. Higher values shift the starting position forward within the wave pattern.
Fibonacci Levels
Levels : Enable or disable specific Fibonacci levels (0.0, 0.236, 0.382, 0.5, 0.618, 0.786, 1.0) to focus on relevant price zones.
Color : Modify level colors for enhanced visual clarity.
Visibility
Trend Line/Color : Toggle and customize the trend line connecting swing points A and B.
Setup Lines : Show or hide lines linking Fibonacci levels to projected waves.
A/B Labels Visibility : Control the visibility of swing point labels.
Left/Right Labels : Manage the display of Fibonacci level labels on both sides of the chart.
Fill % : Adjust shading intensity between Fibonacci levels (0% = no fill, 100% = maximum fill).
A and B Points (Time/Price):
These user-defined anchor points serve as the basis for Fibonacci wave calculations and can be manually set. A and B points can also be adjusted directly on the chart, with automatic synchronization to the settings panel, allowing for seamless modifications without needing to manually input values.
⚠️ DISCLAIMER ⚠️
The Fibonacci Cycle Finder is a visual analysis tool designed to illustrate Fibonacci relationships and serve as a supplement to traditional Fibonacci tools. While the indicator employs mathematical and geometric principles, no guarantee is made that its calculations will align with other Fibonacci tools or proprietary methods. Like all technical and visual indicators, the Fibonacci levels generated by this tool may appear to visually align with key price zones in hindsight. However, these levels are not intended as standalone signals for trading decisions. This indicator is intended for educational and analytical purposes, complementing other tools and methods of market analysis.
🧠 BEYOND THE CODE 🧠
Fibonacci Cycle Finder is the latest indicator in the Fibonacci Geometry Series. Building on the concepts of the Fibonacci Time-Price Zones and the Fibonacci 3-D indicators, this tool introduces a trigonometric approach to market structure analysis.
The Fibonacci Cycle Finder indicator, like other xxattaxx indicators , is designed to encourage both education and community engagement. Your feedback and insights are invaluable to refining and enhancing the Fibonacci Cycle Finder indicator. We look forward to the creative applications, observations, and discussions this tool inspires within the trading community.

MF TimeWaves Predictor: Find future Top and Bottom PivotsThe script allows to predict future pivot tops and bottoms "dates" by studying the chart.
For it, it detects the past pivots and project new ones on the future
It might be useful for swing trading
You might want to enable the "Automatically modify settings" options if you want to use my default settings for different timeframes
Note: It does not offers any prediction for future prices, just dates
Enjoy!

Monthly Drawdowns and Moves UP This script allows users to analyze the performance of a specific month across multiple years, focusing on maximum drawdowns and maximum upward moves within the selected month. The script offers the following features:
Dynamic Month Selection : Choose any month to analyze using an intuitive dropdown menu.
Maximum Drawdown and Upward Move Calculations :
Calculate the largest percentage drop (drawdown) and rise (move up) for the selected month each year.
Visual Highlights :
The selected month is visually highlighted on the chart with a semi-transparent overlay.
Dynamic Labels:
Labels display the maximum drawdown and upward move directly on the chart for better visualization.
Comprehensive Table Summary:
A table provides a year-by-year summary of the maximum drawdowns and upward moves for the selected month, making it easy to spot trends over time.
Customizable Display Options:
Toggle the visibility of drawdown labels, move-up labels, and the summary table for a clutter-free experience.
This tool is perfect for traders and analysts looking to identify seasonal patterns, assess risk and opportunity, and gain deeper insights into monthly performance metrics across years. Customize, explore, and make informed decisions with this powerful Pine Script indicator.

Weighted Fourier Transform: Spectral Gating & Main Frequency🙏🏻 This drop has 2 purposes:
1) to inform every1 who'd ever see it that Weighted Fourier Tranform does exist, while being available nowhere online, not even in papers, yet there's nothing incredibly complicated about it, and it can/should be used in certain cases;
2) to show TradingView users how they can use it now in dem endevours, to show em what spectral filtering is, and what can they do with all of it in diy mode.
... so we gonna have 2 sections in the description
Section 1: Weighted Fourier Transform
It's quite easy to include weights in Fourier analysis: you just premultiply each datapoint by its corresponding weight -> feed to direct Fourier Transform, and then divide by weights after inverse Fourier transform. Alternatevely, in direct transform you just multiply contributions of each data point to the real and imaginary parts of the Fourier transform by corresponding weights (in accumulation phase), and in inverse transform you divide by weights instead during the accumulation phase. Everything else stays the same just like in non-weighted version.
If you're from the first target group let's say, you prolly know a thing or deux about how to code & about Fourier Transform, so you can just check lines of code to see the implementation of Weighted Discrete version of Fourier Transform, and port it to to any technology you desire. Pine Script is a developing technology that is incredibly comfortable in use for quant-related tasks and anything involving time series in general. While also using Python for research and C++ for development, every time I can do what I want in Pine Script, I reach for it and never touch matlab, python, R, or anything else.
Weighted version allows you to explicetly include order/time information into the operation, which is essential with every time series, although not widely used in mainstream just as many other obvious and right things. If you think deeply, you'll understand that you can apply a usual non-weighted Fourier to any 2d+ data you can (even if none of these dimensions represent time), because this is a geometric tool in essence. By applying linearly decaying weights inside Fourier transform, you're explicetly saying, "one of these dimensions is Time, and weights represent the order". And obviously you can combine multiple weightings, eg time and another characteristic of each datum, allows you to include another non-spatial dimension in your model.
By doing that, on properly processed (not only stationary but Also centered around zero data), you can get some interesting results that you won't be able to recreate without weights:
^^ A sine wave, centered around zero, period of 16. Gray line made by: DWFT (direct weighted Fourier transform) -> spectral gating -> IWFT (inverse weighted Fourier transform) -> plotting the last value of gated reconstructed data, all applied to expanding window. Look how precisely it follows the original data (the sine wave) with no lag at all. This can't be done by using non-weighted version of Fourier transform.
^^ spectral filtering applied to the whole dataset, calculated on the latest data update
And you should never forget about Fast Fourier Transform, tho it needs recursion...
Section 2: About use cases for quant trading, about this particular implementaion in Pine Script 6 (currently the latest version as of Friday 13, December 2k24).
Given the current state of things, we have certain limits on matrix size on TradingView (and we need big dope matrixes to calculate polynomial regression -> detrend & center our data before Fourier), and recursion is not yet available in Pine Script, so the script works on short datasets only, and requires some time.
A note on detrending. For quality results, Fourier Transform should be applied to not only stationary but also centered around zero data. The rightest way to do detrending of time series
is to fit Cumulative Weighted Moving Polynomial Regression (known as WLSMA in some narrow circles xD) and calculate the deltas between datapoint at time t and this wonderful fit at time t. That's exactly what you see on the main chart of script description: notice the distances between chart and WLSMA, now look lower and see how it matches the distances between zero and purple line in WFT study. Using residuals of one regression fit of the whole dataset makes less sense in time series context, we break some 'time' and order rules in a way, tho not many understand/cares abouit it in mainstream quant industry.
Two ways of using the script:
Spectral Gating aka Spectral filtering. Frequency domain filtering is quite responsive and for a greater computational cost does not introduce a lag the way it works with time-domain filtering. Works this way: direct Fourier transform your data to get frequency & phase info -> compute power spectrum out of it -> zero out all dem freqs that ain't hit your threshold -> inverse Fourier tranform what's left -> repeat at each datapoint plotting the very first value of reconstructed array*. With this you can watch for zero crossings to make appropriate trading decisions.
^^ plot Freq pass to use the script this way, use Level setting to control the intensity of gating. These 3 only available values: -1, 0 and 1, are the general & natural ones.
* if you turn on labels in script's style settings, you see the gray dots perfectly fitting your data. They get recalculated (for the whole dataset) at each update. You call it repainting, this is for analytical & aesthetic purposes. Included for demonstration only.
Finding main/dominant frequency & period. You can use it to set up Length for your other studies, and for analytical purposes simply to understand the periodicity of your data.
^^ plot main frequency/main period to use the script this way. On the screenshot, you can see the script applied to sine wave of period 16, notice how many datapoints it took the algo to figure out the signal's period quite good in expanding window mode
Now what's the next step? You can try applying signal windowing techniques to make it all less data-driven but your ego-driven, make a weighted periodogram or autocorrelogram (check Wiener-Khinchin Theorem ), and maybe whole shiny spectrogram?
... you decide, choice is yours,
The butterfly reflect the doors ...
∞

2-Year MA Multiplier [UAlgo]The 2-Year MA Multiplier is a technical analysis tool designed to assist traders and investors in identifying potential overbought and oversold conditions in the market. By plotting the 2-year moving average (MA) of an asset's closing price alongside an upper band set at five times this moving average, the indicator provides visual cues to assess long-term price trends and significant market movements.
🔶 Key Features
2-Year Moving Average (MA): Calculates the simple moving average of the asset's closing price over a 730-day period, representing approximately two years.
Visual Indicators: Plots the 2-year MA in forest green and the upper band in firebrick red for clear differentiation.
Fills the area between the 2-year MA and the upper band to highlight the normal trading range.
Uses color-coded fills to indicate overbought (tomato red) and oversold (cornflower blue) conditions based on the asset's closing price relative to the bands.
🔶 Idea
The concept behind the 2-Year MA Multiplier is rooted in the cyclical nature of markets, particularly in assets like Bitcoin. By analyzing long-term price movements, the indicator aims to identify periods of significant deviation from the norm, which may signal potential buying or selling opportunities.
2-year MA smooths out short-term volatility, providing a clearer view of the asset's long-term trend. This timeframe is substantial enough to capture major market cycles, making it a reliable baseline for analysis.
Multiplying the 2-year MA by five establishes an upper boundary that has historically correlated with market tops. When the asset's price exceeds this upper band, it may indicate overbought conditions, suggesting a potential for price correction. Conversely, when the price falls below the 2-year MA, it may signal oversold conditions, presenting potential buying opportunities.
🔶 Disclaimer
Use with Caution: This indicator is provided for educational and informational purposes only and should not be considered as financial advice. Users should exercise caution and perform their own analysis before making trading decisions based on the indicator's signals.
Not Financial Advice: The information provided by this indicator does not constitute financial advice, and the creator (UAlgo) shall not be held responsible for any trading losses incurred as a result of using this indicator.
Backtesting Recommended: Traders are encouraged to backtest the indicator thoroughly on historical data before using it in live trading to assess its performance and suitability for their trading strategies.
Risk Management: Trading involves inherent risks, and users should implement proper risk management strategies, including but not limited to stop-loss orders and position sizing, to mitigate potential losses.
No Guarantees: The accuracy and reliability of the indicator's signals cannot be guaranteed, as they are based on historical price data and past performance may not be indicative of future results.

Weekly Stacked Daily Changes [LuxAlgo]The Weekly Stacked Daily Changes tool allows traders to compare daily net price changes for each day of the week, stacked by week. It provides a very convenient way to compare daily and weekly volatility at the same time.
🔶 USAGE
The tool requires no configuration and works perfectly out of the box, displaying the net price change for each day of the week as stacked boxes of the appropriate size.
Traders can adjust the width of the columns and the spacing between days and weeks, options to change the color and disable the months and new month lines are also available.
🔹 Bottom Stack Bias
This feature allows traders to compare weekly volatility in two different ways.
With this feature disabled, all weeks use zero as the bottom of the stack, so traders can see at a glance weeks with more volatility and weeks with less volatility.
Enabling this feature will cause the tool to display the stacks with the weekly net price change as the bottom, so if a stack starts below the zero line it means that week has a negative net return, and if it starts above the zero line it means that week has a positive net return.
🔶 SETTINGS
Width: Select the fixed width for each column.
Offset: Choose the fixed width between each column.
Spacing: Select the distance between each day within each column.
🔹 Style
Bottom Stack Bias: Use weekly net price change as the bottom of the stack.
Bullish Change: Color for days with positive net price change
Bearish Change: Color for days with negative net price change
Show Months: Under each week stack, display the month
Show Months Delimiter: Display a line indicating the start of a new month

[TheMandalor] Invert or Mirror Chart SUPPORT RESSISTANTThis is a new idea to find supports and resistant’s for any charts.
What is the concept of this indicator:
1. It is used close and inverted it on chart
2. When the real chart and the inverted chart is crossing together several times, this point will be important on this concept that means the price will care about this point again and again.
3. When you draw a horizontal line as support and resistance check it with this indicator too, if your support and resistance is touched with inverted chart, it will be more important than normal support/ resistance.
4. This indicator has plot candle too, it means you can compare regular chart with the inverted one at same time if you need.
Here is the steps:
1. When you add the indicator to your chart it will add your ticker as inverted.
2. Change your chart type to line chart.
3. Fix your scale in both sides left and right (the indicator's side is on the left).
4. Now you must have two type of line charts, one is yours (The blue one) and one is plotted with this indicator (The purple one).
5. Draw a horizontal line where these two lines have more crossing at the middle of chart, this line will be a powerful line later.
6. Find other more crossed points and draw horizontal line for them too.
7. Now you can see these indicator's support and resistant’s, now you can remove the indicator and watch how the price will touch, reverse, or stay on your new type of support and resistant’s lines.
PS: I have added candle plotting too if you need it.

Hodrick-Prescott Cycle Component (YavuzAkbay)The Hodrick-Prescott Cycle Component indicator in Pine Script™ is an advanced tool that helps traders isolate and analyze the cyclical deviations in asset prices from their underlying trend. This script calculates the cycle component of the price series using the Hodrick-Prescott (HP) filter, allowing traders to observe and interpret the short-term price movements around the long-term trend. By providing two views—Percentage and Price Difference—this indicator gives flexibility in how these cyclical movements are visualized and interpreted.
What This Script Does
This indicator focuses exclusively on the cycle component of the price, which is the deviation of the current price from the long-term trend calculated by the HP filter. This deviation (or "cycle") is what traders analyze for mean-reversion opportunities and overbought/oversold conditions. The script allows users to see this deviation in two ways:
Percentage Difference: Shows the deviation as a percentage of the trend, giving a normalized view of the price’s distance from its trend component.
Price Difference: Shows the deviation in absolute price terms, reflecting how many price units the price is above or below the trend.
How It Works
Trend Component Calculation with the HP Filter: Using the HP filter, the script isolates the trend component of the price. The smoothness of this trend is controlled by the smoothness parameter (λ), which can be adjusted by the user. A higher λ value results in a smoother trend, while a lower λ value makes it more responsive to short-term changes.
Cycle Component Calculation: Percentage Deviation (cycle_pct) calculated as the difference between the current price and the trend, divided by the trend, and then multiplied by 100. This metric shows how far the price deviates from the trend in relative terms. Price Difference (cycle_price) simply the difference between the current price and the trend component, displaying the deviation in absolute price units.
Conditional Plotting: The user can choose to view the cycle component as either a percentage or a price difference by selecting the Display Mode input. The indicator will plot the chosen mode in a separate pane, helping traders focus on the preferred measure of deviation.
How to Use This Indicator
Identify Overbought/Oversold Conditions: When the cycle component deviates significantly from the zero line (shown with a dashed horizontal line), it may indicate overbought or oversold conditions. For instance, a high positive cycle component suggests the price may be overbought relative to the trend, while a large negative cycle suggests potential oversold conditions.
Mean-Reversion Strategy: In mean-reverting markets, traders can use this indicator to spot potential reversal points. For example, if the cycle component shows an extreme deviation from zero, it could signal that the price is likely to revert to the trend. This can help traders with entry and exit points when the asset is expected to correct back toward its trend.
Trend Strength and Cycle Analysis: By comparing the magnitude and duration of deviations, traders can gauge the strength of cycles and assess if a new trend might be forming. If the cycle component remains consistently positive or negative, it may indicate a persistent market bias, even as prices fluctuate around the trend.
Percentage vs. Price Difference Views: Use the Percentage Difference mode to standardize deviations and compare across assets or different timeframes. This is especially helpful when analyzing assets with varying price levels. Use the Price Difference mode when an absolute deviation (price units) is more intuitive for spotting overbought/oversold levels based on the asset’s actual price.
Using with Hodrick-Prescott: You can also use Hodrick-Prescott, another indicator that I have adapted to the Tradingview platform, to see the trend on the chart, and you can also use this indicator to see how far the price is deviating from the trend. This gives you a multifaceted perspective on your trades.
Practical Tips for Traders
Set the Smoothness Parameter (λ): Adjust the λ parameter to match your trading timeframe and asset characteristics. Lower values make the trend more sensitive, which might suit short-term trading, while higher values smooth out the trend for long-term analysis.
Cycle Component as Confirmation: Combine this indicator with other momentum or trend indicators for confirmation of overbought/oversold signals. For example, use the cycle component with RSI or MACD to validate the likelihood of mean-reversion.
Observe Divergences: Divergences between price movements and the cycle component can indicate potential reversals. If the price hits a new high, but the cycle component shows a smaller deviation than previous highs, it could signal a weakening trend.

Weierstrass Function (Fractal Cycles)THE WEIERSTRASS FUNCTION
f(x) = ∑(n=0)^∞ a^n * cos(b^n * π * x)
The Weierstrass Function is the sum of an infinite series of cosine functions, each with increasing frequency and decreasing amplitude. This creates powerful multi-scale oscillations within the range ⬍(-2;+2), resembling a system of self-repetitive patterns. You can zoom into any part of the output and observe similar proportions, mimicking the hidden order behind the irregularity and unpredictability of financial markets.
IT DOESN’T RELY ON ANY MARKET DATA, AS THE OUTPUT IS BASED PURELY ON A MATHEMATICAL FORMULA!
This script does not provide direct buy or sell signals and should be used as a tool for analyzing the market behavior through fractal geometry. The function is often used to model complex, chaotic systems, including natural phenomena and financial markets.
APPLICATIONS:
Timing Aspect: Identifies the phases of market cycles, helping to keep awareness of frequency of turning points
Price-Modeling features: The Amplitude, frequency, and scaling settings allow the indicator to simulate the trends and oscillations. Its nowhere-differentiable nature aligns with the market's inherent uncertainty. The fractured oscillations resemble sharp jumps, noise, and dips found in volatile markets.
SETTINGS
Amplitude Factor (a): Controls the size of each wave. A higher value makes the waves larger.
Frequency Factor (b): Determines how fast the waves oscillate. A higher value creates more frequent waves.
Ability to Invert the output: Just like any cosine function it starts its journey with a decline, which is not distinctive to the behavior of most assets. The default setting is in "inverted mode".
Scale Factor: Adjusts the speed at which the oscillations grow over time.
Number of Terms (n_terms): Increases the number of waves. More terms add complexity to the pattern.

Gabriel's Cyclic Smoothed RSI [Enhanced]Overview
Gabriel's Cyclic Smoothed RSI (short title: cRSI ) is a sophisticated technical indicator developed to provide traders with deeper insights into market rhythms and price momentum. Building upon the traditional Relative Strength Index (RSI), this enhanced version incorporates dynamic cycle analysis, divergence detection, and optional stochastic oscillators to deliver a more nuanced understanding of market conditions.
Key Features
Cyclic Smoothed RSI (cRSI):
Adaptive Momentum: The cRSI adapts to the dominant market cycle, providing a smoothed RSI that reacts dynamically to price changes.
Ultra-Smooth & Zero-Lag: Designed to minimize lag, ensuring timely signals that closely follow price movements.
Accurate Divergence Detection: Identifies both regular and hidden bullish/bearish divergences, enhancing signal reliability.
Dynamic Overbought/Oversold Bands:
Customizable Thresholds: Set dynamic overbought and oversold levels based on market rhythm analysis.
Adaptive Bands: Bands adjust according to the dominant cycle, offering a more accurate representation of market extremes.
Stochastic cRSI & KDJ Oscillator (Optional):
Enhanced Oscillators: Incorporate stochastic and KDJ oscillators for additional momentum analysis.
Ribbon Displays: Visual ribbons provide clarity on oscillator trends and potential reversal points.
Divergence Detection:
Regular & Hidden Divergences: Detects both regular and hidden bullish/bearish divergences to anticipate potential trend reversals.
Customizable Lookback: Adjust pivot lookback periods to fine-tune divergence sensitivity.
Visual Enhancements:
Triangles & Labels: Visual signals in the form of triangles and labels indicate buy/sell opportunities and divergence events.
Bar Coloring: Option to color bars based on signal strength, providing immediate visual cues.
Alert Conditions:
Custom Alerts: Set up alerts for various signal types, including strong buy/sell signals and divergence events, ensuring you never miss critical market movements.
Input Settings
cRSI Settings
Source: Select the data source for calculations (e.g., Close, Open, High, Low, HLC3, OHLC4).
Dominant Cycle Length: Define the dominant market cycle length based on rhythm analysis.
Vibration: Adjusts the sensitivity of the cRSI to price changes.
Leveling %: Determines the percentage level for dynamic band adjustments.
Show cRSI Plot: Toggle the display of the cRSI line.
Show Cyclic Smoothed Bands: Toggle the display of dynamic overbought and oversold bands.
Show Trend Fill: Enable or disable the trend fill cloud between upper and lower bands.
MA Settings
MA Type: Choose the type of Moving Average (SMA, Bollinger Bands, EMA, SMMA (RMA), WMA, VWMA) to smooth the cRSI.
MA Length: Set the length of the Moving Average.
BB StdDev: Define the standard deviation multiplier for Bollinger Bands.
Show cRSI-based MA: Toggle the display of the cRSI-based Moving Average line.
Stochastic Settings
Show Stochastic cRSI: Enable the stochastic oscillator based on cRSI.
Ribbon: Enable ribbon display for the Stochastic oscillator.
Show KDJ: Toggle the display of the KDJ oscillator.
KDJ Ribbon: Enable ribbon display for the KDJ oscillator.
Stochastic Length: Set the length for the Stochastic calculation.
%K Smoothing: Define the smoothing period for %K.
%D Smoothing: Define the smoothing period for %D.
Stoch Scaling %: Adjusts the vertical scaling of the stochastic to prevent distortion.
Overbought/Oversold Settings
Overbought: Set the Overbought threshold for the cRSI.
OB Extreme: Define the Extreme Overbought threshold for the Stochastic cRSI.
Oversold: Set the Oversold threshold for the cRSI.
OS Extreme: Define the Extreme Oversold threshold for the Stochastic cRSI.
Divergence Settings
Pivot Lookback Right: Number of bars to the right of the pivot for divergence detection.
Pivot Lookback Left: Number of bars to the left of the pivot for divergence detection.
Max of Lookback Range: Maximum number of bars to look back for divergence detection.
Min of Lookback Range: Minimum number of bars to look back for divergence detection.
Plot Bullish: Enable plotting of bullish divergence signals.
Plot Hidden Bullish: Enable plotting of hidden bullish divergence signals.
Plot Bearish: Enable plotting of bearish divergence signals.
Plot Hidden Bearish: Enable plotting of hidden bearish divergence signals.
Delay Plot Until Candle is Closed: Prevents repainting by delaying the plotting of divergence signals until the candle is fully closed.

MeanRevert Matrix [StabTrading]MeanRevert Matrix is a sophisticated trading tool designed to detect when prices significantly deviate from their historical averages, signalling potential market trends and reversals.
Leveraging complex algorithms that incorporate human emotions and mean reversion theory, this indicator is the first stage in a comprehensive system for identifying market entry points. Its versatility allows it to be applied across all charts and timeframes, providing traders with clear visual cues for trend analysis and decision-making.
This indicator is purposefully straightforward, allowing traders to observe how the different algorithms work in confluence. The MeanRevert Matrix can be customized to fit individual trading styles, particularly in terms of aggressiveness, making it adaptable to various market conditions. Working in tandem with the FloWave Oscillator, it offers an additional layer of confluence, ensuring that trading signals are more reliable.
💡 Features
Reversal Zones - These zones are integral to the MeanRevert Matrix, highlighting areas where trader emotions and money flow suggest potential longer-term reversals. The lighter shaded zones indicate early-stage reversals, while darker shades signal stronger reversal potential. This feature is designed to help traders anticipate market shifts and prepare for them accordingly.
Localized Mean Reversion Signals - These signals are triggered when the price deviates significantly from the mean, unaffected by longer-term price movements. This localized algorithm helps traders focus on short-term market fluctuations without being influenced by broader trends.
Yellow Signals - These signals identify isolated overbought or oversold conditions. While they often indicate reversal points, they can also signal the beginning of accelerated buying or selling, giving traders early warning of potential market shifts.
Trading Style Customization - The MeanRevert Matrix allows traders to tailor their strategy by adjusting the indicator’s aggressiveness. A more aggressive setting will produce more frequent reversal signals, offering flexibility based on the trader’s risk tolerance and market outlook.
Noise Eliminator - This feature helps traders filter out market noise or manipulation by increasing the noise value. By removing unwanted or misleading signals, it ensures that traders are acting on the most reliable data.
📈 Implementing the System
Step 1 - Begin by observing the localized blue trend to identify reversal points below the mean. Green or red signals within this trend indicate that the price remains within the current market parameters, suggesting that a reversal may occur more quickly. Yellow signals, however, indicate that the trend is likely to continue, so it’s advisable to wait for clearer reversal zones to develop. To avoid misleading signals, consider using higher noise values.
Step 2 - Wait for the reversal zone algorithm to indicate a potential market reversal by showing either light or dark red/green colour. A lighter zone suggests that the overall trend is beginning to reverse, while a darker zone indicates a higher likelihood of reversal.
Step 3 - Once a reversal zone is identified, monitor the trend line for signals that the price is moving significantly away from the mean. This indicates a strong localized price movement that is poised for a reversal. At this stage, you can reduce the noise value and increase the aggressiveness of the trading style to capture more reversal signals.
🛠️ Usage/Practice
In the example above, the indicator is set with neutral aggression for buy signals and lower aggression for sell signals, reflecting the current bull market cycle
Red Reversal Zone - A bearish reversal zone emerges, followed by a darker bearish zone, indicating an increased probability of a trend reversal. The red signals show price reversion from the localized mean, but the absence of yellow signals suggests the reversion isn't abnormally aggressive, making this a good area to consider a short position.
Strong Reversal Opportunity - Similar to point 1, but this time a green signal appears within the bullish dark green zone, highlighting a strong reversal potential. Subsequent red signals suggest opportunities to take profits as the trend faces resistance.
Opportunity to Strengthen Long Position - Once again, the indicator shows a bullish reversal zone without yellow signals. This suggests an area of increased resistance at this price point, offering traders another chance to increase their long positions before the market enters the long bull cycle.
Excessive Buying Pressure - The price has deviated significantly from the mean, triggering a yellow signal. This indicates excessive buying pressure, suggesting the trend is likely to continue upward. Although not an immediate bearish area, the red sell signals suggest it could be a time to conservatively take partial profits.
Trend Weakening - As the trend slows down, bearish zones appear, indicating potential reversal points. As the market shows signs of losing upward momentum, this suggests an opportunity to reduce their long exposure or enter a short trade and take advantage of the correction in the bull cycle.
Potential for Additional Long Position - Despite the earlier sell signals, the overall uptrend remains strong. This presents an opportunity either to add to the long position or to take profits from a previous sell position. The strength of the upward trend suggests that the market may continue higher.
Abnormal Upward Momentum - Similar to points 4 and 5, the yellow signals indicate abnormal price action with aggressive upward momentum. As the trend corrects to a normal range, the price hitting a resistance level is confirmed by the appearance of red reversal zones, suggesting a potential pullback.
Sideways Market Signals - In a sideways market, the indicator shows signals that remain within the normal mean reversion range. These signals are not abnormal and suggest potential entry points for trades within a sideways market, indicating periods where the market lacks strong directional momentum.
🔶 Conclusion
With its seamless integration into various charts and timeframes, the MeanRevert Matrix stands as a reliable and adaptable tool, essential for navigating the complexities of modern markets. By following the implementation guidelines and leveraging its features, traders have the potential to effectively anticipate market movements and optimize their entry and exit points.
We developed this indicator to help traders enhance their understanding of market trends and achieve their trading objectives with greater precision.
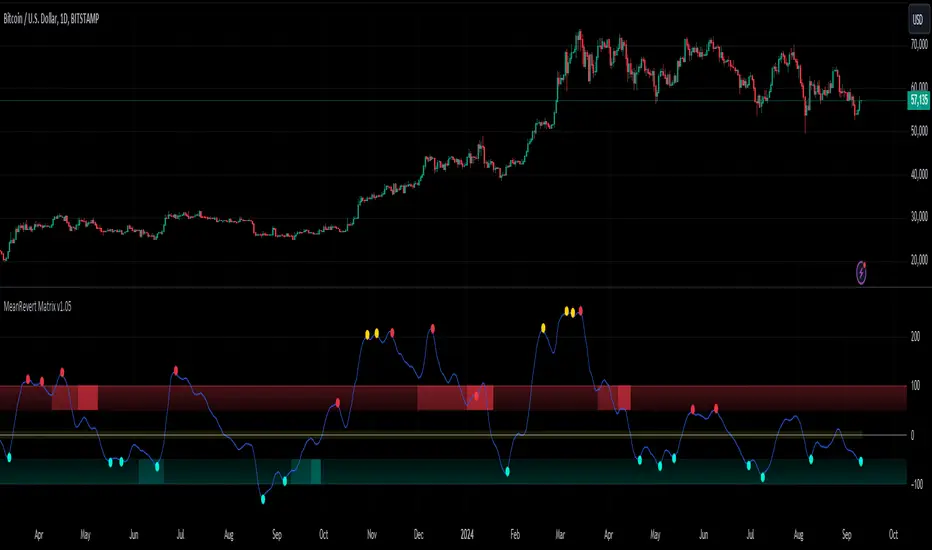
Atlantean Bitcoin Weekly Market Condition - Top/Bottom BTC Overview:
The "Atlantean Bitcoin Weekly Market Condition Detector - Top/Bottom BTC" is a specialized TradingView indicator designed to identify significant turning points in the Bitcoin market on a weekly basis. By analyzing long-term and short-term moving averages across two distinct resolutions, this indicator provides traders with valuable insights into potential market bottoms and tops, as well as the initiation of bull markets.
Key Features:
Market Bottom Detection: The script uses a combination of a simple moving average (SMA) and an exponential moving average (EMA) calculated over long and short periods to identify potential market bottoms. When these conditions are met, the script signals a "Market Bottom" label on the chart, indicating a possible buying opportunity.
Bull Market Start Indicator: When the short-term EMA crosses above the long-term SMA, it signals the beginning of a bull market. This is marked by a "Bull Market Start" label on the chart, helping traders to prepare for potential market upswings.
Market Top Detection: The script identifies potential market tops by analyzing the crossunder of long and short-term moving averages. A "Market Top" label is plotted, suggesting a potential selling point.
Customizable Moving Averages Display: Users can choose to display the moving averages used for detecting market tops and bottoms, providing additional insights into market conditions.
How It Works: The indicator operates by monitoring the interactions between the specified moving averages:
Market Bottom: Detected when the long-term SMA (adjusted by a factor of 0.745) crosses over the short-term EMA.
Bull Market Start: Detected when the short-term EMA crosses above the long-term SMA.
Market Top: Detected when the long-term SMA (adjusted by a factor of 2) crosses under the short-term SMA.
These conditions are highlighted on the chart, allowing traders to visualize significant market events and make informed decisions.
Intended Use: This indicator is best used on weekly Bitcoin charts. It’s designed to provide long-term market insights rather than short-term trading signals. Traders can use this tool to identify strategic entry and exit points during major market cycles. The optional display of moving averages can further enhance understanding of market dynamics.
Originality and Utility: Unlike many other indicators, this script not only highlights traditional market tops and bottoms but also identifies the aggressive start of bull markets, offering a comprehensive view of market conditions. The unique combination of adjusted moving averages makes this script a valuable tool for long-term Bitcoin traders.
Disclaimer: The signals provided by this indicator are based on historical data and mathematical calculations. They do not guarantee future market performance. Traders should use this tool as part of a broader trading strategy and consider other factors before making trading decisions. Not financial advice.
Happy Trading!
By Atlantean

Ehlers Band-Pass FilterHeyo,
This indicator is an original translation from Ehlers' book "Cycle Analytics for Traders Advanced".
First, I describe the indicator as usual and later you can find a very insightful quote of the book.
Key Features
Signal Line: Represents the output of the band-pass filter, highlighting the dominant cycle in the data.
Trigger Line: A leading indicator derived from the signal line, providing early signals for potential market reversals.
Dominant Cycle: Measures the dominant cycle period by counting the number of bars between zero crossings of the band-pass filter output.
Calculation:
The band-pass filter is implemented using a combination of high-pass and low-pass filters.
The filter's parameters, such as period and bandwidth, can be adjusted to tune the filter to specific market cycles.
The signal line is normalized using an Automatic Gain Control (AGC) to provide consistent amplitude regardless of price swings.
The trigger line is derived by applying a high-pass filter to the signal line, creating a leading
waveform.
Usage
The indicator is effective in identifying peaks and valleys in the market data.
It works best in cyclic market conditions and may produce false signals during trending periods.
The dominant cycle measurement helps traders understand the prevailing market cycle length, aiding in better decision-making.
Quoted from the Book
Band-Pass Filters
“A little of the data narrowly passed,” said Tom broadly.
Perhaps the least appreciated and most underutilized filter in technical analysis is the band-pass filter. The band-pass filter simultaneously diminishes the amplitude at low frequencies, qualifying it as a detrender, and diminishes the amplitude at high frequencies, qualifying it as a data smoother.
It passes only those frequency components from input to output in which the trader is interested. The filtering produced by a band-pass filter is superior because the rejection in the stop bands is related to its bandwidth. The degree of rejection of undesired frequency components is called selectivity. The band-stop filter is the dual of the band-pass filter. It rejects a band of frequency components as a notch at the output and passes all other frequency components virtually unattenuated. Since the bandwidth of the deep rejection in the notch is relatively narrow and since the spectrum of market cycles is relatively broad due to systemic noise, the band-stop filter has little application in trading.
Measuring the Cycle Period
The band-pass filter can be used as a relatively simple measurement of the dominant cycle.
A cycle is complete when the waveform crosses zero two times from the last zero crossing. Therefore, each successive zero crossing of the indicator marks a half cycle period. We can establish the dominant cycle period as twice the spacing between successive zero crossings.
When we measure the dominant cycle period this way, it is best to widen the pass band of the band-pass filter to avoid distorting the measurement simply due to the selectivity of the filter. Using an input bandwidth of 0.7 produces an octave-wide pass band. For example, if the center period of the filter is 20 and the relative bandwidth is 0.7, the bandwidth is 14. That means the pass band of the filter extends from 13-bar periods to 27-bar periods.
That is, roughly an octave exists because the longest period is twice the shortest period of the pass band. It is imperative that a high-pass filter is tuned one octave below the half-bandwidth edge of the band-pass filter to ensure a nominal zero mean of the filtered output. Without a zero mean, the zero crossings can have a substantial error.
Since the measurement of the dominant cycle can vary dramatically from zero crossing to zero
crossing, the code limits the change between measurements to be no more than 25 percent.
While measuring the changing dominant cycle period via zero crossings of the band-pass waveform is easy, it is not necessarily the most accurate method.
Best regards,
simwai
Good Luck with your trading! 🙌

Fibonacci Time PeriodsThe " Fibonacci Time Periods " indicator uses power exponents of the constant Phi based on your custom time period to generate Fibonacci sequence-based progression on a given chart. This tool can help to anticipate the timing of potential turning points by highlighting Fib time zones where significant price movements may occur.
It is different from other alternatives specifically for the ability to alter the rate of progression .
Most famous regular Fib sequence expands with 1.618^(n+1) rate which produces vast change just after few iterations.
Those ever-expanding big intervals don't allow us to cover the smaller details of the chart which we might find crucial. So, the idea was born to break down the constant Phi to a self-fraction using power exponents. In other words, reducing rate of progression to make the expansion more gradual without losing properties of Fibonacci proportions.
Default settings have a rate of 0.25 which is basically Phi^1/4
That means we expect 4x more lines than in regular sequence to cover missing bits owing to formula: 1.618^(0.25*(n+1))
(Line 0.618 is added to enhance visual orientation and perception of proportions)
How it works:
Exponential rate of progression
First, it works out the difference between your custom start (0) and end (1) period
The result is multiplied by 1.618^rate to get the step
Rest lines are created by iterations. For instance, with default rate of 0.25, the 1st generated line = start + (End-Start)*1.618^0.25* 1 , second line = start + (End-Start)*1.618^0.25* 2 , etc.
If we change the rate to 1 it will produce the regular fib sequence with 1.618^(n+1) rate
Fixed rate of progression:
In this mode, when rate is 0.25, it grows exactly with exponent step of 0.25 so first, second, third, etc generated lines also have the fixed exponent of 0.25. The distance between lines do not expand.
How to use:
Set the start and end dates
Choose the type of progression
Choose your desired rate of progression
Customize the colors to match your chart preferences.
Observe the generated Fibonacci time intervals and use them to identify potential market movements and reactions.