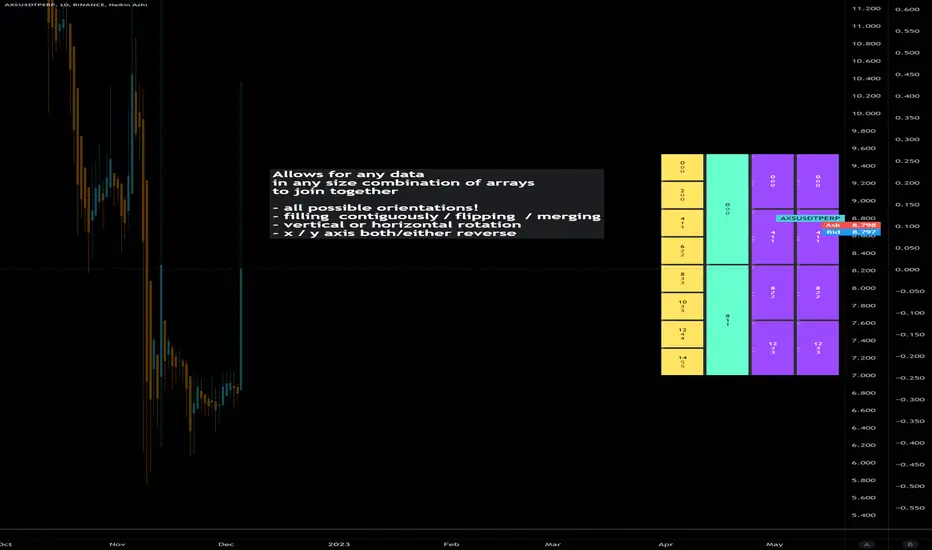
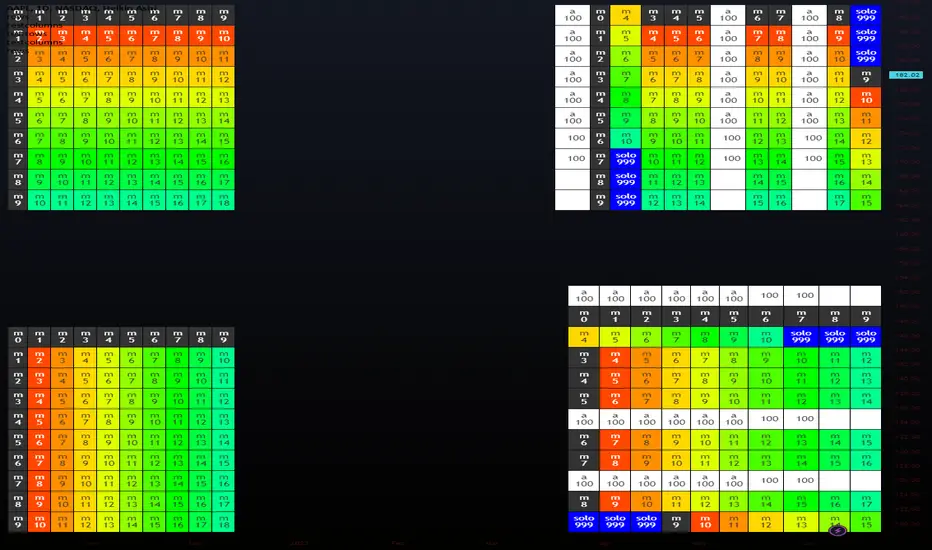
Dynamic Array Table (versatile display methods)Library "datTable"
Dynamic Array Table.... Configurable Shape/Size Table from Arrays
Allows for any data in any size combination of arrays to join together
with:
all possible orientations!
filling all cells contiguously and/or flipping at boundaries
vertical or horizontal rotation
x/y axis direction swapping
all types array inputs for data.
please notify of any bugs. thanks
init(_posit)
Get Table (otional gapping cells)
Parameters:
_posit : String or Int (1-9 3x3 grid L to R)
Returns: Table
coords()
Req'd coords Seperate for VARIP table, non-varip coords
add
Add arrays to display table. coords reset each calc
uses displaytable object, string titles, and color optional array, and second line optional data array.
DATA
columnsLibrary "columns"
Error Tolerant Matrix Setter/Getter Operations. Easy ways to add/remove items into start and end of Columns as well as arrays to grow and shrink matrix.
if mismatched sizes occur the typified NA value will be there to prevent catastrophic crashing.
Rows and Columns are split into 2 libraries due to limitations on number of exports as well as ease of style (columns.shift(), rows.pop() )
pop(_matrix)
do pop last Column off of matrix
Parameters:
_matrix : Matrix To Edit
Returns: Array of Last Column, removing it from matrix
shift(_matrix)
do shift the first Column off of matrix
Parameters:
_matrix : Matrix To Edit
Returns: Array of First Column, removing it from matrix
get(_matrix, _clmnNum)
retrieve specific Column of matrix
Parameters:
_matrix : Matrix To Edit
_clmnNum : Column being Targeted
Returns: Array of selected Column number, leaving in place
push(_matrix, _clmnNum, _item)
add single item onto end of Column
Parameters:
_matrix : Matrix To Edit
_clmnNum : Column being Targeted
_item : Item to Push on Column
Returns: shifted item from Column start
push(_matrix, _array)
add single item onto end of matrix
Parameters:
_matrix : Matrix To Edit
_array : Array to Push on Matrix
Returns: Void
unshift(_matrix, _clmnNum, _item)
slide single item into start of Column remove last
Parameters:
_matrix : Matrix To Edit
_clmnNum : Column being Targeted
_item : Item to Unshift on Column
Returns: popped item from Column end
unshift(_matrix, _array)
add single item into first Column of matrix
Parameters:
_matrix : Matrix To Edit
_array : Array to unshift into Matrix
Returns: Void
set(_matrix, _clmnNum, _array)
replace an array to an existing Column
Parameters:
_matrix : Matrix To Edit
_clmnNum : Column being Targeted
_array : Array to place in Matrix
Returns: Column that was replaced
insert(_matrix, _clmnNum, _array)
insert an array to a new Column
Parameters:
_matrix : Matrix To Edit
_clmnNum : Column being Targeted
_array : Array to place in Matrix
Returns: void
slideDown(_matrix, _array)
add single item onto end of Column
Parameters:
_matrix : Matrix To Edit
_array : Array to push to Matrix
Returns: shifted first Column
slideUp(_matrix, _array)
add single item onto end of Column
Parameters:
_matrix : Matrix To Edit
_array : Array to unshift to Matrix
Returns: poppeed last Column
pullOut(_matrix, _clmnNum)
add single item onto end of Column
Parameters:
_matrix : Matrix To Edit
_clmnNum : Column being Targeted
Returns: removed selected Column

rowsLibrary "rows"
Error Tolerant Matrix Setter/Getter Operations. Easy ways to add/remove items into start and end of rows as well as arrays to grow and shrink matrix.
if mismatched sizes occur the typified NA value will be there to prevent catastrophic crashing.
columns and rows are split into 2 libraries due to limitations on number of exports as well as ease of style (columns.shift(), rows.pop() )
pop(_matrix)
do pop last row off of matrix
Parameters:
_matrix : Matrix To Edit
Returns: Array of Last row, removing it from matrix
shift(_matrix)
do shift the first row off of matrix
Parameters:
_matrix : Matrix To Edit
Returns: Array of First row, removing it from matrix
get(_matrix, _rowNum)
retrieve specific row of matrix
Parameters:
_matrix : Matrix To Edit
_rowNum : Row being Targeted
Returns: Array of selected row number, leaving in place
push(_matrix, _rowNum, _item)
add single item onto end of row
Parameters:
_matrix : Matrix To Edit
_rowNum : Row being Targeted
_item : Item to Push on Row
Returns: shifted item from row start
push(_matrix, _array)
add single item onto end of matrix
Parameters:
_matrix : Matrix To Edit
_array : Array to Push on Matrix
Returns: Void
unshift(_matrix, _rowNum, _item)
slide single item into start of row remove last
Parameters:
_matrix : Matrix To Edit
_rowNum : Row being Targeted
_item : Item to Unshift on Row
Returns: popped item from row end
unshift(_matrix, _array)
add single item into first row of matrix
Parameters:
_matrix : Matrix To Edit
_array : Array to unshift into Matrix
Returns: Void
set(_matrix, _rowNum, _array)
replace an array to an existing row
Parameters:
_matrix : Matrix To Edit
_rowNum : Row being Targeted
_array : Array to place in Matrix
Returns: row that was replaced
insert(_matrix, _rowNum, _array)
insert an array to a new row
Parameters:
_matrix : Matrix To Edit
_rowNum : Row being Targeted
_array : Array to place in Matrix
Returns: void
slideDown(_matrix, _array)
add single item onto end of row
Parameters:
_matrix : Matrix To Edit
_array : Array to push to Matrix
Returns: shifted first row
slideUp(_matrix, _array)
add single item onto end of row
Parameters:
_matrix : Matrix To Edit
_array : Array to unshift to Matrix
Returns: popped last row
pullOut(_matrix, _rowNum)
add single item onto end of row
Parameters:
_matrix : Matrix To Edit
_rowNum : Row being Targeted
Returns: removed selected row
FUNCTION: Limited Historical Data WorkaroundFUNCTION: Limited Historical Data Workaround
If you are working with bitcoin weekly charts, or any other ticker with a low amount of price history this function may help you out. For example you want to apply indicators to some shitcoin that just launched? This can help you.
It can be frustrating to use certain built-ins since they will only give an output once the full lookback length is available. This function allows you to avoid that situation and start plotting things with almost no history whatsoever!
In this example code we do it by utilizing a replacement for the built in pine SMA function. This function allows us to pass a series instead of just a simple int to the length variable of the SMA. This can be achieved with all the pine built ins and I believe @pinecoders has a publication already detailing many of them with full coded examples.
Then we replace the length of the SMA with the custom history function. It checks to see if the current bar index is less than the length of the function. Then if it is, it changes the length to the bar index allowing us to get plots and series earlier than otherwise possible.

TradingCube : Moving Average : Data tablePlots moving average both EMA as well as SMA on Multiple timeframes at once in a Tabular Format
for rapid indication of momentum shift as well as slower-moving confirmations.
Displays EMA/SMA 5 8, 13, 21,34,55,89,100,200,400 by default as well as provide the users the flexibility to choose the timeframe as per their set up.

Bitcoin OnChain & Other MetricsHi all,
In these troubled times, going back to fundamentals can sometimes be a good idea 😊
I put this one up using data retrieved from “Nasdaq Data Link” and their “Blockchain.com” database.
Here is a good place to analyses some Bitcoin data “outside” its price action with 25 different data sets.
Just go to the settings menu and display the ones you are interested in.
If you want me to add more metrics, feel free to DM or comment below!
Hope you enjoy 😉

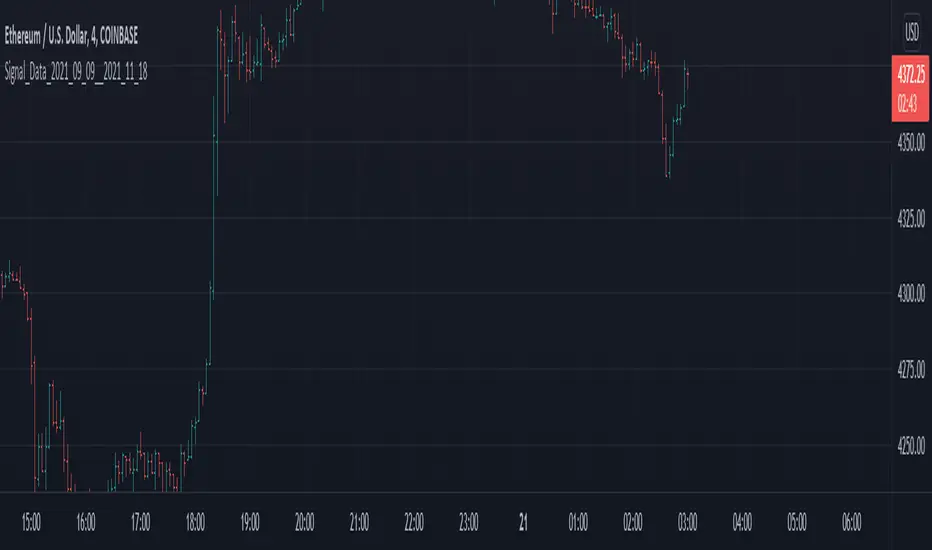
Signal_Data_2021_09_09__2021_11_18Library "Signal_Data_2021_09_09__2021_11_18"
Functions to support my timing signals system
import_start_time(harmonic) get the start time for each harmonic signal
Parameters:
harmonic : is an integer identifying the harmonic
Returns: the starting timestamp of the harmonic data
import_signal(index, harmonic) access point for pre-processed data imported here by copy paste
Parameters:
index : is the current data index, use 0 to initialize
harmonic : is the data set to index, use 0 to initialize
Returns: the data from the indicated harmonic array starting at index, and the starting timestamp of that data
DataCleanerLibrary "DataCleaner"
Functions for acquiring outlier levels and acquiring a cleaned version of a series.
outlierLevel(src, len, level) Gets the (standard deviation) outlier level for a given series.
Parameters:
src : The series to average and add a multiple of the standard deviation to.
len : The The number of bars to measure.
level : The positive or negative multiple of the standard deviation to apply to the average. A positive number will be the upper boundary and a negative number will be the lower boundary.
Returns: The average of the series plus the multiple of the standard deviation.
cleanUsing(src, result, len, maxDeviation) Returns an array representing the result series with (outliers provided by the source) removed.
Parameters:
src : The source series to read from.
result : The result series.
len : The maximum size of the resultant array.
maxDeviation : The positive or negative multiple of the standard deviation to apply to the average. A positive number will be the upper boundary and a negative number will be the lower boundary.
Returns: An array containing the cleaned series.
clean(src, len, maxDeviation) Returns an array representing the source series with outliers removed.
Parameters:
src : The source series to read from.
len : The maximum size of the resultant array.
maxDeviation : The positive or negative multiple of the standard deviation to apply to the average. A positive number will be the upper boundary and a negative number will be the lower boundary.
Returns: An array containing the cleaned series.
outlierLevelAdjusted(src, level, len, maxDeviation) Gets the (standard deviation) outlier level for a given series after a single pass of removing any outliers.
Parameters:
src : The series to average and add a multiple of the standard deviation to.
level : The positive or negative multiple of the standard deviation to apply to the average. A positive number will be the upper boundary and a negative number will be the lower boundary.
len : The The number of bars to measure.
maxDeviation : The optional standard deviation level to use when cleaning the series. The default is the value of the provided level.
Returns: The average of the series plus the multiple of the standard deviation.

Function - Sequence From SeriesFunction to create a array from a sample taken from a series (ex:. close, hlc3...).

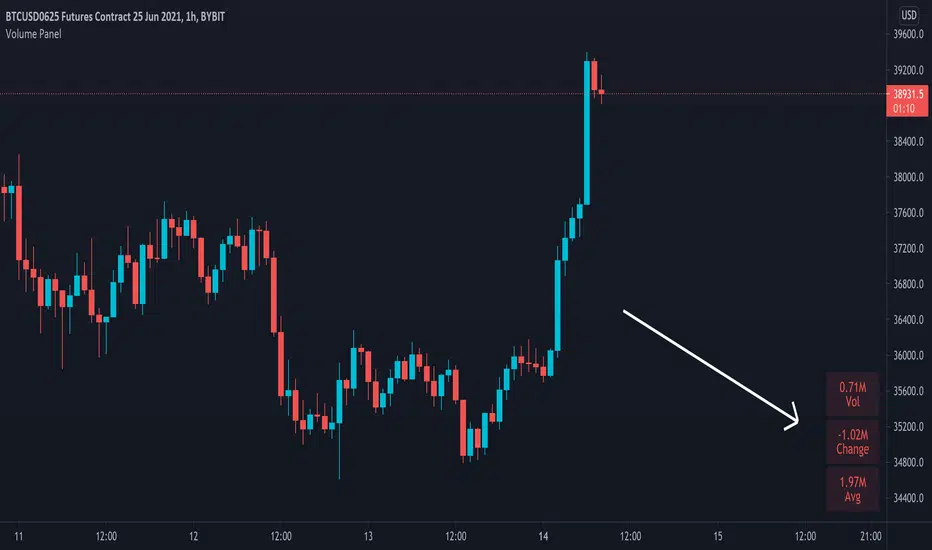
Volume PanelDisplays volume data in panel on bottom right of screen. Shows current bar, change from last bar and average of last 20 bars. This number can be changed in settings if you wish to have the average calculated on a different amount of bars.

Data Gap PointerUpdating the v3 script made by u/Lemrin + some mods
What this does:
Paints a blue "down arrow" pointer at an intraday bar that has occurred with a skip (e.g. a 1min bar that occurs a few minutes after the previous bar)
Checks for whether the market is open, and only paints arrows if inside open hours (because Extended Hours have lots of bar gaps)

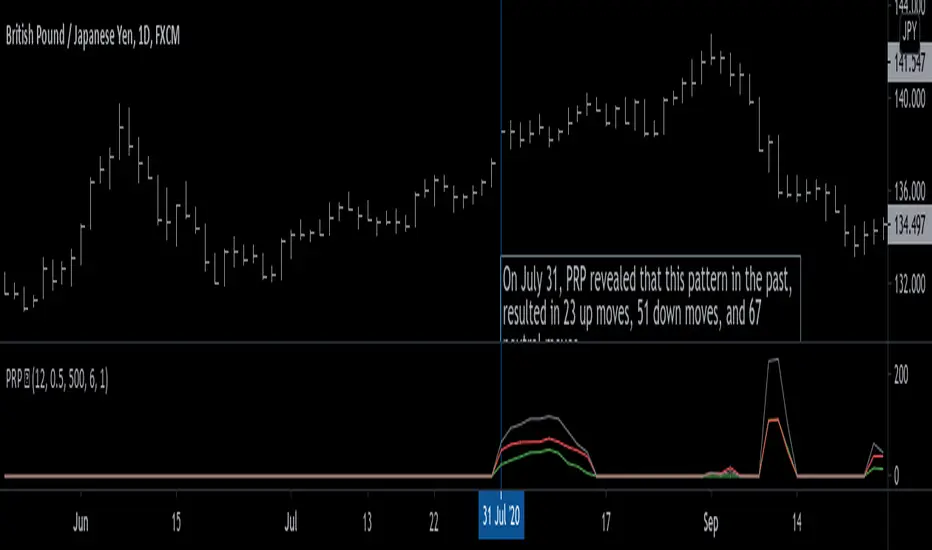
Pattern Recognition Probabilities [racer8]Brief 🌟
Pattern Recognition Probabilities (PRP) is a REALLY smart indicator. It uses the correlation coefficient formula to determine if the current set of bars resembles that of past patterns. It counts the number of times the current pattern has occurred in the past and looks at how it performed historically to determine the probability of an up move, down move, or neutral move.
I'd like to say, I'm proud of this indicator 😆🤙 This is the SMARTEST indicator I have ever made 🧠🧠🧠
Note: PRP doesn't give you actual probabilities, but gives you instead the historical occurrences of up, down, and neutral moves that resulted after the pattern. So you can calculate probabilities based on these valuable statistics. So for example, PRP can tell you this pattern has historically resulted in 55 up moves, 20 down moves, and 60 neutral moves.
Parameters 🌟
You can adjust the Pattern length, Minimum correlation, Statistics lookback, Exit after time, and Atr multiplier parameters.
Pattern length - determines how long the pattern is
Minimum correlation - determines the minimum correlation coefficient needed to pass as a similiar enough pattern.
Statistics lookback - lookback period for gathering all the patterns in the past.
Exit after time - determines when exit occurred (number of periods after pattern) ; is the point that represents the pattern's result.
Atr multiplier - determines minimum atr move needed to qualify whether result was an up/down move or a neutral move. If a particular historical pattern resulted in a move that was less than the min atr, then it is recorded as a neutral move in the statistics.
Thanks for reading! 🙏
Good luck 🍀 Stay safe 😷 Drink lots of water💧
Enjoy! 🥳 and Hit the like button! 👍
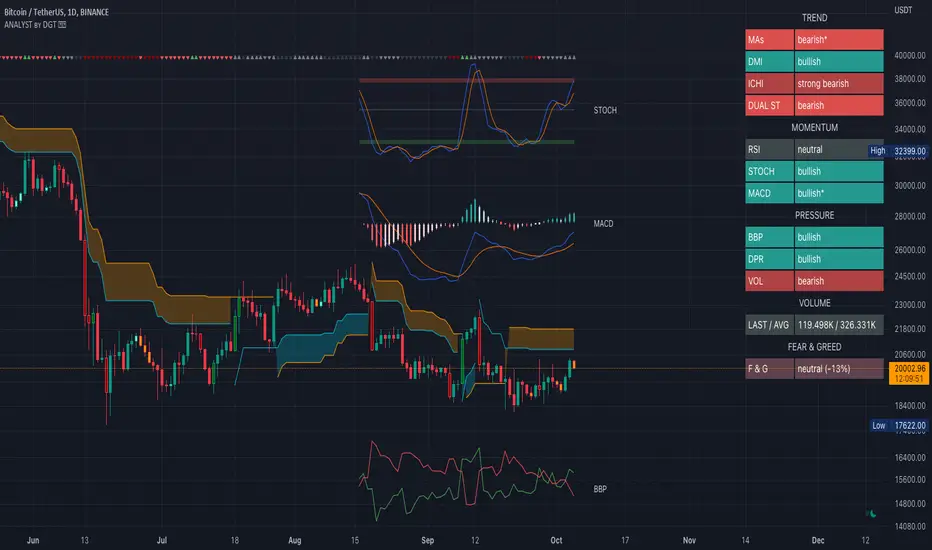
Technical Analyst by DGTWho needs a Technical Analyst?
yes I can hear someone is asking for, and here is one that can help you with technical analysis
The analyst will present a technical anlaysis report at a glance calculated by the most popular technical indicators , and the good part, the anlayst will do it voluntarily
technical skills of the analyst:
- experienced an all markets
- ability to interpret moving averages
- ability to interpret volume changes
- ability to interpret trend folowing indicators such as:
* directional movement index (dmi), identify trend strength and trend direction
* complex ichimoku cloud , identify trend stregth, and tk crosses
- ability to interpret oscillators such as:
* relative strength index, identify oversold overbought levels, identify the rsi flow
* commodity channel index, identify oversold overbought levels
* awesome identify if grawing or falling
* macd if bullish or bearish, and macd histogram if grawing or falling
- ability to calculate probability and its trend
- non-stop hardworker,
- available 7/24,
- highly dedicated always on duty,
- open for new ideas and willing to learn
- upon request the analyst will create reports with custom settings of your choise
the analyst is not a decition maker, trading success is all about following your trading strategy and the analyst aims to help with the presented reports calculated by the most popular technical indicators
the analyst supports 9 of the popular technical indicators and is willing to learn more , please share your comments and feedbacks and help the analyst improve skills
cheers!
Disclaimer : The script is for informational and educational purposes only. Use of the script does not constitutes professional and/or financial advice. You alone the sole responsibility of evaluating the script output and risks associated with the use of the script. In exchange for using the script, you agree not to hold dgtrd TradingView user liable for any possible claim for damages arising from any decision you make based on use of the script
Terminal : Important U.S Indices Change (%) DataHello.
This script is a simple U.S Indices Data Terminal.
You can also set the period to look back manually in the menu.
In this way, an idea can be obtained about Major U.S Indices.
Features
Value changes on a percentage basis (%)
Recently, due to increasing interest, the NQNACE index has been added.
Index descriptions are printed on the information panel.
Sentiment NYSE ARCA and AMEX indices added.
Indices
SP1! : S&P 500 Futures Index
DJI : Dow Jones Industrial Average Index
NDX : Nasdaq 100 Index
RUT : Russell 2000 Index
NYA : NYSE Composite Index
OSX : PHLX Oil Service Sector Index
HGX : PHLX Housing Sector Index
UTY : PHLX Utility Sector Index
SOX : PHLX Semiconductor Sector Index
SPSIBI : S&P Biotechnology Select Industry Index
XNG : NYSE ARCA Natural Gas Index
SPGSCI : S&P Goldman Sachs Commodity Index
XAU : PHLX Gold and Silver Sector Index
SPSIOP : S&P Oil and Gas Exploration and Production Select Industry Index
GDM : NYSE ARCA Gold Miners Index
DRG : NYSE ARCA Pharmaceutical Index
TOB : NYSE ARCA Tobacco Index
DFI : NYSE ARCA Defense Index
NWX : NYSE ARCA Networking Index
XCI : NYSE ARCA Computer Technology
XOI : AMEX Oil Index
XAL : AMEX Airline Index
NQNACE : Nasdaq Yewno North America Cannabis Economy Index

Terminal : USD Based Stock Markets Change (%)Hello.
This script is a simple USD Based Stock Markets Change (%) Data Terminal.
You can also set the period to look back manually in the menu.
In this way, an idea can be obtained about Countries' Stock Markets.
And you can observe the stock exchanges of relatively positive and negative countries from others.
Features
Value changes on a percentage basis (%)
Stock exchange values are calculated in dollar terms.
Due to the advantage of movement, future data were chosen instead of spot values on the required instruments.
Stock Markets
Usa : S&P 500 Futures
Japan: Nikkei 225 Futures
England: United Kingdom ( FTSE ) 100
Australia: Australia 200
Canada: S&P / TSX Composite
Switzerland: Swiss Market Index
New Zealand: NZX 50 Index
China: SSE Composite (000001)
Denmark: OMX Copenhagen 25 Index
Hong-Kong: Hang Seng Index Futures
India: Nifty 50
Norway: Oslo Bors All Share Index
Russia: MOEX Russia Index
Sweden: OMX Stockholm Index
Singapore: Singapore 30
Turkey: BIST 100
South Africa: South Africa Top 40 Index
Spain: IBEX 35
France: CAC 40
Italy: FTSE MIB Index
Netherlands: Netherlands 25
Germany : DAX
Regards.

General Data TerminalHello.
This script is a simple General Data Terminal.
You can also set the period to look back manually in the menu.
In this way, an idea can be obtained about Global Markets.
Note : TIO = Iron Ore
Regards.

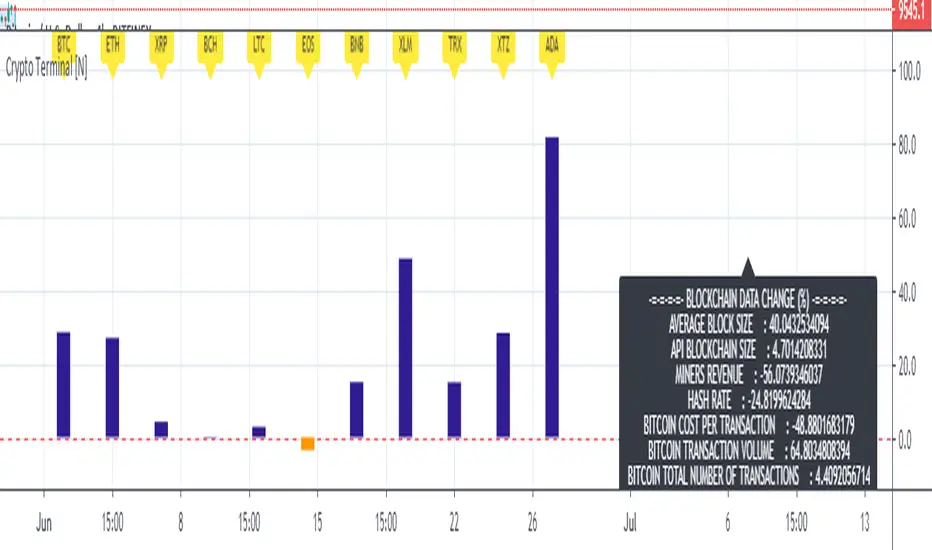
Basic Cryptocurrency TerminalHello,
This script is a simple Cryptocurrency Terminal.
It serves the same purpose as Heatmaps.
You can also set the period to look back manually in the menu.
Major Cryptocurrencies are taken into account.
And various Blockchain data are shown in the information panel.
In this way, an idea can be obtained about Cryptocurrency Market.
It is visually more convenient and clear to use in an indicator window under the chart, not on the chart, as follows:
Regards.
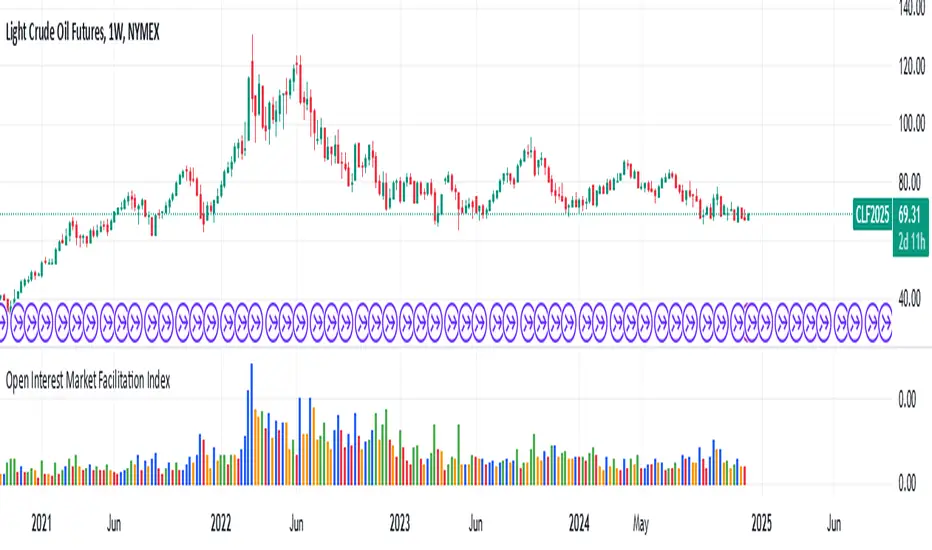
Open Interest Market Facilitation IndexOriginal script from ChartChampions :
Let's start.
This script was created by using Open Interest instead of Volume in the Market Facilitation Index.
Thus, it can make a difference in the Future and CFD Markets.
If your financial instrument is not from these markets, that is, if Open Interest is not used, you can choose Volume.
You can set "FUTURES" and "OTHERS" from the menu.
If you use the Open Interest (FUTURES) option in the menu on 1W bars and defined Future markets, it will not repaint.
This is the best use for Open Interests, as data is extracted from Quandl and CFTC COT reports are published once a week.
Color Change Rules :
In my version :
Green Bars = Green
Fade Bars = Orange
Fake Bars = Blue
Squat Bars = Red
To show the difference in the presentation, both the Futures option using Open Interest and the Others option using Volume were published to compare.
You can observe the difference.
Best regards.
Open Interest Money Flow Index (OIMFI)CAUTION : This system was inspired from seiglerj' s "Money Flow Index " script. Open Interests are used instead of volume.
What is the Money Flow Index ( MFI )?
The Money Flow Index ( MFI ) is a technical oscillator that uses price and volume for identifying overbought or oversold conditions in an asset. It can also be used to spot divergences which warn of a trend change in price. The oscillator moves between 0 and 100.
Unlike conventional oscillators such as the Relative Strength Index ( RSI ), the Money Flow Index incorporates both price and volume data, as opposed to just price. For this reason, some analysts call MFI the volume-weighted RSI .
What Does the Money Flow Index ( MFI ) Tell You?
One of the primary ways to use the Money Flow Index is when there is a divergence. A divergence is when the oscillator is moving in the opposite direction of price. This is a signal of a potential reversal in the prevailing price trend.
For example, a very high Money Flow Index that begins to fall below a reading of 80 while the underlying security continues to climb is a price reversal signal to the downside. Conversely, a very low MFI reading that climbs above a reading of 20 while the underlying security continues to sell off is a price reversal signal to the upside.
Traders also watch for larger divergences using multiple waves in the price and MFI . For example, a stock peaks at $10, pulls back to $8, and then rallies to $12. The price has made two successive highs, at $10 and $12. If MFI makes a lower higher when the price reaches $12, the indicator is not confirming the new high. This could foreshadow a decline in price.
The overbought and oversold levels are also used to signal possible trading opportunities. Moves below 10 and above 90 are rare. Traders watch for the MFI to move back above 10 to signal a long trade, and to drop below 90 to signal a short trade.
Other moves out of overbought or oversold territory can also be useful. For example, when an asset is in an uptrend, a drop below 20 (or even 30) and then a rally back above it could indicate a pullback is over and the price uptrend is resuming. The same goes for a downtrend. A short-term rally could push the MFI up to 70 or 80, but when it drops back below that could be the time to enter a short trade in preparation for another drop .
Reference : www.investopedia.com
WARNING :
** Since each instrument in the list has its own unique contract data, you must first enter its name to display it. I recommend you to select OANDA from the markets. Finally, when the COT reports are issued, it may repaints. However, this repaint is usually close to closing or after close .(When COT reports are so sharp ) So use this script only 1W ( 1 week ) or 1 M ( 1 month ) timeframe.
** This data is taken to Tradingview with the help of Quandl. This is a very low possibility, but the system will not work if there is a malfunction.
FEATURES :
*** Working with all futures (Including : Bitcoin )
*** If you dont work with "Futures" , you can select "Others" from switchable menu and use volume for all instruments.
*** New generation elegant design used : Adaptive coloring Overbought - Oversold Levels according to the closing price.
NOTE : This code is open source under the MIT License. If you have any improvements or corrections to suggest, please send me a pull request via the github repository github.com
Stay tuned. Best wishes !

Error in dataIt gaves you a clear look into how many errors the data has for a current market.
Basically it checks if close =open and by how much margin that is correct

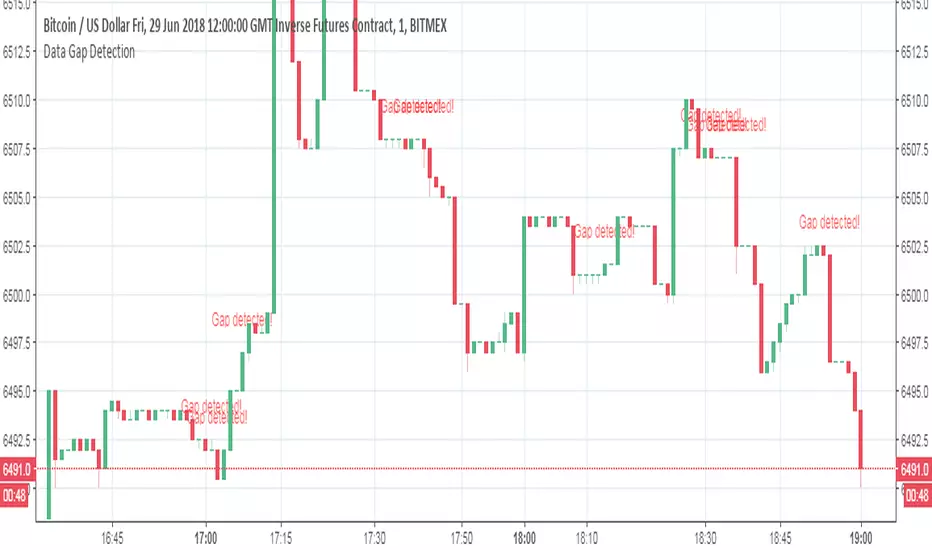
Data Gap DetectionThis simple script checks for data gaps in an intra-day TradingView chart. I have found that BitMEX 1-minute data is coming in rather holey lately, so I wrote this just to see how prevalent the problem is. It should work on any intra-day timeframe, not just 1-minute.
V1: initial release.
Function Locked Enumeratorreturns the value at index, can be used if you want to compare/select multiple values from different series and need to simulate a array/enumerator.
