Historical SimilaritiesHappy trading! This tool provides short-term trend estimations. It is a further evolution of my earlier ANN Trend Prediction indicator, but it uses a completely new feature-vector composition and a different type of neural network.
1. Concept
The underlying idea is that history tends to repeat—not exactly, but with recognizable similarities. When recent market conditions resemble past situations, it is reasonable to assume that price may behave similarly again. That is the foundation of this indicator.
In the image below, you can see the general setup. The most recent bar (the “now” point) separates the past from the future. A sequence of recent bars is interpreted as a pattern and fed into a pre-trained LSTM network, which then produces the prediction for the current bar.
The focus of this tool is to deliver predictions as early as possible—ideally just before a trend reversal—to support short-term trades lasting approximately 5 to 20 bars. While perfect early detection is not reached here, this indicator often identifies reversals within one bar after they occur, which is usually early enough to capture meaningful moves.
There are other indicators capable of signaling trend reversals within a single bar—such as Shooting Star or Hammer candle patterns, or certain indicator setups. They were effective when they were new, but widespread use has reduced their reliability, and sometimes those patterns simply do not appear or appear without trend reversal.
This tool, by contrast, is new and it successfully identifies many trend reversals, as demonstrated in the image below:
2. Experimental Part
Furthermore, because this approach offers multiple settings that influence its behavior, you can configure it to focus on larger trends and ignore smaller fluctuations. The following images show several examples:
The default settings
with only-Body Smoothing enabled
with Generalized Trends enabled
with both Smoothing enabled
However, as you may notice, when targeting larger trends, a number of false-negative predictions may also appear. These still need to be filtered out. Please keep in mind that this version is experimental, requiring further investigation and research, and I would appreciate any feedback or suggestions.
3. Results
The prediction output is shown through a label and background colors as shown in the following image. It provides probabilities for three market directions:
Up - green
Sideways - blue
Down - red
When the model cannot confidently classify the current market conditions, it deliberately withholds a prediction and leaves the background uncolored. In most cases, however, it displays a label with all three probabilities whenever a new dominant prediction emerges, and it remains visible until the next dominant signal appears.
4. Conclusion
In its default settings, this indicator is quite capable when short-term trends last at least five or more bars. A support-and-resistance indicator can be helpful for setting take-profit and stop-loss levels.
5. Settings Menu
The script is delivered with its default settings, all turned off. However, several configuration options are available:
Input Preparation
Smoothing – Using Heikin Ashi or using only Bar Body are two methods that help remove outliers from the incoming bars.
Generalize Trends – Merges nearby trends together and removes smaller, insignificant trends.
Generalize Patterns – Checks the incoming pattern for artifacts and reduces it when possible. This is a trade-off between removing noise and keeping meaningful features.
Shifting – Examines the incoming pattern for consistency and adjusts it when reasonable.
Speed – Determines how quickly a prediction is calculated. A longer calculation time can improve accuracy, but may also risk the script timing out.
Filters
Intrabar – Off by default, allowing new dominant predictions only at bar close. When enabled, predictions may also be updated intrabar, but this introduces repainting on the current open bar.
Start of Classification – Sets the date from which classifications may begin.
Minimum Gains After Pattern – Defines how much price must rise or fall for a pattern to be considered an up, down, or sideways pattern.
Minimum Classification Probability – If the highest probability is below this threshold, no prediction is selected and the background stays translucent. If one probability exceeds the threshold, the largest one is chosen as the prediction.
Minimum Pattern Strength – Removes patterns whose strength is below this threshold.
6. Alert Signals Available
Trend Signal
2 = possible High
1 = Uptrend
0 = Ranging
-1 = Downtrend
-2 = possible Low
na = no prediction
Signal Age - counts the number of bars since last change
7. Declaration for TradingView House Rules on Script Publishing
The unique feature of the Historical Similarities Indicator is it's nearby real-time detection capability for up trends, down trends and side way price action in most cases.
This script is closed-source and invite-only, to support and compensate for years of development work.
8. Disclaimer
Trading involves risk, and losses can and do occur. This script is intended for informational and educational purposes only. All examples are hypothetical and not financial advice.
Decisions to buy, sell, hold, or trade securities, commodities, or other assets should be based on the advice of qualified financial professionals. Past performance does not guarantee future results.
Use this script at your own risk. It may contain bugs, and I cannot be held responsible for any financial losses resulting from its use.
Cheers!
Deep_learning

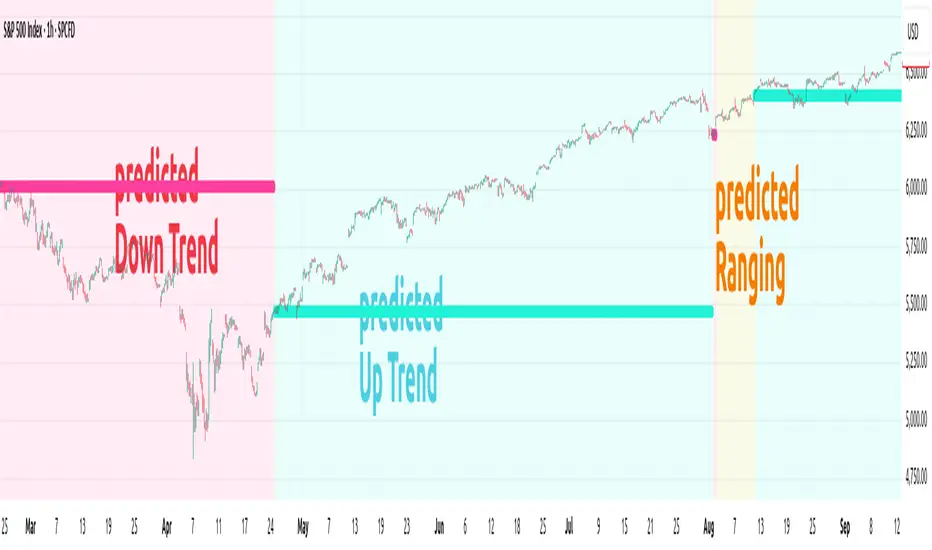
ANN TREND SPX500 1m-1HHappy Trading! This indicator is the successor to my previous ANN Trend Prediction, now featuring improved feature vectors, refined backpropagation, and a stronger focus on asset- and timeframe-specific patterns for more precise predictions.
Internally is a collection of nine artificial neural networks (ANNs) trained on the S&P 500 to forecast uptrends, downtrends, or ranging markets. Each ANN is trained on one of the following timeframes: 1m, 2m, 3m, 5m, 10m, 15m, 30m, 45m, and 60m, and the appropriate model is selected automatically.
1. Settings
In the settings menu shown in the image below, you’ll find six options:
Indicator Timeframe – Choose between 1m and 1H.
Intrabar – Choose between Alerts been send intrabar or only at bar closing.
Lookback – Define how many previous bars the ANN should use in its calculations.
Smoothing – To reduce short-term switching of the prediction you can activate Smoothing. Here-by the input datas get filtered by a mean function.
Range Filter – Enable a third class, Ranging, in addition to Uptrend and Downtrend. This enables you to avoid choppy markets.
Class Colors – Here you can change each Class (Up, Down Trend etc) color.
2. Comparison with EMA crossover
The Prediction of the ANN Trend SPX500 1m-1H is more reliable as the prediction of the EMA crossover, shown in the Image below.
Both indicators use the same period of 65 bars and source their input data from the same chart.
While the EMA crosses over multiple times (shown as red vertical lines in the image), the ANN Trend maintains its prediction signal as Uptrend.
This advantage of the ANN comes from its learned knowledge. During training, it was exposed to a vast number of price charts, enabling it to distinguish between a trend setback and a true trend reversal.
3. Alerts
The indicator generates two types of alert signals:
Trade Signal:
1 = Uptrend
0 = Ranging
-1 = Downtrend
-2 = no prediction
Signal Age: Counts the number of bars since the last signal change. With the Signal Age you have access to the entry-price of the actual Trend. If you use You just call close to get the last entry-price.
4. Declaration for TradingView House Rules on Script Publishing
The unique feature of ANN Trend SPX500 1m-1H is it's real-time range detection capability and it's capability to distinguishes between a Trend set back and a Trend reversal which results in longer lasting trend predictions in comparison to any Moving Average Crossover Indicators.
This script is closed-source and invite-only, to support and compensate for months of development work.
5. Disclaimer
Trading involves risk, and losses can and do occur. This script is intended for informational and educational purposes only. All examples are hypothetical and not financial advice.
Decisions to buy, sell, hold, or trade securities, commodities, or other assets should be based on the advice of qualified financial professionals. Past performance does not guarantee future results.
Use this script at your own risk. It may contain bugs, and I cannot be held responsible for any financial losses resulting from its use.
Cheers!
ANN MACD : 25 IN 1 SCRIPTIn this script, I tried to fit deep learning series to 1 command system up to the maximum point.
After selecting the ticker, select the instrument from the menu and the system will automatically turn on the appropriate ann system.
Listed instruments with alternative tickers and error rates:
WTI : West Texas Intermediate (WTICOUSD , USOIL , CL1! ) Average error : 0.007593
BRENT : Brent Crude Oil (BCOUSD , UKOIL , BB1! ) Average error : 0.006591
GOLD : XAUUSD , GOLD , GC1! Average error : 0.012767
SP500 : S&P 500 Index (SPX500USD , SP1!) Average error : 0.011650
EURUSD : Eurodollar (EURUSD , 6E1! , FCEU1!) Average error : 0.005500
ETHUSD : Ethereum (ETHUSD , ETHUSDT ) Average error : 0.009378
BTCUSD : Bitcoin (BTCUSD , BTCUSDT , XBTUSD , BTC1!) Average error : 0.01050
GBPUSD : British Pound (GBPUSD,6B1! , GBP1!) Average error : 0.009999
USDJPY : US Dollar / Japanese Yen (USDJPY , FCUY1!) Average error : 0.009198
USDCHF : US Dollar / Swiss Franc (USDCHF , FCUF1! ) Average error : 0.009999
USDCAD : Us Dollar / Canadian Dollar (USDCAD) Average error : 0.012162
SOYBNUSD : Soybean (SOYBNUSD , ZS1!) Average error : 0.010000
CORNUSD : Corn (ZC1! ) Average error : 0.007574
NATGASUSD : Natural Gas (NATGASUSD , NG1!) Average error : 0.010000
SUGARUSD : Sugar (SUGARUSD , SB1! ) Average error : 0.011081
WHEATUSD : Wheat (WHEATUSD , ZW1!) Average error : 0.009980
XPTUSD : Platinum (XPTUSD , PL1! ) Average error : 0.009964
XU030 : Borsa Istanbul 30 Futures ( XU030 , XU030D1! ) Average error : 0.010727
VIX : S & P 500 Volatility Index (VX1! , VIX ) Average error : 0.009999
YM : E - Mini Dow Futures (YM1! ) Average error : 0.010819
ES : S&P 500 E-Mini Futures (ES1! ) Average error : 0.010709
GAZP : Gazprom Futures (GAZP , GZ1! ) Average error : 0.008442
SSE : Shangai Stock Exchange Composite (Index ) ( 000001 ) Average error : 0.011287
XRPUSD : Ripple (XRPUSD , XRPUSDT ) Average error : 0.009803
Note 1 : Australian Dollar (AUDUSD , AUD1! , FCAU1! ) : Instrument has been removed because it has an average error rate of over 0.13.
The average error rate is 0.1850.
I didn't delete it from the menu just because there was so much request,
You can use.
Note 2 : Friends have too many requests, it took me a week in total and 1 other script that I'll share in 2 days.
Reaching these error rates is a very difficult task, and when I keep at a low learning rate, they are trained for a very long time.
If I don't see the error rate at an average low, I increase the layers and go back into a longer process.
It takes me 45 minutes per instrument to command artificial neural networks, so I'll release one more open source, and then we'll be laying 70-80 percent of the world trade volume with artificial neural networks.
Note 3 :
I would like to thank wroclai for helping me with this script.
This script is subject to MIT License on behalf of both of us.
You can review my original idea scripts from my Github page.
You can use it free but if you are going to modify it, just quote this script .
I hope it will help everyone, after 1-2 days I will share another ann script that I think is of the same importance as this, stay tuned.
Regards , Noldo .

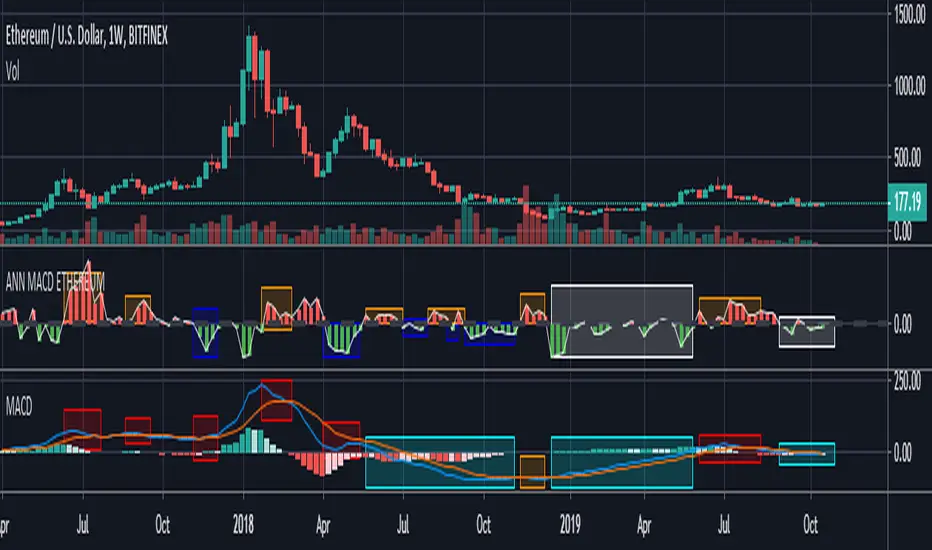
ANN MACD ETHEREUM
This script is trained with Ethereum (Timeframe : 4 hours ).
Details :
Input columns: 19
Output columns: 1
Excluded columns: 0
Training example rows: 300
Validating example rows: 0
Querying example rows: 0
Excluded example rows: 0
Duplicated example rows: 0
Input nodes connected: 19
Hidden layer 1 nodes: 8
Hidden layer 2 nodes: 1
Hidden layer 3 nodes: 0
Output nodes: 1
Learning rate: 0.7000
Momentum: 0.8000
Training error: 0.009378 ( That's a very good error coefficient. )
Many thanks to wroclai for help.
Deep learning series will continue!
ANN MACD BTC v2.0 This script is the 2nd version of the BTC Deep Learning (ANN) system.
Created with the following indicators and tools:
RSI
MACD
MOM
Bollinger Bands
Guppy Exponential Moving Averages:
(3,5,8,10,12,15,30,35,40,45,50,60)
Note: I was inspired by the CM Guppy Ema script.
Thank you very much to dear wroclai for his great help.
He has been a big help in the deep learning series.
That's why the licenses in this series are for both of us.
I'm sharing these series and thats the first. Stay tuned and regards!
Note : Alerts added.

SPY FRACTAL S-R LEVELS (FIXED ANN MACD)
This is a fractal version of my deep learning script for SPY
In addition, buy and sell conditions may appear in bar colors in green and red.
You can choose from the menu if you wish.
Fractal codes do not belong to me.
So I didn't put any license.
You can use it as you want, you can change and modify.
Regards.Noldo

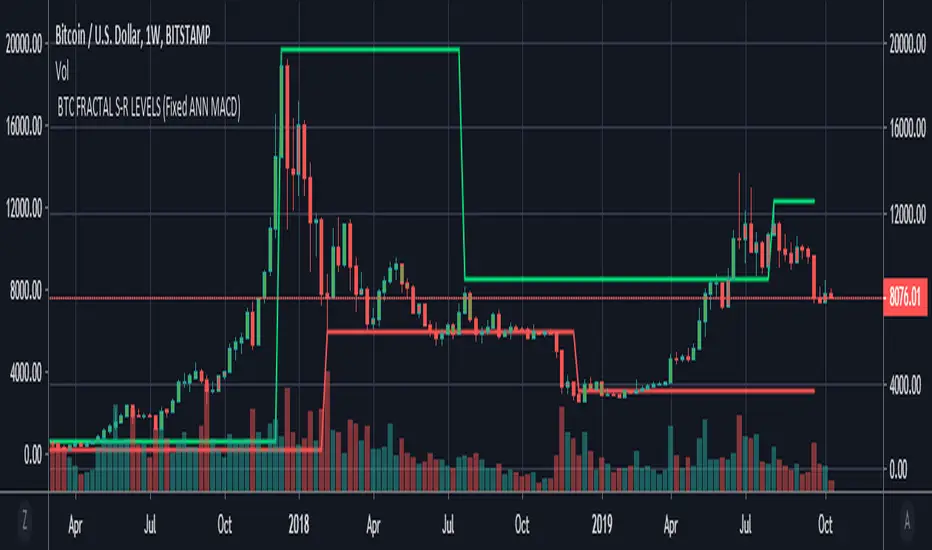
BTC FRACTAL ANN S-R LEVELS (Fixed ANN MACD)
This script is an adaptation of my deep learning system for Bitcoin to fractals.
Fractal codes are not belong to me. Original :
The code for the Deep learning (ANN MACD BTC) work belongs to me. Original:
I didn't get license for this script because the fractal codes don't belong to me.You can use it for any purpose.
This command can be a very helpful guide.You can use that fractals with your indicators for Bitcoin.
You can also combine these levels with ANN - MACD - BTC script.
Scripts about Artificial Neural Networks (ANN) will continue soon !
I hope it will help us to gain insight into technical analysis.
Best regards. Noldo.