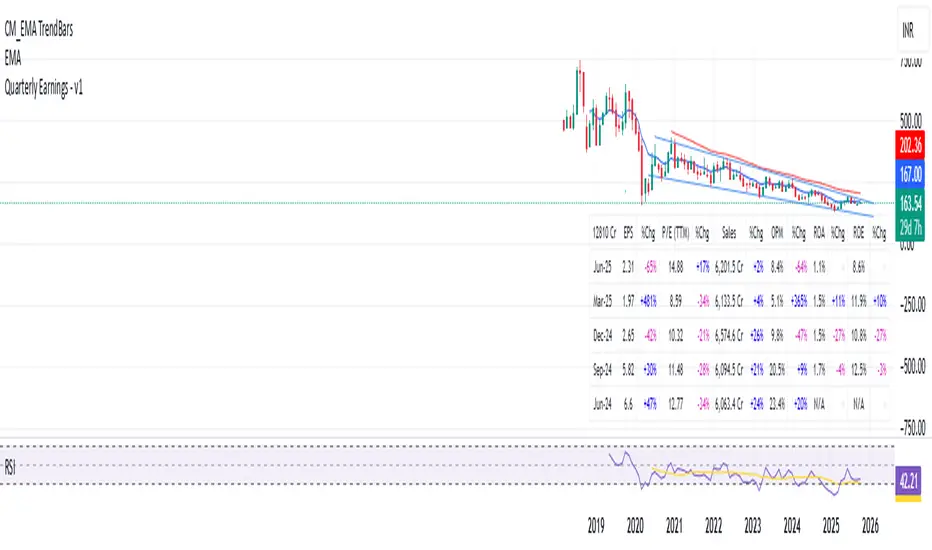
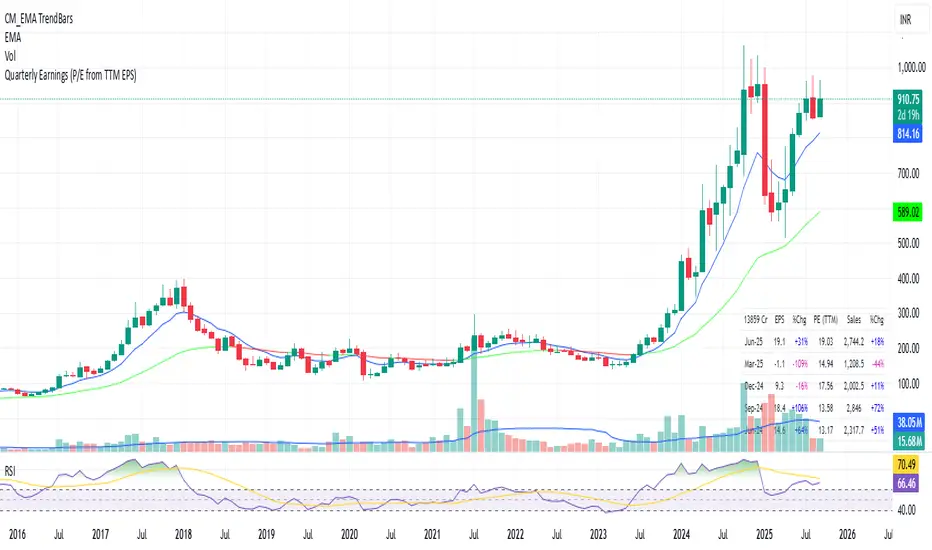
P/E Ratio (TTM)This indicator plots the trailing P/E ratio (TTM) using GAAP EPS (TTM) sourced directly from TradingView’s fundamental data. It includes valuation‑zone color coding, yearly labels, and a clean, compressed visual layout suitable for most equities.
The goal is to provide a fast, intuitive view of how expensive or cheap a stock is relative to its historical earnings power.
Note:
The indicator caps P/E values around 120 for visual clarity.
Negative P/E ratios are intentionally excluded, since P/E is undefined when EPS is negative.
You can adjust the cap or remove it entirely if you prefer a full‑range view.
This tool is especially useful for identifying periods when a company is trading at historically elevated or discounted valuation levels.
Pine Script® インジケーター