BIGG CHIEFF RWB MASTER v2.0 (Indicator) [v1.0]Here is a **clean, professional TradingView indicator description** you can paste directly into the script description. It explains the *logic and philosophy* without exposing proprietary specifics, while still sounding robust and credible.
---
## 📊 Indicator Overview
This indicator is a **rule-based EMA crossover strategy built on price action, opening range structure, directional bias, and momentum confirmation**.
It is designed for intraday trading during the New York session and adapts to both time-based and tick-based charts.
The system focuses on **clarity, patience, and consistency**, filtering out low-quality conditions while aligning trades with higher-probability market structure.
---
## 🧭 Core Concepts
### Opening Range Structure
* The strategy uses the **first 15 minutes of the New York session** to define an Opening Range.
* This range establishes **key intraday structure**, including:
* High
* Low
* Midpoint
* The Opening Range remains visible for the entire session and resets each day.
* Trades are framed around **breaks, retests, and rejections** of this structure.
---
## 📈 Trend, Bias & Momentum
### Directional Bias
Bias is determined by:
* **EMA stacking order**
* **Price location relative to the Opening Range**
* Optional **higher-timeframe trend alignment**
Once bias is confirmed:
* Trades are only taken **in the direction of that bias**
* Opposing trades are locked out until structure meaningfully changes
This prevents overtrading and reduces whipsaws in choppy conditions.
---
### Higher-Timeframe Alignment (Optional)
A higher-timeframe trend filter can be enabled to:
* Keep trades aligned with the broader market direction
* Improve win rate during trending sessions
* Reduce countertrend entries
---
## ⚡ Volatility & Time Filters
To avoid low-quality trades, the system includes:
* **Volatility filtering** to prevent entries during compressed or dead markets
* **Session time windows** to focus on the most liquid trading hours
* Optional **no-trade time blocks** for news or known high-risk periods
---
## 💧 Liquidity Awareness
The indicator accounts for **key liquidity zones**, such as:
* Prior session highs and lows
* Overnight and premarket extremes
Trades are filtered to ensure there is **sufficient room for reward** before running into nearby liquidity, helping avoid premature exits.
---
## ✅ Entry Logic (Primary Mode)
Trades are based on **structure first, confirmation second**:
* Breakouts must be confirmed by **candle closes**, not wicks
* Entries occur on **retracements and rejection candles**, not chase candles
* Priority is given to cleaner retests closer to structure
* Optional controls allow limiting trades to **first-touch setups only**
This encourages patience and avoids emotional entries.
---
## 🛑 Risk Management & Trade Management
The system is built around **R-multiple consistency**, not fixed targets.
* Stops are volatility-based
* Multiple profit targets can be enabled
* Optional partial profits and trailing stop logic are included
* Trailing behavior can follow momentum or structure once price moves favorably
Everything is designed to **protect capital first and scale winners second**.
---
## 🧠 Philosophy
This indicator is not designed to predict the market.
It is designed to **react intelligently** to what price is already confirming.
It prioritizes:
* Structure over indicators
* Bias over impulse
* Confirmation over hope
* Risk management over win rate
Best results come from disciplined execution, patience, and respecting the filters.
Educational

FVG + Inversion + MidlineThis is a rough version. Still in works.
Off Mode - Shows bullish and bearish FVGS
Only Mode - Only shows inverted FVGs in white (those above price are usually resistance zones and below tend to be support with the more recent and higher timeframe ones being most relevant)
Blended - Shows Both
You can adjust the amount of zones to be shown to modify the lookback period.
You can also adjust the price range by a standard deviation of 100% to only cover a specific price range.
Rest of the features are still being cleaned or irrelevant for the most part.

Star V12⭐ Star Engine — Multi-Component, Multi-Timeframe Trade Execution System
The Star Engine is a stateful trade execution and analytics system designed to transform indicator confluence into structured, measurable trade runs. Rather than producing isolated buy/sell signals, the engine decomposes market behavior into pressure, confirmation, event grouping, and trade lifecycle management. Each component plays a specific role, and no single component is sufficient on its own. Below is a detailed breakdown of each subsystem and why it exists.
💣 Bomb Engine — Directional Pressure Measurement
The Bomb Engine is responsible for identifying directional pressure in the market. It evaluates whether price action exhibits sustained momentum in one direction, independent of whether that direction is immediately tradable.
What Bomb Uses
Bomb aggregates momentum- and trend-oriented inputs such as MACD-based momentum direction, momentum persistence and continuation logic, directional bias filters, and impulse strength evaluation. All inputs are evaluated across multiple timeframes, with each timeframe contributing independently.
How Bomb Works
Each timeframe produces a directional contribution (bullish, bearish, or neutral). Contributions are aggregated into a net Bomb total. The total is mapped into discrete tone buckets (blue, green, red, black, etc.). Higher totals indicate stronger directional dominance.
What Bomb Tells You
Bomb answers one question: Is there directional pressure building or persisting? It does not determine entry timing, exhaustion, or trade quality. Bomb is context, not execution. This allows Bomb to be early without being responsible for precision.
✨ Golden Engine — Structural Confirmation & Regime Filtering
The Golden Engine evaluates whether the directional pressure detected by Bomb is structurally supported. Golden exists to prevent entries during momentum exhaustion, conflicting timeframe regimes, and counter-structure moves.
What Golden Uses
Golden relies on a different indicator stack than Bomb, focused on confirmation and balance, including RSI regime classification (not simple overbought/oversold), momentum agreement vs divergence, trend-following vs counter-trend positioning, overextension detection, and compression and rotational behavior. Each timeframe is evaluated independently using the same logic.
The Role of RSI in Golden
RSI in Golden is used to identify regimes, not signals. It answers questions such as: Is momentum expanding or decaying? Is the move early, mid-structure, or extended? Do multiple timeframes share compatible RSI states? If RSI regimes conflict across timeframes, Golden will not confirm. This is one of the main mechanisms that makes Golden selective.
Momentum & Alignment Logic
Golden evaluates whether momentum supports continuation, is fragmenting, is diverging from price, or is contradicting higher-timeframe structure. If lower-timeframe impulses are not supported by higher-timeframe structure, Golden suppresses confirmation — even if Bomb remains strong.
What Golden Guarantees
Golden does not guarantee profitable trades. Golden guarantees that the detected directional pressure is not internally contradictory across RSI regimes, momentum behavior, and timeframe structure. This replaces vague terms like “clean” with explicit structural conditions.
🔗 Multi-Timeframe Aggregation (MTF)
Both Bomb and Golden operate on a multi-timeframe voting system. Lower timeframes capture early impulses, higher timeframes enforce structural context, each timeframe votes independently, conflicts weaken totals, and alignment strengthens totals. This creates temporal confluence, not just price-based confluence.
⭐ Star Events — Qualified Market Impulses
A Star (⭐) is created only when Bomb is active, Golden is active, both agree on direction, and all gating rules pass (thresholds, time filters, modes). A Star represents a qualified impulse, not a trade. Stars are atomic events used by the execution layer.
⏱ Star Clusters — Trade Run State
The Star Cluster groups Stars into runs. The first Star starts a cluster, anchor price, bar, and time are recorded, each additional Star increments the cluster count, and all Stars belong to the same run until exit. This prevents duplicate entries, signal spam, and overtrading in volatile conditions.
⛔ Reset Gap Logic — Temporal Control
To prevent rapid re-entry, a minimum time gap is required to start a new run. Stars occurring too close together are merged. Reset does not terminate active runs. This enforces time-based discipline, not indicator-based guessing.
1➡️ Entry Logic — Confirmation-Based Execution
The engine never enters on the first Star. Instead, the user defines 🔢 N (Entry Star Index). Entry occurs only on the Nth Star, and that bar is marked 1➡️🔢N. This ensures entries occur after persistence, not detection. At ENTRY, Best = 0.00 and Worst = 0.00. Statistics measure real trade performance, not early signal noise.
📊 STAT Engine — Live Trade Measurement
Once entry is active, the STAT engine tracks ⏱ run progression, 🏅 maximum favorable excursion, and 📉 maximum adverse excursion. Mechanics: uses highs and lows, not closes; updates every bar; entry bar resets stats; historical bars marked 🎨. This creates an objective performance envelope for every trade.
🛑 Exit Engine — Deterministic Outcomes
Trades are exited using explicit rules: 🏅 WIN → profit threshold reached, 📉 LOSE → risk threshold breached, ⏱ QUIT → structural or safety exit.
Safety Exits
🐢 Idle Stop — no Stars for N bars.
🧯 Freeze Failsafe — STAT inactivity.
QUIT is a controlled termination, not failure. Each exit is recorded with a short cause tag.
🧾 Trade Memory & Journaling
Every trade produces immutable records. Entry: time, price, side, confirmation index. Exit: time, price, PnL, result, cause. These records power tables, alerts, JSON output, and external automation.
📊 Time-Block Performance (NY Clock)
Performance is grouped by real time, not bar count. Rolling NY blocks (e.g. 3 hours). Independent statistics per block. Live trades persist across block boundaries. This enables session-based analysis.
🔔 Alerts & Automation
Alerts are state-based: Entry confirmed → Long / Short alert. Trade closed → Exit alert. Optional JSON output allows integration with bots, journals, and dashboards.
Summary
The Star Engine is a component-based trade execution system, where Bomb measures pressure, Golden validates structure, Stars qualify impulses, clusters define runs, entry is delayed by confirmation, stats measure reality, exits are deterministic, and results are time-aware. It is not designed to “predict the market”, but to control how trades are formed, managed, and evaluated.

Straight Regression Line + Normalized Slope (Adaptive Length)Find the regression line of available candles.
It will print the slope and the normalized slope

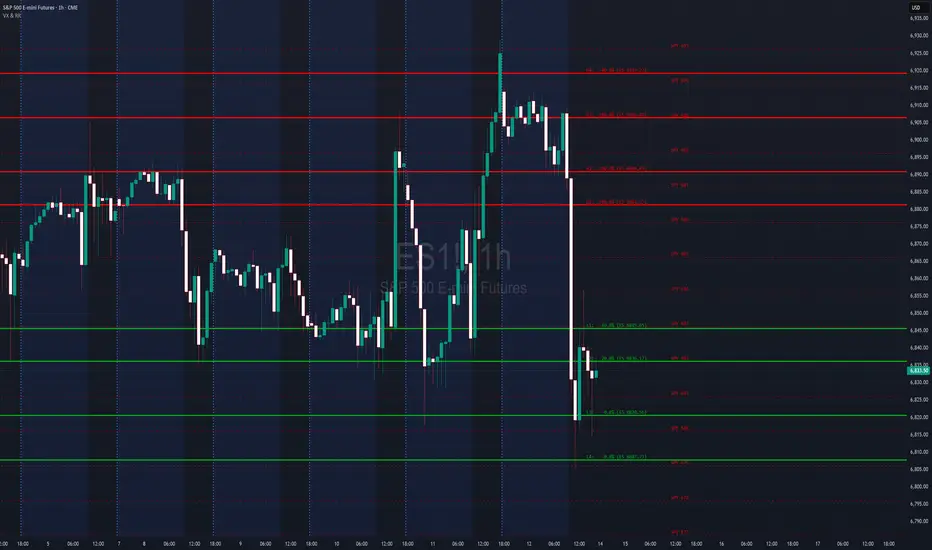
VX Levels and Ranch Ranges with Price ConverterThis is a indicator for all Vexly subscribers to plot the following:
1. Plot SPY/SPX levels on your ES chart. Or QQQ levels on your NQ chart
2. VX levels obtained from vx_levels command. SPY on ES chart and QQQ on NQ chart
3. Ranch Range levels from the discord channel for ES and NQ chart.
You can enable/disable any of them at your discretion.
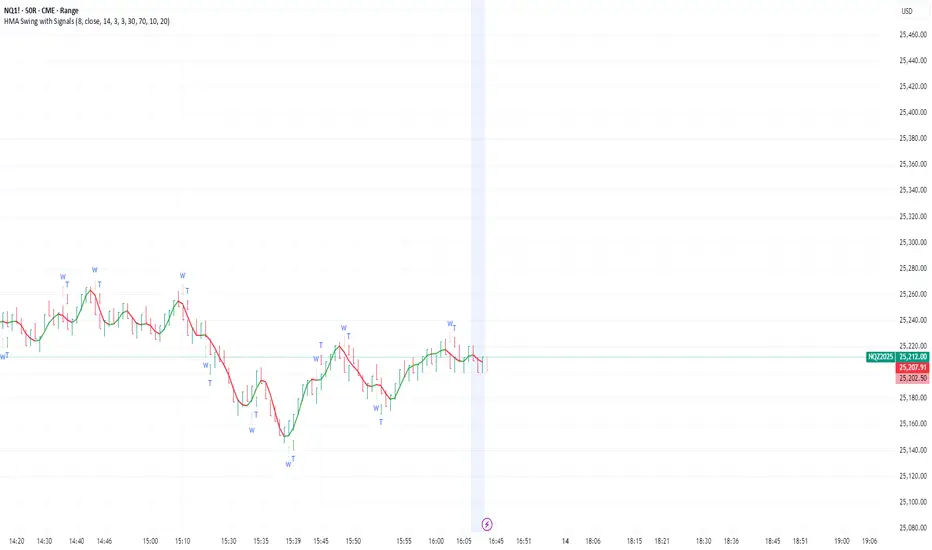
Swing TraderCore Logic
This is a swing reversal system designed to catch bounces at swing lows (LONG) and rejections at swing highs (SHORT).
Signal Flow:
Warning Phase: Yellow diamonds appear when price makes new lows/highs within the lookback period
Entry Phase: Signals fire when price bounces back after the warning (close > previous low for LONG, close < previous high for SHORT)
Swing Size Filter: Requires minimum point movement (default 50 points) between the stored high/low levels
Strengths
✅ Two-step system prevents premature entries - warns first, then confirms
✅ Alternating signals - won't fire consecutive LONGs or SHORTs
✅ Swing size requirement ensures meaningful moves
✅ Clean visuals - large labels, thick lines, clear table
Pops Dividend 7-Day RadarHow traders use it as a strategy anyway 🧠
In real life, this becomes a manual or semi-systematic strategy:
Strategy logic (human-driven):
Scan for highest yield stocks
Filter for ex-date within 7 days
Apply technical rules (trend, EMAs, support)
Enter before ex-date
Exit:
Before ex-date (momentum run-up)
On ex-date
Or after dividend (reversion play)
Indicator’s role:
“Tell me when a stock qualifies so I can decide how to trade it.”
That’s exactly what this tool does.
How we could turn this into a strategy-style framework
Even though Pine won’t let us backtest dividends properly, we can:
Build a rules-based checklist (entry/exit rules)
Create alerts that behave like strategy triggers
Combine with:
EMA trend filters
Volume conditions
ATR-based exits
Label it as:
“Pops Dividend Capture Playbook” (manual execution)
This keeps it honest, legal, and reliable.
Bottom line
🧩 Indicator = what we built
📘 Strategy = how you trade it using the indicator
⚠️ TradingView limitations prevent a true dividend strategy backtest

Multi-Timeframe CPR Pattern AnalyzerMulti-Timeframe CPR + Advanced Pattern Analyzer
A powerful, all-in-one indicator designed for professional price-action traders who use CPR (Central Pivot Range) as the core of their intraday, positional, and swing-trading strategies.
This script automatically plots Daily, Weekly, and Monthly CPR, identifies major CPR patterns, highlights Developing / Next CPR, and displays everything neatly in an interactive dashboard.
✨ Key Features
1️⃣ Daily, Weekly & Monthly CPR
Fully configurable CPR for all three timeframes
Clean plots with no vertical connector lines
Automatic zone shading
Adjustable line width, transparency, and colors
2️⃣ Support & Resistance (S1–S3, R1–R3)
Choose which timeframe’s S/R you want
Only plotted for the current day/week/month (no cluttering past charts)
Helps traders identify reaction zones and breakout levels
3️⃣ Next / Developing CPR
A unique feature rarely found in CPR indicators.
You can display:
Developing Daily CPR
Developing Weekly CPR
Next Monthly CPR (after month close)
All next/developing CPRs are plotted in a dashed style with optional transparency, plus labels:
“Developing Daily CPR”
“Developing Weekly CPR”
“Next Weekly CPR”
“Next Monthly CPR”
This allows you to anticipate the next session’s CPR in advance, a major edge for intraday, swing, and options traders.
4️⃣ Advanced CPR Pattern Detection
The script automatically detects all important CPR market structures:
📌 Narrow CPR
Uses statistical percentiles based on historical CPR width
Helps identify potential high-volatility breakout days
📌 CPR Width Contraction
Detects compression zones
Excellent for identifying trending days after tight ranges
📌 Ascending / Descending CPR
Bullish trend continuation (Ascending)
Bearish trend continuation (Descending)
📌 Virgin CPR
Highlights untouched CPR zones
Strong support/resistance zones for future days/weeks
📌 Overshoots
Detects:
Bullish Overshoot
Bearish Overshoot
Useful for understanding trend exhaustion.
📌 Breakouts
Identifies when price breaks above TC or below BC, signaling trend shifts.
📌 Rejections
Shows wick-based CPR rejections — reversal cues used by many price-action traders.
5️⃣ CPR Pattern Dashboard
A beautifully formatted dynamic table showing:
For Daily, Weekly, Monthly:
TC, Pivot, BC values
Current CPR Pattern
CPR Width with %
+ Next/Developing CPR values and patterns (for Daily/Weekly)
No need to manually calculate anything — everything is displayed in a clean, compact panel.
6️⃣ Completely Dynamic Across Timeframes
Works on all intraday, daily, weekly, and monthly charts
Automatically adjusts CPR length based on chart timeframe
Perfect for NIFTY, BANKNIFTY, FINNIFTY, stocks, crypto, forex
7️⃣ Alerts Included
Receive alerts for:
Narrow CPR formation
Virgin CPR
CPR breakouts
Pattern transitions
Great for traders who want automated monitoring.
8️⃣ Clean Chart, No Clutter
The script includes:
No vertical connecting lines
S/R only on the current period
Smart hiding of CPR on boundaries (to avoid "jump lines")
Fully toggleable features
You get a professional-grade, clutter-free CPR experience.
🎯 Why This Indicator?
This script goes beyond standard CPR tools by offering:
Next AND Developing CPR
Multi-timeframe CPR analysis
Professional CPR pattern detection
Smart dashboard visualization
Perfect setup for trend traders, reversal traders, and breakout traders
Whether you're scalping, day trading, swing trading, or doing positional analysis — this tool gives you context, structure, and precision.
📌 Recommended Use Cases
Intraday index trading (NIFTY, BANKNIFTY, NIFTY 50 Stocks)
Swing trading stocks
Crypto CPR analysis
Options directional setups
CPR-based breakout and reversal strategies
Trend continuation identification
Understanding volatility days (Narrow CPR Days)
⚠️ Disclaimer
This is a technical tool for chart analysis and does not guarantee profits. Always combine CPR analysis with price action, volume, and risk management.

S&R Detector by Rakesh SharmaSupport & Resistance Auto-Detector
Automatically identifies key Support and Resistance levels with strength ratings
✨ Key Features:
🎯 Intelligent S/R Detection
Automatically finds Support and Resistance levels based on swing highs/lows
Shows strength rating (Very Strong, Strong, Medium, Weak)
Displays number of touches at each level
📅 Key Time-Based Levels
Previous Day High/Low (PDH/PDL) - Blue lines
Previous Week High/Low (PWH/PWL) - Purple lines
Optional Round Numbers for psychological levels
⚙️ Fully Customizable
Adjust sensitivity (5-20 pivot length)
Filter by minimum touches (1-10)
Control maximum levels displayed (3-20)
Optional S/R zones (shaded areas)
📊 Live Dashboard
Shows nearest Support/Resistance
Distance to key levels
Total S/R levels detected
🔔 Smart Alerts
PDH/PDL breakout signals
Visual markers on chart
Perfect for: Intraday traders, Swing traders, Price action analysis

RSI Multi-TimeFrame [PACHI]This will show a Table with multiple time frames RSI levels.
> 68 the table cell will be red for given timeframe to indicate overbought
< 35 the table cell will be green for given timeframe to indicate oversold
there are few settings you can play with. if you have any suggestions, let me know.
// Pachi

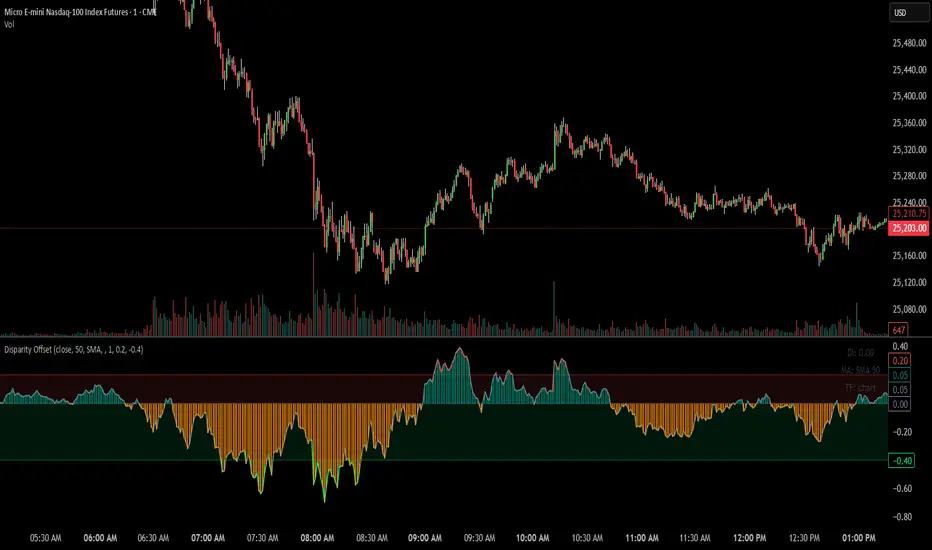
Disparity Offset [WizardTrendsInc]Disparity Offset
Description
Disparity Offset measures how far price is offset from a selected moving average, expressed as a percentage. It shows whether price is trading above or below its average and by how much, helping visualize price extension, balance, and deviation from the mean. The indicator oscillates around a zero line, where zero represents price being aligned with the moving average.
How to Use Disparity Offset
Zero Line (0%)
When the Disparity Offset is near zero, price is close to the moving average, suggesting equilibrium.
Positive Values
Values above zero indicate price is above the moving average. Larger positive readings show stronger upward offset from the average.
Negative Values
Values below zero indicate price is below the moving average. Larger negative readings show stronger downward offset
Upper & Lower Offset Zones
The configurable upper and lower percentage levels highlight when price is relatively far from the moving average. Movement back toward the zero line can be used to study mean-reversion behavior.
Visual Aids
Histogram bars show direction and intensity of the offset
Shaded zones emphasize overextended conditions
Optional markers display crossings of offset levels and the zero line for observation and learning
"Disclaimer: This indicator is intended for educational purposes only and does not constitute financial advice. Trading involves significant risk, and users should perform their own research and consult with a licensed financial advisor before making any trading decisions.
Visible Range / POC / Volume / SNR Detector PROVisible Range POC & Volume SNR Detector PRO
Visible Range POC & Volume SNR Detector PRO is a professional-grade volume-based market structure tool designed to identify institutional Support & Resistance zones, Point of Control (POC), and Value Areas directly from the visible chart range.
This indicator goes beyond traditional swing highs and lows by analyzing real traded volume, revealing where large players are active, where price finds fair value, and where high-probability reactions are most likely to occur.
🔍 Core Features
📊 Visible Range Volume Profile
🔹Builds a full Volume Profile using only the visible chart range
🔹Splits price into configurable precision bins for maximum accuracy
🔹Detects true volume clusters instead of subjective price levels
🎯 Point of Control (POC)
🔹 Automatically identifies the highest-volume price level
🔹Acts as a magnet price where market participants agree on value
🔹Fully customizable line style, width, and color
🔹 Optional label with timeframe + price + volume (K / M / B)
📦 Value Area (VAH / VAL)
* Calculates Value Area High & Low around the POC
* Default **70% volume range** (institutional standard)
* Optional Value Area fill for clear fair-value visualization
* Helps distinguish **range conditions vs trending moves**
🧱 Volume-Based Support & Resistance Zones
🔹Automatically detects high-impact S&R zones from volume behavior
🔹Zones are visually classified by strength:
🔹 🟢 Strong
🔹 🟡 Medium
🔹 🔴 Weak
🔹Clean box rendering with customizable borders:
🔹 Solid / Dashed / Dotted
🔹 Zones extend dynamically into the future for planning trades
🔄 Dynamic Flip Logic (PRO Standard)
🔹 Advanced Dynamic Flip system:
🔹 Support ➜ Resistance after a breakdown
🔹Resistance ➜ Support after a breakout
🔹 Reflects real market structure shifts
🔹Eliminates outdated static levels
🔁 True Retest & Zone Intelligence
🔹Each zone includes detailed contextual data:
🔹🔄 True Retest Count (price leaves zone and comes back)
🔹⏳ Zone Age (minutes / hours / days)
🔹💪 Strength Classification
🔹🔁 Flip Status
🔹⏱️ Timeframe
🔹💲 Exact price level
🔹All information is displayed in a single clean label.
🔔 Smart Alerts System
🔹Never miss key interactions:
🔹🟢 Touch Alert — price enters a zone
🔹⬇️⬆️ Break Alert — zone failure or breakout
🔹🔄 Retest Alert — classic break & retest setup
Alerts trigger on confirmed bars to reduce noise and false signals.
📋 Professional Dashboard
🔹At-a-glance market overview:
🔹Total Support & Resistance zones
🔹🎯 POC level
🔹📦 VA High / VA Low
🔹💪 Strong / Medium / Weak zone distribution
🔹📍 Nearest Support & Resistance
🔹📏 Distance to key levels
🔹 🎨 Auto / Dark / Light theme support
🔹 📐 Adjustable size & position

GIX-Treid-2Timeframes: M15 – H1 (and higher)
An advanced SuperTrend, more stable and more intelligent, based on statistical calculations, not market noise.
It calculates a statistical moving average, significantly smoother than EMA or SMA.
It builds an adaptive channel around this average, using fixed pip/tick steps (not a classic ATR).
The trend changes only when price breaks the channel, not on minor fluctuations.
The main line moves in discrete steps, not continuously → no repaint and no whipsawing.
Line color indicates direction:
Green = bullish trend
Red = bearish trend

HTF Candle BoxFor HTF pattern in real time LTF view.
Used for AMD pattern, to always keep eye on the progress of HTF, but with stay in the LTF.
It will improve your confirmations.

MACD X SignalsThis is a fundamental signal indicator based on MACD crossovers. It enhances the standard MACD by adding visual labels that classify signals based on their location relative to the Zero Line. This helps identify whether a trend is reversing, continuing, or potentially overextended.
Signal Legend:
B (Reversal): Bullish crossover in the Negative Zone .
B+ (Neutral): Bullish crossover in the Middle Zone .
B- (Trend): Bullish crossover in the Positive Zone
S : MACD crossing down (Bearish signal).

Daily Auto-Fib Zones (Custom Colors)This indicator automatically draws daily Fibonacci-based zones using the current session’s high and low. The levels update dynamically as new price action forms and include optional visual regions for several commonly referenced retracement percentages.
Features include:
• Automatic detection of the daily high and low
• Real-time updates throughout the session
• Optional zones for 0.11–0.17, 0.5, and 0.618–0.786 levels
• Custom color inputs for every line and zone
• Dynamic boxes that expand with the day’s range
• Lightweight visual layout with toggleable components
The tool is intended purely for chart visualization. It does not provide signals or trade recommendations.

Weekly Auto-Fib Zones (Custom Colors) This script automatically plots weekly Fibonacci-based zones using the current week’s high and low. It updates dynamically as new price action forms and provides optional visual regions for key retracement areas.
The indicator includes:
• Weekly high/low anchor lines
• Optional 0.11–0.17 zones
• Optional 0.5 midpoint (premium/discount)
• Optional 0.618–0.786 retracement band
• Customizable colors for each level
• Dynamic boxes that expand as the week progresses
It is designed as a visual aid for identifying weekly ranges, contextual zones, and potential areas of interest based solely on Fibonacci percentages. No signals, alerts, or trading recommendations are included.

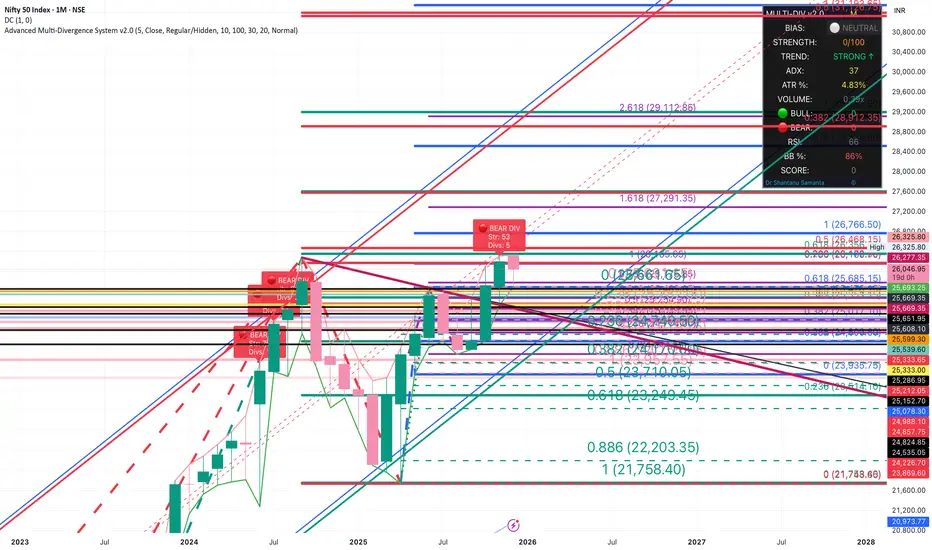
Critical Advanced Multi-Divergence Dashboard
Complete Dashboard Interpretation Guide
Dashboard Metrics Explained
1. Timeframe
What it shows: Current chart timeframe (15m, 1H, 4H, 1D, etc.)
How to interpret:
The script auto-detects your chart timeframe
Higher timeframes (4H, 1D) = more reliable signals but fewer trades
Lower timeframes (5m, 15m) = more signals but higher noise
Best practice: Use multiple timeframes - get signal on 1H, confirm on 15m for entry
2. Signal Bias: BULLISH / BEARISH / NEUTRAL
What it shows: Overall market direction based on divergence consensus
Color coding:
🟢 BULLISH (Green) = Net strength > +10 → Expect upward move
🔴 BEARISH (Red) = Net strength < -10 → Expect downward move
⚪ NEUTRAL (Gray) = Net strength between -10 to +10 → No clear direction
How to interpret:
BULLISH: Multiple bullish divergences detected → Look for LONG entries
BEARISH: Multiple bearish divergences detected → Look for SHORT entries
NEUTRAL: Conflicting signals or weak divergences → WAIT, don't trade
Trading Action:
BULLISH + Strength > 60 = Strong BUY signal
BEARISH + Strength > 60 = Strong SELL signal
NEUTRAL = Stay out, wait for clarity
3. Signal Strength: 0-100
What it shows: Quantified power of the divergence signal
Strength Scale:
🔴 0-30 (Red): Weak signal → Don't trade
🟠 31-60 (Orange): Moderate signal → Trade with caution, reduce position size
🟢 61-100 (Green): Strong signal → High confidence trade
Calculation factors:
Number of divergences detected
Volume confirmation (1.3x multiplier if high volume)
Trend filter (ADX reduces counter-trend signals by 40%)
Weighted scoring (volume-based indicators get 1.5x weight)
How to use:
Strength > 70 + ADX < 20 = Best reversal trades
Strength > 60 + Volume HIGH = Excellent entry
Strength < 40 = Skip the trade
Example Scenarios:
Strength = 85 → Take full position size
Strength = 55 → Take 50% position, tight stop loss
Strength = 25 → No trade, wait for better setup
4. Quality Score: 0-100
What it shows: Overall reliability and confidence rating
Components (max 100 points):
Divergence count (40 points): More indicators confirming = higher quality
Volume confirmation (20 points): High volume adds 20, normal adds 10
Trend alignment (20 points): Signal aligning with trend = 20, against trend but weak ADX = 15
Detection timing (20 points): Confirmed signals = 20, early detection = 15
Quality Tiers:
80-100: Excellent - High probability setup
60-79: Good - Tradeable with proper risk management
40-59: Fair - Only for experienced traders
Below 40: Poor - Avoid trading
How to use:
Quality > 75 + Strength > 60 = Grade A setup
Quality > 60 + Strength > 50 = Grade B setup (reduce size)
Quality < 50 = Don't trade regardless of strength
5. Bullish Divs: 3R/2H (Example)
What it shows: Count of bullish divergences detected
R = Regular divergences (price LL, indicator HL)
H = Hidden divergences (price HL, indicator LL)
Interpretation:
Regular divergences = Reversal signals (more important)
Hidden divergences = Continuation signals (trend confirmation)
Examples:
4R/1H → Strong bullish reversal expected
1R/3H → Bullish trend continuation likely
5R/0H → Very strong reversal setup
Trading Logic:
High R count = Look for trend reversal
High H count = Trend is strong, look for pullback entries
R+H both high = Very strong signal, major move expected
6. Bearish Divs: 2R/1H (Example)
Same logic as Bullish Divs but for downside:
2R/1H → Moderate bearish reversal setup
0R/4H → Strong downtrend continuation
4R/3H → Extremely strong bearish signal
7. ADX (Trend): 35
What it shows: Average Directional Index - measures trend strength
ADX Scale:
0-20: Weak or no trend → Range-bound market
20-25: Emerging trend → Early trend formation
25-50: Strong trend → Trend is established
50-75: Very strong trend → Major directional move
75+: Extremely strong trend → Parabolic move, be cautious
Color Coding:
🟠 Orange (ADX > threshold): Strong trending market
⚪ Gray (ADX < threshold): Weak trend/ranging
How to interpret:
ADX < 20 + BULLISH Signal = Best for reversal trades (range breakout)
ADX > 25 + BEARISH Signal = Counter-trend, risky (signal strength reduced 40%)
ADX > 40 + Signal against trend = Dangerous, skip
ADX < 20 + High Strength = Perfect reversal setup
Trading Examples:
ADX = 15, BULLISH strength 75 → Perfect buy at bottom
ADX = 45, BEARISH strength 60 → Caution: Market in strong uptrend, bearish signal gets discounted
ADX = 50, BULLISH strength 80 → Trend continuation: Pullback in uptrend, good long entry
8. Volume: HIGH / Normal
What it shows: Current volume vs 20-period moving average
Volume Status:
🟡 HIGH (Yellow): Volume > 1.5x average → Signal multiplied by 1.3x
⚪ Normal (Gray): Volume ≤ 1.5x average → Signal multiplied by 0.8x
Why it matters:
High volume = More participation = More reliable signal
Normal/low volume = Weak conviction = Less reliable
Trading Rules:
HIGH volume + Strong signal = Take trade immediately
Normal volume + Strong signal = Wait for volume confirmation
HIGH volume + Weak signal = Still tradable (volume validates)
Normal volume + Weak signal = Definitely skip
Example:
Strength 50 + HIGH volume → Effective strength = 65 (tradable)
Strength 50 + Normal volume → Effective strength = 40 (skip)
9. Volatility: 2.35%
What it shows: ATR (Average True Range) as percentage of price
Volatility Scale:
< 1%: Very low volatility → Tight ranges, breakout coming
1-2%: Normal volatility → Standard market conditions
2-3%: Elevated volatility → Bigger moves expected
> 3%: High volatility → Large swings, wider stops needed
How to use:
Low volatility (< 1%) = Tighten stops, smaller targets
Normal (1-2%) = Standard position sizing
High (> 3%) = Reduce position size, wider stops
Impact on trading:
High volatility → Script auto-adjusts pivot periods (better divergence detection)
Stop loss placement: Use ATR × 2 for stop distance
Position sizing: Reduce size in high volatility
10. Detection: EARLY / Confirmed
What it shows: Whether signal detected before or after pivot confirmation
Detection Modes:
🟡 EARLY (Yellow): Signal detected before pivot confirms → Earlier entry but slightly less reliable
🟢 Confirmed (Green): Signal after pivot confirmation → More reliable but later entry
Trade-off:
EARLY mode:
+ Enter 2-5 bars earlier
+ Better risk/reward ratio
- 10-15% more false signals
Confirmed mode:
+ Higher reliability
+ Better for conservative traders
- May miss 10-20% of move
How to use:
Aggressive traders: Use EARLY mode + higher quality threshold (>70)
Conservative traders: Use Confirmed mode + moderate quality (>60)
🎯 Complete Trading Decision Matrix
STRONG BUY Signal ✅
Signal Bias: BULLISH
Signal Strength: > 70
Quality Score: > 75
Bullish Divs: ≥ 3 (preferably high R count)
ADX: < 25 (weak trend/reversal) OR > 30 with DI+ > DI-
Volume: HIGH
Action: Enter LONG with full position
STRONG SELL Signal ✅
Signal Bias: BEARISH
Signal Strength: > 70
Quality Score: > 75
Bearish Divs: ≥ 3 (preferably high R count)
ADX: < 25 (weak trend/reversal) OR > 30 with DI- > DI+
Volume: HIGH
Action: Enter SHORT with full position
Moderate Trade ⚠️
Signal Strength: 50-70
Quality Score: 60-75
Volume: Normal
Action: Enter with 50% position size, tight stop loss
NO TRADE ❌
Signal Bias: NEUTRAL
Signal Strength: < 50
Quality Score: < 60
ADX: > 40 (signal against strong trend)
Volume: Normal + Strength < 50
Action: Stay out, wait for better setup
📊 Real Trading Examples
Example 1: Perfect Bullish Setup
Timeframe: 1H
Signal Bias: BULLISH 🟢
Signal Strength: 82/100 🟢
Quality Score: 88/100
Bullish Divs: 5R/2H (excellent)
Bearish Divs: 0R/0H
ADX: 18 (weak trend, perfect for reversal)
Volume: HIGH 🟡
Volatility: 1.8%
Detection: EARLY 🟡
INTERPRETATION: Grade A+ setup
- Strong bullish consensus (5 regular divergences)
- Low ADX = perfect reversal condition
- High volume confirms the signal
- Quality 88 = highly reliable
ACTION:
✅ Enter LONG immediately with full position
✅ Stop loss: 2 × ATR below entry (3.6%)
✅ Target: Previous swing high or 2:1 R/R
Example 2: Risky Counter-Trend Signal
Timeframe: 15m
Signal Bias: BEARISH 🔴
Signal Strength: 55/100 🟠
Quality Score: 62/100
Bearish Divs: 2R/1H
ADX: 45 (very strong uptrend)
Volume: Normal
Detection: EARLY
INTERPRETATION: Dangerous setup
- ADX 45 = strong uptrend in place
- Bearish signal is counter-trend
- Script already reduced strength by 40%
- Moderate quality, normal volume
ACTION:
❌ SKIP this trade
⏸️ Wait for ADX to drop below 25
⏸️ Or wait for bearish strength > 70 with HIGH volume
Example 3: Wait and Watch
Signal Bias: NEUTRAL ⚪
Signal Strength: 35/100 🔴
Quality Score: 48/100
Bullish Divs: 1R/1H
Bearish Divs: 1R/0H
ADX: 22
Volume: Normal
INTERPRETATION: Conflicting signals
- Both bullish and bearish divergences present
- Low strength and quality
- No clear direction
ACTION:
⏸️ Don't trade - wait for clarity
👀 Watch for one side to dominate
📊 Check higher timeframe for context
🎓 Pro Tips for Dashboard Reading
Check Multiple Timeframes:
Signal on 4H + confirmation on 1H = Best trades
Higher TF gives direction, lower TF gives entry
Volume is King:
Never ignore HIGH volume signals (even if strength is moderate)
Be extra cautious with normal volume + weak signals
ADX Context Matters:
ADX < 20 + Divergence = Reversal opportunity
ADX > 40 + Counter-trend divergence = Dangerous
Quality Over Strength:
Quality 80 + Strength 60 > Quality 50 + Strength 80
High quality ensures the signal is real, not noise
Regular vs Hidden Divergences:
High R count = Reversal expected (more important)
High H count = Continuation (use for re-entries)
Early Detection Trade-off:
Use EARLY for swing trading (better R/R)
Use Confirmed for day trading (higher accuracy)
⚡ Quick Decision Flowchart
Step 1: Check Signal Bias
├─ NEUTRAL? → ❌ Don't trade
└─ BULLISH/BEARISH? → Continue
Step 2: Check Signal Strength
├─ < 50? → ❌ Don't trade
├─ 50-60? → Reduce position 50%
└─ > 60? → Continue
Step 3: Check Quality Score
├─ < 60? → ❌ Don't trade
└─ ≥ 60? → Continue
Step 4: Check ADX
├─ > 40 AND counter-trend? → ❌ Don't trade
└─ < 40 OR with-trend? → Continue
Step 5: Check Volume
├─ HIGH → ✅ Take trade (boost confidence)
└─ Normal → Check if strength > 60, then ✅ trade
Step 6: Position Sizing
├─ Strength > 70 + Quality > 75 → 100% position
├─ Strength 60-70 + Quality 60-75 → 75% position
└─ Strength 50-60 + Quality 60-70 → 50% position
This dashboard gives you a complete edge in divergence trading by quantifying what was previously subjective! 🚀
Only for Educational purpose

Capitulation Finder(Sahebson)The Capitulation Finder detects potential exhaustion points in trend moves by identifying price dislocations combined with surging volume and extreme RSI levels.
A bullish capitulation signal is generated when price drops significantly below a user-defined moving average while RSI is oversold and volume spikes above the average.
A bearish capitulation signal is triggered under the opposite conditions—price extended above the moving average, RSI overbought, and volume elevated.
Additional confirmation signals highlight persistent overbought or oversold conditions with volume strength. This tool helps traders pinpoint possible reversal zones during volatile market conditions.

Critical Advanced Multi-Divergence System v2.0Auto calculates 15 indicators , assigns different strength to each and auto adds up to give a Final bias . Auto detects scrip & time frame . Sums up everything in a Dashboard. For educational use only
CandleMapTF - Automatic Candle Structure ToolDescription:
This Pine Script creates an "Automatic Candle Structure Tool" for TradingView that visually manages market structure and dealing ranges across multiple timeframes.
All elements, including colors, opacity, and displayed levels are fully customizable.
Disclaimer:
This script is for educational and informational purposes only and does not
constitute financial advice, investment advice, or a trading recommendation.
Use at your own risk.

Prime -Hub Prime -Hub is a comprehensive, all-in-one technical analysis toolkit designed for professional Intraday and Swing traders on Nifty, BankNifty, and Stocks. This script consolidates three powerful institutional logic systems into a single, clean interface, replacing the need for multiple indicators.
Disclaimer: This tool is for educational and analytical purposes only. Past performance does not guarantee future results. Trading involves substantial risk.

Institutional Dominance/Trapped Trader Profile @MaxMaserati 3.0📊 Institutional Dominance & Trapped Trader Delta Profile
@MaxMaserati 3.0
═════════════════════════════════════════════════════════════
🎯 OVERVIEW
The IDT Auction Profile is a professional-grade volume order flow analysis tool that reveals where institutional traders hold Positional Advantage and where retail participants are Trapped. Unlike traditional Volume Profile indicators, the IDT Profile integrates Volume Point Delta (VPD) analysis with advanced pattern recognition to identify the exact price levels where profitable institutional positions create support/resistance, and where losing positions are forced to exit.
This indicator answers the critical questions: Who is in profit? Who is trapped? And where will they defend or exit their positions?
═════════════════════════════════════════════════════════════
✨ FEATURES
═════════════════════════════════════════════════════════════
⚡ Quick Presets - One-click configuration for:
• Scalper (1m-5m): 75 bars, 50 rows, ★3 confluence
• Day Trader (15m-1h): 150 bars, 60 rows, ★3 confluence
• Swing Trader (4h-D): 300 bars, 80 rows, ★4 confluence
🔔 Price Alerts - Get notified when price touches:
• VAH (Value Area High) - Resistance zone
• VAL (Value Area Low) - Support zone
• Adjustable sensitivity (0.05% - 1.0%)
📏 POC Line Extensions - Historical context lines extending left from key institutional levels
👻 Previous Session POCs - Dotted reference lines showing prior period levels (carry-over zones)
📊 Real-Time Statistics Panel:
• Total Volume
• Net Delta
• Buy/Sell Pressure %
🎨 Visual Enhancements:
• Column dividers for clarity
• Transparency controls
• Profile auto-hide when price moves away
• Cached color schemes for 30% performance boost
═════════════════════════════════════════════════════════════
🧠 CORE CONCEPT: DOMINANCE VS TRAPPED POSITIONING
═════════════════════════════════════════════════════════════
The indicator categorizes all market participants into two strategic positions based on their entry price relative to current market price:
📍 ABOVE CURRENT PRICE (Resistance Zones)
🔴 Aggressive Sellers in Profit - Sold higher, currently winning. Will defend positions or add to winners.
🟥 Trapped Buyers at Loss - Bought higher, currently losing. Must exit at breakeven, creating resistance.
📍 BELOW CURRENT PRICE (Support Zones)
🟢 Aggressive Buyers in Profit - Bought lower, currently winning. Will defend positions or add to winners.
🟩 Trapped Sellers at Loss - Sold lower, currently losing. Must cover at breakeven, creating support.
⚡ MAXIMUM CONFLUENCE ZONES
When Dominant (Profitable) and Trapped (Loss) positions align at the same level, you get the strongest support/resistance zones:
🟧 Orange Boxes (Above Price) = Aggressive Sellers + Trapped Buyers = STRONGEST RESISTANCE
🟨 Yellow Boxes (Below Price) = Aggressive Buyers + Trapped Sellers = STRONGEST SUPPORT
═════════════════════════════════════════════════════════════
📊 VOLUME ANALYSIS COLUMNS
═════════════════════════════════════════════════════════════
1️⃣ VPD Column (Volume Point Delta)
Net aggressive pressure at each price level (Buying Volume - Selling Volume)
- Bullish Delta (Green): Buyers dominated the auction at this level
- Bearish Delta (Red): Sellers dominated the auction at this level
- Smart Coloring: Automatically highlights institutional patterns
2️⃣ VPS Column (Volume Point of Sell - ASK Volume)
Aggressive buying volume that "lifted the offer" by hitting ask prices
- Represents participants who paid the ask price to enter long
- When price is below this level = These buyers are in profit
- When price is above this level = These sellers who got hit are in profit
- Shows institutional bid volume absorption
3️⃣ VPB Column (Volume Point of Buy - BID Volume)
Aggressive selling volume that "hit the bid" by taking bid prices
- Represents participants who sold at bid price to enter short
- When price is above this level = These sellers are in profit
- When price is below this level = These buyers who got hit are in profit
- Shows institutional ask volume absorption
4️⃣ SVP Column (Optional - Session Volume Profile)
Traditional combined volume profile without bid/ask separation
═════════════════════════════════════════════════════════════
🔍 ADVANCED INSTITUTIONAL PATTERNS DETECTION
═════════════════════════════════════════════════════════════
The indicator uses statistical analysis (standard deviation, moving averages, hit counting) to identify institutional footprints:
⚡ Failed Auctions - "BUYERS TRAPPED" or "SELLERS TRAPPED" labels
• High volume entered, but price immediately reversed
• Creates extreme concentrations of losing positions
• Trading Implication: High-probability reversal zones where trapped participants must exit
📈 Volume Spikes - Bright green/red bars in VPD column
• Volume exceeds average by 2+ standard deviations
• Represents aggressive institutional entry
• Trading Implication: Potential trend continuation or setup for failed auction
🛡️ Absorption Zones - Yellow/Orange colored bars
• Large passive orders absorbing aggressive volume without price movement
• Indicates accumulation (bullish) or distribution (bearish)
• Trading Implication: Institutional positioning before major moves
🧊 Iceberg Orders - Cyan colored bars with high hit counts
• Same price level shows repeated volume without clearing
• Reveals hidden institutional limit orders split into small pieces
• Trading Implication: Strong liquidity magnets, price often returns here
💜 Volume Exhaustion - Purple colored bars
• Sharp volume drop (50%+) after spike
• Momentum exhausted, participants depleted
• Trading Implication: Potential reversal or consolidation ahead
═════════════════════════════════════════════════════════════
🎨 SMART INSTITUTIONAL COLORING
═════════════════════════════════════════════════════════════
Colors bars based on detected patterns vs simple red/green:
🟨 Yellow = Bullish battles won (buyers + trapped sellers)
🟧 Orange = Bearish battles won (sellers + trapped buyers)
🔵 Cyan = Iceberg orders (hidden liquidity)
🟣 Purple = Large passive orders
🟢 Bright Green = Buying spikes (institutional aggression)
🔴 Bright Red = Selling spikes (institutional aggression)
═════════════════════════════════════════════════════════════
⭐ CONFLUENCE SCORING SYSTEM
═════════════════════════════════════════════════════════════
Each price level receives 1-5 stars based on:
★★ Volume spike presence (+2 stars)
★ Absorption pattern (+1 star)
★ Large passive orders (+1 star)
★ Proximity to Value Area (+1 star)
★★ Iceberg detection (+2 stars)
★★ Failed auction (+2 stars)
Minimum Signal Strength filter lets you show only levels with ★3+ confluence for highest-quality signals.
═════════════════════════════════════════════════════════════
🎯 VALUE AREA ANALYSIS
═════════════════════════════════════════════════════════════
VAH (Value Area High) - Blue Line
- Top of the 70% volume acceptance zone
- Price at VAH often rejects downward (resistance)
- Alert triggers when price approaches
VAL (Value Area Low) - Red Line
- Bottom of the 70% volume acceptance zone
- Price at VAL often bounces upward (support)
- Alert triggers when price approaches
Trading Applications:
- Price outside Value Area → Mean reversion opportunity
- Price breaks VA with volume → Trend continuation
- Price oscillates within VA → Range-bound, fade extremes
- Previous session VA lines show carryover levels
═════════════════════════════════════════════════════════════
📋 EXPECTED PRICE BEHAVIOR AT KEY LEVELS
═════════════════════════════════════════════════════════════
⚠️ IMPORTANT: These are observed behavioral patterns for educational purposes and backtesting research. Always validate with 250-500+ backtest trades before risking capital.
1️⃣ POC BOX ZONES (Highest Statistical Relevance)
🟨 Yellow Boxes (Below Current Price - SUPPORT)
Expected Behavior:
- Price approaching from above typically encounters buying pressure
- Both profitable institutional buyers and trapped short sellers create demand
- Common reaction: Price slows, consolidates, or bounces
- Failed bounces often lead to rapid breakdown (trapped buyers capitulate)
What Often Happens:
- Initial dip into zone → Weak bounce attempt
- Second test → Stronger bounce (trapped sellers covering + buyers defending)
- Break below → Quick acceleration as both groups exit
🟧 Orange Boxes (Above Current Price - RESISTANCE)
Expected Behavior:
- Price rallying into zone typically encounters selling pressure
- Both profitable institutional sellers and trapped long buyers create supply
- Common reaction: Price stalls, consolidates, or rejects
What Often Happens:
- Initial push into zone → Weak rejection
- Second test → Stronger rejection (trapped buyers exiting + sellers defending)
- Break above → Quick acceleration as resistance becomes support
2️⃣ FAILED AUCTION ZONES
"SELLERS TRAPPED" Labels (Below Price):
- High-volume selling that immediately reversed = maximum trapped shorts
- When price returns, trapped sellers face pressure to cover
- Typical pattern: Price approaches → Initial hesitation → Sharp bounce
"BUYERS TRAPPED" Labels (Above Price):
- High-volume buying that immediately failed = maximum trapped longs
- Price returning forces trapped buyers to exit at breakeven
- Typical pattern: Price approaches → Distribution → Rejection
3️⃣ VALUE AREA DYNAMICS
Price Outside Value Area (VAH/VAL):
- Price beyond 70% volume zone = statistical outlier
- Two outcomes: Mean reversion OR trend continuation
- Key differentiator: Presence of confluence zones
Mean Reversion Pattern (No Strong Confluence):
- Price extends 1-2% beyond VA → Typically reverts toward POC
- Weak volume on extension → Higher probability of reversal
Breakout Pattern (With ★4+ Confluence):
- Price breaks VA with institutional patterns → Often continues
- Strong volume + confluence = New value area forming
4️⃣ ICEBERG ORDER BEHAVIOR
Cyan Bars with High Hit Counts:
- Repeated volume at same level = Large hidden order absorbing
- Price typically "tests" iceberg multiple times before resolution
- Two outcomes: Absorption complete (break) OR rejection (bounce)
5️⃣ VOLUME SPIKE PATTERNS
Bright Green/Red Bars (Institutional Aggression):
- Extreme delta spikes indicate institutional entry
- Trend Continuation Spikes: Spike aligned with trend = Often continues
- Exhaustion Spikes: Spike against trend = Failed auction forming
═════════════════════════════════════════════════════════════
⚙️ CONFIGURATION GUIDE
═════════════════════════════════════════════════════════════
🎯 QUICK START
1. Select your trading style preset (Scalper/Day/Swing)
2. Enable VAH/VAL alerts in settings
3. Adjust alert sensitivity (0.1% recommended)
4. Add alert condition to TradingView alert system
📊 CORE SETTINGS
- Lookback Period: How many bars to analyze
- Scalping: 50-100 bars
- Day Trading: 100-200 bars
- Swing Trading: 200-500 bars
- Price Row Granularity: How finely to divide price
- 40-50 rows = Fast markets
- 60-80 rows = Balanced (RECOMMENDED)
- 100+ rows = Maximum precision
- Minimum Signal Strength: Filter weak signals
- ★3 = Balanced quality/quantity (RECOMMENDED)
- ★4-5 = Highest quality, fewer opportunities
🎨 VISUAL SETTINGS
- Color Theme: Classic/Institutional/Monochrome/Bold/Minimal/Custom
- Smart Coloring: ON (recommended) - Shows institutional patterns
- Transparency: Adjust profile opacity
- Column Dividers: Visual separators between columns
- POC Extensions: Show historical level significance
📈 ADVANCED FEATURES
- Auto-Hide Distance: Hide profile when price moves X% away
- Statistics Panel: Real-time metrics display
- Previous POCs: Show prior session levels
- Alert Sensitivity: How close price must be to trigger alerts
═════════════════════════════════════════════════════════════
💡 BEST PRACTICES
═════════════════════════════════════════════════════════════
✅ Start with defaults (200 lookback, 60 rows, ★3 confluence, Smart Coloring ON)
✅ Focus on POC boxes first - These are your highest-probability zones
✅ Combine with price action - Use the profile to explain WHY support/resistance exists
✅ Watch for alignment - Yellow/Orange boxes = strongest levels
✅ Respect failed auctions - "TRAPPED" labels are extreme reversal setups
✅ Use Value Area for context - Price outside VA = mean reversion opportunity
✅ Trust confluence scores - ★4-5 signals are institutional-grade setups
✅ Set up alerts for VAH/VAL touches - Don't miss key levels
✅ Check previous session POCs - Institutions defend same zones across sessions
✅ Monitor statistics panel - Understand market conviction in real-time
═════════════════════════════════════════════════════════════
🔧 TECHNICAL SPECIFICATIONS
═════════════════════════════════════════════════════════════
Calculation Method: Enhanced delta using OHLC and volume with wick ratio analysis
Update Frequency: Real-time on every bar close
Performance: Optimized with color caching and pre-calculated values (~30% faster)
Max Capacity: Supports up to 1500 bars lookback and 250 price rows
Compatibility: Works on all symbols and timeframes
Memory Usage: Efficient array management with proper initialization
Alert System: Built-in VAH/VAL touch detection with visual markers
═════════════════════════════════════════════════════════════
🎯 UNIQUE VALUE PROPOSITION
═════════════════════════════════════════════════════════════
Unlike standard Volume Profile indicators that only show where volume occurred, the IDT Auction Profile:
✅ Separates bid vs ask volume to reveal true order flow
✅ Identifies who is profitable vs who is trapped at each level
✅ Detects institutional patterns (icebergs, absorption, failed auctions)
✅ Calculates confluence scores combining multiple factors
✅ Provides clear POC boxes showing exact institutional positioning
✅ Maps positional advantage rather than just volume density
✅ Alerts you to key level touches in real-time
✅ Shows historical context with POC extensions
✅ Displays live statistics for market conviction
This transforms Volume Profile from a historical volume chart into a strategic positioning map showing institutional dominance and trapped participants.
═════════════════════════════════════════════════════════════
📖 HOW TO INTEGRATE WITH YOUR STRATEGY
═════════════════════════════════════════════════════════════
✅ PROPER USES:
- Entry refinement within your existing setups
- Intelligent stop placement beyond institutional levels
- Objective profit targets at next confluence zones
- Trade filtering (only take setups at ★4+ zones)
- Understanding market positioning before entry
- Alert-based monitoring of key support/resistance levels
❌ WHAT IT CANNOT DO:
- Predict direction with certainty
- Replace risk management
- Account for news/external events
- Guarantee profitability
- Work in all market conditions
═════════════════════════════════════════════════════════════
📚 DEVELOPMENT PATH (12-16 Weeks)
═════════════════════════════════════════════════════════════
Weeks 1-2: Observation Only
- Watch price behavior at key levels
- Document patterns without trading
- Set up alerts and observe responses
Weeks 3-8: Paper Trading
- Simulate trades, track all metrics
- Minimum 100 paper trades
- Test different confluence thresholds
Weeks 9-16: Small Size Testing
- Minimal capital, real market conditions
- Continue tracking, refine rules
- Adjust alert sensitivity based on results
After Proven Edge you could potentially include it in your set-up
═════════════════════════════════════════════════════════════
⚠️ CRITICAL DISCLAIMERS
═════════════════════════════════════════════════════════════
⚠️ Past volume ≠ Future price action
⚠️ Institutional positions change rapidly - these are static snapshots
⚠️ No indicator works 100% - risk management is mandatory
⚠️ Market conditions change - adapt your approach
⚠️ Backtest with YOUR style, YOUR timeframe, YOUR risk tolerance
⚠️ Alerts are notifications, not trade signals - you decide the action
The indicator reveals WHERE institutions are positioned and HOW they might behave. YOU decide IF, WHEN, and HOW to trade that information.
═════════════════════════════════════════════════════════════
📞 SUPPORT & UPDATES
═════════════════════════════════════════════════════════════
For questions, suggestions, or bug reports:
- Comment below the indicator
- Follow for updates and new features
- Check documentation for detailed examples
═════════════════════════════════════════════════════════════
Not financial advice. For educational and research purposes only.
