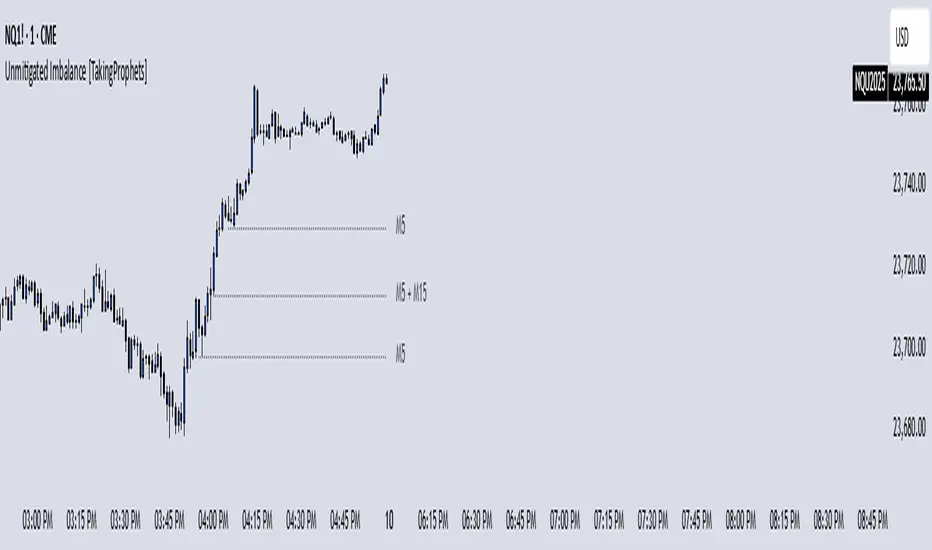
Unmitigated Imbalances [TakingProphets] (High Timeframe)Unmitigated Imbalances
Unmitigated Imbalance is designed to automatically detect and display active Fair Value Gaps (FVGs) across multiple higher timeframes and your current chart. It only keeps the ones that remain unmitigated, helping you clearly see where price has “unfinished business” and potential liquidity draw areas. The tool extends these levels forward until they are tagged according to your chosen mitigation criteria, then removes them automatically.
The indicator uses the classic 3-bar FVG structure:
– Bearish FVG forms when the low of the third candle back is above the high of the first candle.
– Bullish FVG forms when the high of the third candle back is below the low of the first candle.
– Each detected gap must meet a minimum size threshold, which is determined automatically from the Sensitivity setting and adjusted for the symbol type.
Higher timeframes (up to 4) can be plotted simultaneously with your current chart’s gaps. The script merges overlapping levels from different timeframes into one clean label, showing all the contributing timeframes together (for example: M15 + H1 + H4). This makes it easy to spot high-confluence levels without cluttering your chart.
Key features
– Multi-timeframe detection: up to 4 custom HTFs plus your current chart.
– Automatic gap size filtering based on chosen Sensitivity (High, Medium, Low).
– Choice of Wick or Close-based mitigation logic.
– Lookback control: 1 Day, 1 Week, 1 Month, or Max.
– Combined labels for overlapping gaps with clear timeframe tags.
– Separate color and style settings for each timeframe’s bullish and bearish gaps.
– Labels can be positioned Left, Right, or Center Above for maximum clarity.
– Automatic line extension until mitigation or until they exceed the lookback period.
How to use
Select your desired higher timeframes in the HTF1–HTF4 settings.
Choose the Sensitivity level to control the minimum gap size detected.
Decide on Wick or Close mitigation according to your trading rules.
Use the Lookback setting to limit how far back the script checks for gaps.
Watch for levels where multiple timeframe labels are stacked — these can carry greater significance.
Incorporate the levels into your existing strategy, using them as context rather than entry signals.
Practical notes
– Current timeframe gaps reset each trading day to keep the chart relevant to intraday bias.
– Higher timeframe gaps remain until mitigated or until the lookback period expires.
– Large lookback periods with multiple HTFs can increase chart load — adjust settings as needed.
– This indicator is a mapping and context tool, not a signal generator. Always apply it alongside your own analysis.
Educational
Bharat Jhunjhunwala - RSI Cross Trading SignalRSI Crossover Indicator
This custom indicator uses the Relative Strength Index (RSI) to generate precise buy and sell signals based on momentum shifts. The strategy works as follows:
Buy Signal: Triggered when:
The Daily RSI is above 50, indicating bullish market conditions.
The Hourly RSI crosses above 70, signaling a strong upward momentum.
Sell Signal: Triggered when:
The Daily RSI is below 50, indicating bearish market conditions.
The Hourly RSI crosses below 30, signaling potential downward momentum.
The indicator plots green up arrows for buy signals and red down arrows for sell signals, making it ideal for traders looking to trade momentum shifts with clarity.

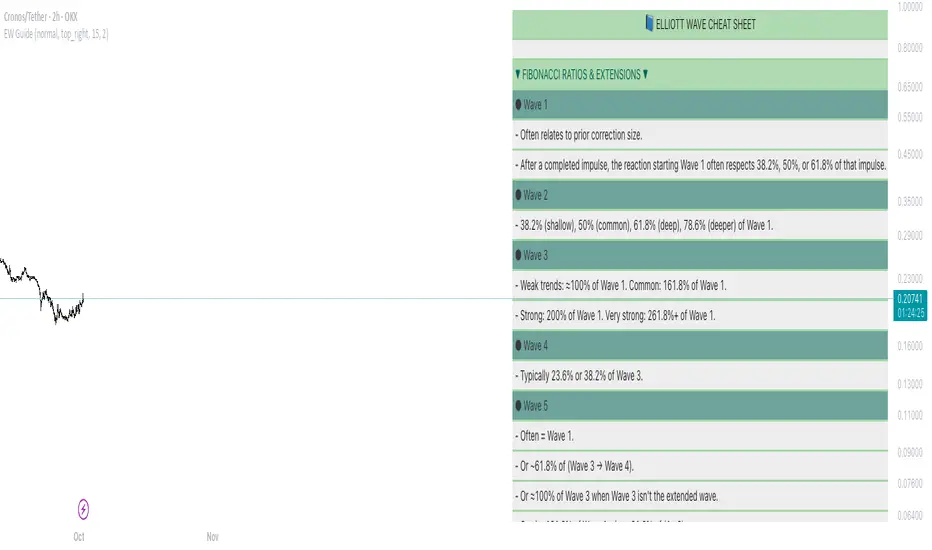
Elliot Wave Cheat SheetThis tool provides a visual cheat sheet summarizing:
Core Impulse Wave Rules
Essential Fibonacci Ratios & Guidelines
Leading and Ending Diagonals
Expanding and Contractive Diagonals
Common Corrective Patterns (Zigzag, Flats, Triangles, WXY)
Key Best Practices & Mistakes to Avoid
You can customize:
Font Size & Color
Background Color & Transparency
Show/Hide individual sections (Rules, Ratios, Corrections, etc.)
Shubh Labh - Buy Sell Signal IndicatorThe Signal created from this Indicator is merely for educational and informational purposes. Should you decide to act upon the signals posted from this Indicator, you do so at your own risk. While the Indicator has been created & the outcome has been verified to the best of our abilities, we cannot guarantee that there are no mistakes or errors. It is not intended as a substitute for professional advice. Please seek the professional advise before taking any trading / investment decision.

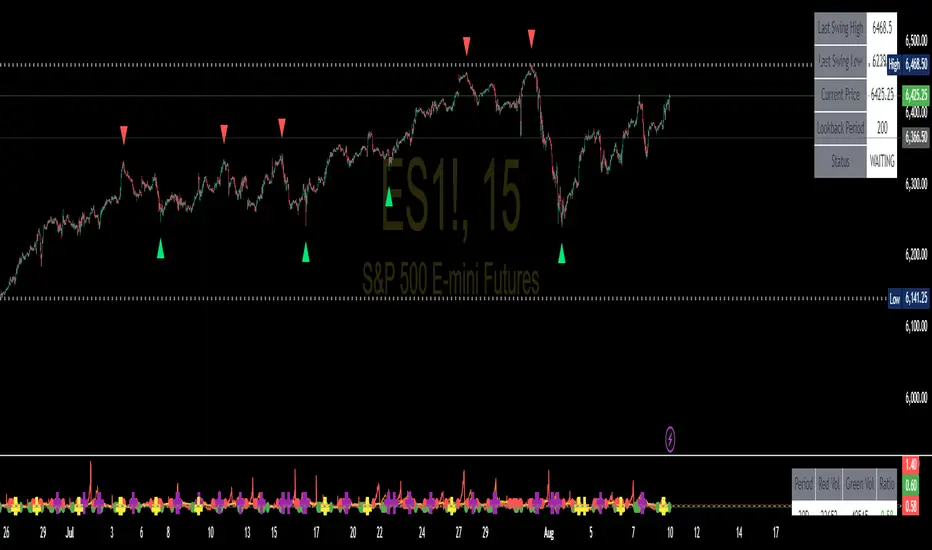
Swing High/Low SignalsSwing High/Low Signals – profit gang
Quickly spot recent market turning points with this clean swing high/low indicator.
Marks swing highs & lows with labels or triangles
Optional connecting lines & background highlights
Alerts when new swings form
Info table showing last swing levels & current price
Fully adjustable lookback period for any timeframe.
Disclaimer: For educational use only. Not financial advice.
Signal Stack MeterWhat it is
A lightweight “go or no‑go” meter that combines your manual read of Structure, Location, and Momentum with automatic context from volatility and macro timing. It surfaces a single, tradeable answer on the chart: OK to engage or Standby.
Why traders like it
You keep your discretion and nuance, and the meter adds guardrails. It prevents good trade ideas from being executed in the wrong conditions.
What it measures
Manual buckets you set each day: Structure, Location, Momentum from 0 to 2
Volatility from VIX, term structure, ATR 5 over 60, and session gaps
Time windows for CPI, NFP, and FOMC with ET inputs and an exchange‑offset
Total score and a simple gate: threshold plus a “strong bucket” rule you choose
How to use in 30 seconds
Pick a preset for your market.
Set Structure, Location, Momentum to 0, 1, or 2.
Leave defaults for the auto metrics while you get a feel.
Read the header. When it says OK to engage, you have both your read and the context.
Defaults we recommend
OK threshold: 5
Strong bucket rule: Either Structure or Location equals 2
VIX triggers: 22 and 1.25× the 20‑SMA
Term mode: Diff at 0.00 tolerance. Ratio mode at 1.00+ is available
ATR 5/60 defense: 1.25. Offense cue: 0.85 or lower
ATR smoothing: 1
Gap mode: RTH with 0.60× ATR5 wild gap. ON wild range at 0.80× ATR5
CPI window 08:25 to 08:40 ET. FOMC window 13:50 to 14:30 ET
ET to exchange offset: −60 for CME index futures. Set to 0 for NYSE symbols like SPY
Alert cadence: Once per RTH session. Snooze first 30 minutes optional
New since the last description
Parity with Defense Mode for presets, sessions, ratio vs diff term mode, ATR smoothing, RTH‑key cadence, and snooze options
Event windows in ET with a simple offset to your exchange time
Alternate row backgrounds and full color control for readability
Exposed series for automation: EngageOK(1=yes) plus TotalScore
Debug toggle to see ATR ratio, term, and gap measurements directly
Notes
Dynamic alerts require “Any alert() function call”.
The meter is designed to sit opposite Defense Mode on the chart. Use the position input to avoid overlap.

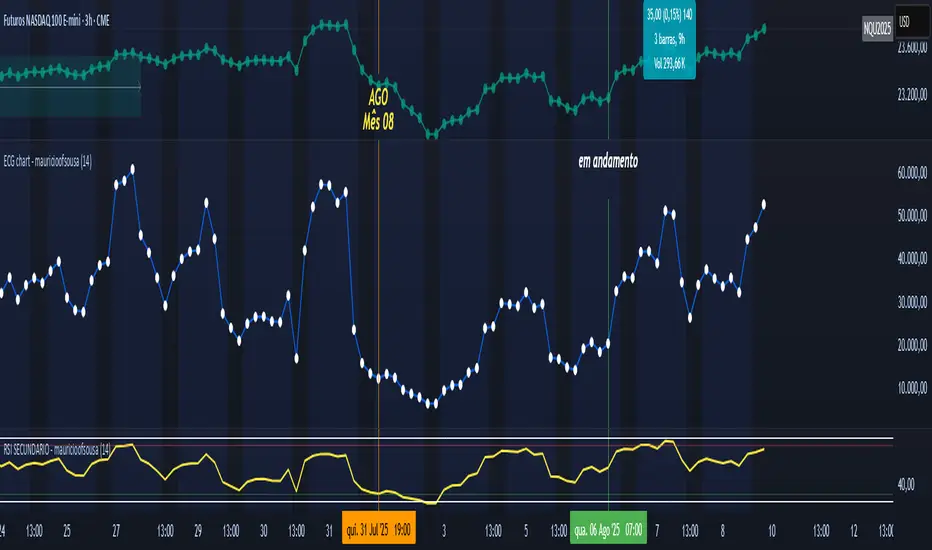
ECG chart - mauricioofsousaMGO Primary – Matriz Gráficos ON
The Blockchain of Trading applied to price behavior
The MGO Primary is the foundation of Matriz Gráficos ON — an advanced graphical methodology that transforms market movement into a logical, predictable, and objective sequence, inspired by blockchain architecture and periodic oscillatory phenomena.
This indicator replaces emotional candlestick reading with a mathematical interpretation of price blocks, cycles, and frequency. Its mission is to eliminate noise, anticipate reversals, and clearly show where capital is entering or exiting the market.
What MGO Primary detects:
Oscillatory phenomena that reveal the true behavior of orders in the book:
RPA – Breakout of Bullish Pivot
RPB – Breakout of Bearish Pivot
RBA – Sharp Bullish Breakout
RBB – Sharp Bearish Breakout
Rhythmic patterns that repeat in medium timeframes (especially on 12H and 4H)
Wave and block frequency, highlighting critical entry and exit zones
Validation through Primary and Secondary RSI, measuring the real strength behind movements
Who is this indicator for:
Traders seeking statistical clarity and visual logic
Operators who want to escape the subjectivity of candlesticks
Anyone who values technical precision with operational discipline
Recommended use:
Ideal timeframes: 12H (high precision) and 4H (moderate intensity)
Recommended assets: indices (e.g., NASDAQ), liquid stocks, and futures
Combine with: structured risk management and macro context analysis
Real-world performance:
The MGO12H achieved a 92% accuracy rate in 2025 on the NASDAQ, outperforming the average performance of major global quantitative strategies, with a net score of over 6,200 points for the year.
Risk Appetite IndexWhat This Indicator Does
The Risk Appetite Index measures market participants' willingness to take risk by analyzing multiple market factors. This indicator attempts to provide insights into overall market sentiment by combining information from different market segments into a single composite measure.
How It Works
The indicator uses a multi-factor approach that examines various aspects of market behavior including equity market conditions, interest rate environments, credit markets, volatility patterns, and other relevant market data. These factors are processed and combined to create a composite reading on a 0-100 scale.
Theoretical Foundation
The methodology is grounded in established financial theories including Modern Portfolio Theory principles for risk assessment, behavioral finance concepts regarding market sentiment cycles, and factor investing approaches for multi-dimensional market analysis. The indicator incorporates insights from academic research on market microstructure, volatility clustering phenomena, and cross-asset correlation patterns during different market regimes.
The approach draws from research on fear and greed cycles in financial markets, term structure modeling, and credit risk assessment methodologies. Statistical techniques employed include robust normalization methods and composite index construction principles established in econometric literature.
The methodology employs statistical techniques to normalize the different market inputs and reduce the impact of extreme values. The final output aims to reflect the general level of risk appetite present in financial markets.
Signal Interpretation
Values above 60 may suggest higher risk appetite conditions in markets. Values below 30 may indicate lower risk appetite environments. The 30-60 range represents neutral or mixed conditions where market sentiment may be unclear.
The indicator includes threshold levels that may help identify potential changes in market conditions. However, like all technical indicators, these levels should be considered as potential reference points rather than definitive signals.
Research Context
The approach builds upon established sentiment measurement methodologies documented in financial literature, including studies on VIX-based fear indicators, credit spread analysis, yield curve interpretation, and cross-asset momentum research. The multi-factor design reflects principles from academic research on composite economic indicators and systematic risk assessment frameworks used by central banks and institutional investors.
The threshold-based signal generation follows established precedents in quantitative finance research regarding regime detection and market state classification methodologies documented in institutional portfolio management literature.
Key Features
Analytics Dashboard: Displays real-time information about current readings, market regime assessment, and signal quality indicators.
Visual Tools: Multiple color schemes and background options to help visualize current market conditions and trends.
Alert System: Optional alerts for threshold crossings and regime changes to help monitor market conditions.
Quality Assessment: Built-in filters attempt to distinguish between higher and lower confidence readings based on data quality and market conditions.
How to Use
This indicator is designed to be used on daily timeframes and displays in a separate panel below the main chart. It works best when used as part of a comprehensive market analysis approach rather than as a standalone trading tool.
The dashboard provides additional context about current readings and may help users understand the quality and reliability of current signals. Users should consider multiple factors and conduct their own analysis when making trading decisions.
Important Considerations
This indicator is designed for educational and analytical purposes. It does not guarantee profitable trading results and should not be used as the sole basis for trading decisions.
Market conditions can change rapidly and unpredictably. Past behavior of any indicator does not predict future market movements. All trading involves substantial risk and may not be suitable for all investors.
The indicator's effectiveness may vary across different market environments and conditions. Users should consider their own risk tolerance and investment objectives when using any analytical tool.
Data Limitations
The indicator relies on multiple external data sources and may be affected by data quality, market holidays, or limited trading hours. Performance may vary during unusual market conditions or structural changes in financial markets.
Like all quantitative models, this indicator has inherent limitations and may not capture all relevant market factors or unprecedented market events.
Intended Use
This indicator may be useful for traders and analysts seeking additional tools for market sentiment analysis. It is designed for those who want to incorporate multiple market factors into their decision-making process.
Academic Research Foundation
The development approach incorporates established research methodologies from quantitative finance literature. Key theoretical frameworks include:
Factor Models: Based on research into multi-factor asset pricing models and their application to portfolio construction and risk management practices developed in academic finance literature.
Behavioral Finance: Incorporates findings from behavioral economics research on market anomalies, investor psychology, and sentiment-driven market movements as documented in financial psychology studies.
Market Microstructure: Utilizes principles from market microstructure research regarding information flow, price discovery mechanisms, and cross-market relationships established in institutional finance literature.
Risk Management: Built upon established risk measurement frameworks including Value at Risk methodologies, stress testing approaches, and systematic risk assessment techniques documented in risk management research.
Econometric Methods: Employs statistical techniques based on time series analysis, robust estimation methods, and composite index construction principles established in econometric literature and central bank research methodologies.
The proprietary methodology combines various market inputs in an attempt to provide insights into overall risk appetite trends, though results may vary and should always be considered alongside other forms of analysis.
Risk Warnings
Past performance does not guarantee future results. All trading involves substantial risk of loss. This indicator does not eliminate market risk and should be used as part of a comprehensive trading plan. Market conditions can change rapidly and unexpectedly. No indicator is accurate in all market conditions.
Technical Requirements
Optimal use on daily charts with TradingView Pro or higher for real-time data access. Designed primarily for US equity market analysis during regular trading hours.
Note: This is a closed-source indicator with proprietary calculation methods designed to maintain effectiveness and provide users with a unique analytical tool.

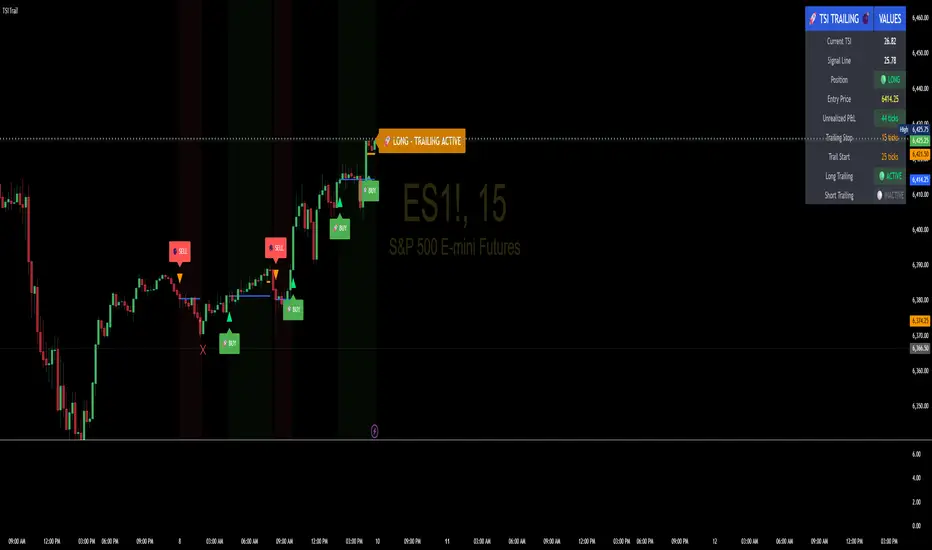
TSI Indicator with Trailing StopAuthor: ProfitGang
Type: Indicator (visual + alerts). No orders are executed.
What it does
This tool combines the True Strength Index (TSI) with a simple tick-based trailing stop visualizer.
It plots buy/sell markers from a TSI cross with momentum confirmation and, if enabled, draws a trailing stop line that “ratchets” in your favor. It also shows a compact info table (position state, entry price, trailing status, and unrealized ticks).
Signal logic (summary)
TSI is computed with double EMA smoothing (user lengths).
Signals:
Buy when TSI crosses above its signal line and momentum (TSI–Signal histogram) improves, with TSI above your Buy Threshold.
Sell when TSI crosses below its signal line and momentum weakens, with TSI below your Sell Threshold.
Confirmation: Optional “Confirm on bar close” setting evaluates signals on closed bars to reduce repaint risk.
Trailing stop (visual only)
Units are ticks (uses the symbol’s min tick).
Start Trailing After (ticks): activates the trail only once price has moved in your favor by the set amount.
Trailing Stop (ticks): distance from price once active.
For longs: stop = close - trail; it never moves down.
For shorts: stop = close + trail; it never moves up.
Exits shown on chart when the trailing line is touched or an opposite signal occurs.
Note: This is a simulation for visualization and does not place, manage, or guarantee broker orders.
Inputs you can tune
TSI Settings: Long Length, Short Length, Signal Length, Buy/Sell thresholds, Confirm on Close.
Trailing Stop: Start Trailing After (ticks), Trailing Stop (ticks), Show/Hide trailing lines.
Display: Toggle chart signals, info table, and (optionally) TSI plots on the price chart.
Alerts included
TSI Buy / TSI Sell
Long/Short Trailing Activated
Long/Short Trail Exit
Tips for use
Timeframes/markets: Works on any symbol/timeframe that reports a valid min tick. If your market has large ticks, adjust the tick inputs accordingly.
TSI view: By default, TSI lines are hidden to avoid rescaling the price chart. Enable “Show TSI plots on price chart” if you want to see the oscillator inline.
Non-repainting note: With Confirm on bar close enabled, signals are evaluated on closed bars. Intrabar previews can change until the bar closes—this is expected behavior in TradingView.
Limitations
This is an indicator for education/research. It does not execute trades, and visuals may differ from actual broker fills.
Performance varies by market conditions; thresholds and trail settings should be tested by the user.
Disclaimer
Nothing here is financial advice. Markets involve risk, including possible loss of capital. Always do your own research and test on a demo before using any tool in live trading.
— ProfitGang
Institutional level Indicator V5Smart money concept indicator with added VWAP for better understanding for fair price with relation to movement of price.

Pro Maker Prev Month Wick High/LowThis indicator plots the exact Previous Month’s Wick High & Wick Low on the chart.
Levels are fixed across all timeframes (M1 to M).
High/Low lines start exactly from the first bar of the previous month and extend to the right.
Perfect for identifying important swing points and supply/demand zones.
Features:
Auto-updates at the start of a new month.
Works on any symbol & any timeframe.
Clean dotted-line visuals with color-coded High (Red) & Low (Green).
Use case:
Quickly see where the previous month’s extreme levels were.
Combine with price action or breakout strategies for higher accuracy.
Watermark [TakingProphets] Watermark
A fully customizable watermark & chart info panel to keep your charts branded, organized, and informative — without clutter.
Special thanks to for inspiring the original concept that led to this expanded version.
📌 Overview
Perfect for:
Traders who stream, record, or share charts
Keeping essential info (symbol, TF, date, price) visible
Intraday traders who want day-of-week labels without messy vertical lines
✨ Key Features
1. Personal Watermark
Custom text, colors, size, opacity
Position anywhere: Top, Middle, Bottom × Left, Center, Right
Alignment options: left, center, right
Optional border with adjustable color or hide completely
2. Chart Info Panel
Show any combination of:
Custom text
Symbol
Timeframe (auto-formatted)
Date (MM-DD-YYYY)
Last price
Day of the week
Position independently from watermark
Adjustable background opacity
3. Day-of-Week Labels
Labels Sunday → Saturday at session start or midday
Works on intraday ≤ 15m timeframes
Option to hide weekends
Place labels Top or Bottom
⚙️ How to Use
Enable Watermark → Personal Watermark Settings → Toggle Show Watermark, enter your text, style it.
Set Up Info Panel → Chart Information Panel → Select details, choose position, adjust style.
Add Day Labels → Day of Week Labels Settings → Turn on for intraday charts.
💡 Tips
Lower background opacity for a subtle look.
Use bright colors for streaming so your brand stands out.
Hide unused features to keep charts clean & fast.
🙏 Acknowledgments
This script’s concept was inspired by toodegrees.
Developed by TakingProphets — tools for traders who value clarity, precision, and style.
⚠️ Disclaimer:
This script is for informational purposes only. It is not financial advice. Always trade responsibly and manage your risk.

Razor Precision — Buy/SellRazor Precision Stock Action Indicator
The Razor Precision indicator is an advanced, multi-layered market analysis tool designed for traders who demand accuracy and alignment across multiple timeframes. It combines price action, moving average crossovers, volume confirmation, swing structure mapping, and indicator confluence (RSI, MACD, ATR, OBV) to generate actionable buy/sell strength ratings.
Key Features:
Price Action Detection: Identifies higher highs/lows (uptrend) and lower highs/lows (downtrend).
MA Crossover Momentum: Monitors 50/200 moving average crossovers to detect trend shifts.
Volume Surge Analysis: Confirms breakouts or pullbacks with significant volume spikes.
Swing Structure Tracking: Maps internal/external breaks to align with Smart Money Concepts.
Indicator Confluence: Aggregates signals from RSI, MACD, ATR, and OBV for precision confirmation.
Multi-Timeframe Alignment: Compares trends across 15m, 1H, 4H, and Daily charts for stacked or conflicting signals.
Strength Levels: Signals range from SELL, STRONG SELL, ULTRA STRONG SELL to BUY, STRONG BUY, ULTRA STRONG BUY.
Dynamic Table Display: Updates every 5 minutes or when overall action changes, showing per-timeframe analysis and the aggregated decision.
Ideal for swing traders, scalpers, and intraday momentum players who want high-confidence trade direction filtered through multiple technical layers.

EMA band 12/60/150/200EMA band consisting of 12/60/150/200
Specifically for Indian stock market, can be used for other trading scripts after testing.
Best use case : on Daily TF.
Bull run entry criteria, Not bear market or Bottom catching.

GLD GC Price Converter Its primary function is to fetch the prices of the Gold ETF (ticker: GLD) and Gold Futures (ticker: GC1!) and then project significant price levels from one or both of these assets onto the chart of whatever instrument you are currently viewing.
Core Functionality & Features
Dual Asset Tracking: The script simultaneously tracks the prices of GLD and Gold Futures (GC).
Dynamic Price Level Projection: The script's main feature is its ability to calculate and draw horizontal price levels. It determines a "base price" (e.g., the nearest $100 level for GC) and then draws lines at specified increments above and below it. The key is that these levels are projected onto the current chart's price scale.
On-Chart Information Display:
Price Table: A customizable table can be displayed in any corner of the chart, showing the current prices of GLD and GC. It can also show the daily percentage change for GC, colored green for positive changes and red for negative ones.
Last Price Label: It can show a label next to the most recent price bar that displays the current prices of both GLD and GC.
Extensive Customization: The user has significant control over the indicator's appearance and behavior through the settings panel.
This includes:
Toggling the display for GLD and GC levels independently.
Adjusting the multiplier for the price levels (e.g., show levels every $100 or $50 for GC).
Changing the colors, line styles (solid, dashed, dotted), and horizontal offset for the labels.
Defining the number of price levels to display.
Controlling the text size for labels and the table.
Choosing whether the script updates on every tick or only once per candle close for better performance.

Adaptive Correlation Engine (ACE)🧠 Adaptive Correlation Engine (ACE)
Quantify inter-asset relationships with adaptive lag detection and actionable insights.
📌 What is ACE?
The Adaptive Correlation Engine (ACE) is a precision tool for seeking to uncover meaningful relationships between two assets — not just raw correlation, but also lag dynamics, leader detection, and alignment vs. divergence classification.
Unlike static correlation tools, ACE intelligently scans multiple lag windows to find:
✅ The maximum correlation between the base asset and a comparison symbol
⏱️ The optimal lag (if any) at which the correlation is strongest
🧭 Whether the assets are Aligned (positive correlation) or Divergent (inverse)
🔁 Which symbol is leading, and by how many bars
📈 Actionable signal strength based on a user-defined correlation threshold
⚙️ How It Works
Correlation Scan:
For each bar, ACE checks the correlation between the charted asset (close) and a lagged version of the comparison asset across a sliding window of lookback periods.
Lag Optimization:
The engine searches from lag 0 up to your specified Max Lag to find where the correlation (positive or negative) is most significant.
Relationship Classification:
The indicator classifies the relationship as:
Aligned: Positive correlation above the threshold
Divergent: Negative correlation above the threshold
Synchronous: No lag detected
Low Signal: Correlation is weak or noisy
Visual & Tabular Insights:
ACE plots the highest detected correlation on the chart and shows an insight table displaying:
- Correlation value
- Detected lag
- Direction type (aligned/divergent)
- Leading asset
- Suggested action (e.g., “Likely continuation” or “Possible mean reversion”)
💡 How to Use It
Use ACE to identify leadership patterns between assets (e.g., ETH leads altcoins, SPX leads crypto, etc.)
Spot potential lagging trade setups where one asset’s move may soon echo in another
Confirm or challenge correlation-based trading assumptions with data
Combine with technical indicators or price action to time entries and exits more confidently
🔔 Alerts
Built-in alerts notify you when correlation strength crosses your actionable threshold, classified by alignment or divergence.
🛠️ Inputs
Compare Symbol: The asset to compare against (e.g., INDEX:ETHUSD)
Correlation Lookback: Rolling window for calculating correlation
Max Lag Bars: Maximum lag shift to test
Minimum Actionable Correlation: Signal threshold for trade-worthy insights
⚠️ Disclaimer
This tool is for research and informational purposes only. It does not constitute financial advice or a trading signal. Always perform your own due diligence and consult a financial advisor before making investment decisions.

ORB Scalp setup on 15min by UnenbatThis indicator draws a 2-minute Opening Range Box (ORB) at the beginning of each 15-minute candle by combining the last minute of the previous candle and the first minute of the current one. It highlights the session high/low during this range, and extends the box for a customizable duration. TP and BE lines are also plotted above/below the range for strategic planning. Perfect for scalpers using 15-minute timeframe.

RATIO TPI SOLETH | JeffreyTimmermansSOLETH Ratio Trend Probability Indicator
Medium-Term Trend Assessment | Dominant Major Detector: The SOLETH Ratio TPI is a medium-term trend-following tool designed to measure the performance relationship between Solana and Ethereum — two of the leading smart contract platforms in the crypto market. By tracking the SOLETH ratio, this indicator determines which of the two is acting as the dominant major in the current market environment.
Rather than focusing on absolute price movements, the SOLETH Ratio TPI isolates relative strength. An upward-trending ratio means Solana is outperforming Ethereum, while a downward trend means Ethereum is taking the lead.
Key Features
Dominant Major Identification:
The indicator’s primary function is to determine leadership between Solana and Ethereum:
SOL Dominant: SOLETH ratio trending up
ETH Dominant: SOLETH ratio trending down
Neutral: No clear leader
8 Trend-Following Inputs:
Integrates 8 carefully selected medium-term trend-following signals into a composite score for clarity and accuracy in dominance detection.
Score-Based Regime Classification:
Score > 0.1 → SOL in relative uptrend → Dominant Major: SOL
Score < -0.1 → ETH in relative uptrend → Dominant Major: ETH
Between -0.1 and 0.1 → Neutral → No clear dominance
Dynamic Visual Interface:
Background colors change according to the dominant asset.
Bottom dashboard displays the status of all inputs, the composite score, and the determined dominance label.
Use Cases:
Smart Contract Sector Rotation: Identify leadership shifts between Solana and Ethereum to guide allocation within the L1 ecosystem.
Sector Sentiment Insight: Dominance changes often precede broader capital flows into or out of each ecosystem.
Multi-Timeframe Confirmation: Combine with broader market LTPI and MTPI tools to reinforce conviction in rotation-based strategies.
Conclusion
The SOLETH Ratio TPI condenses the competition between two of crypto’s top smart contract platforms into one clear, actionable view. By aggregating 8 powerful medium-term trend-following inputs, it delivers a precise assessment of which chain currently leads the market.

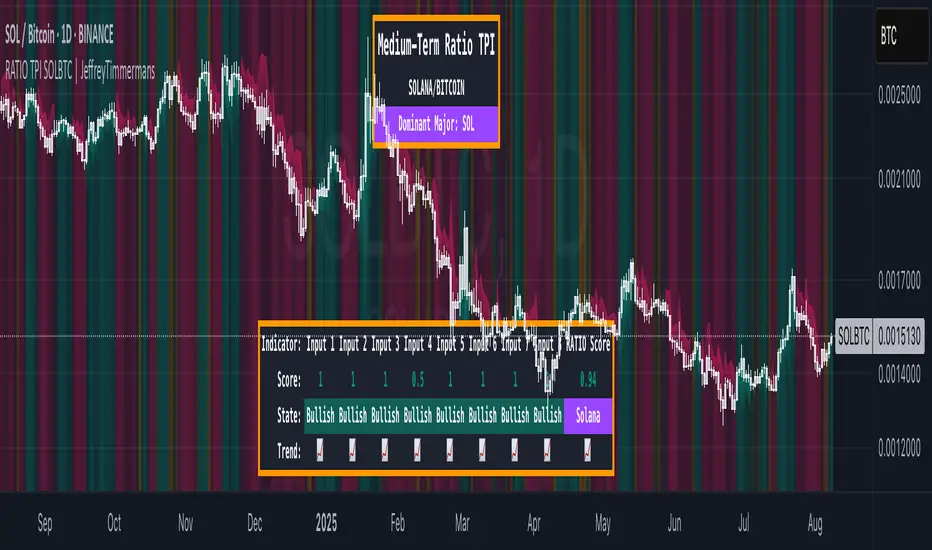
RATIO TPI SOLBTC | JeffreyTimmermansSOLBTC Ratio Trend Probability Indicator
Medium-Term Trend Assessment | Dominant Major Detector: The SOLBTC Ratio TPI is a medium-term trend-following indicator designed to measure the relative strength between Solana and Bitcoin — two of the most influential assets in the crypto market. By analyzing the SOLBTC ratio, this tool identifies which of the two is currently the dominant major in the market cycle.
Unlike standard price-based analysis, this indicator focuses on relative dominance. When Solana outperforms Bitcoin, the ratio trends upward, signaling SOL dominance. When Bitcoin outperforms Solana, the ratio trends downward, signaling BTC dominance.
Key Features
Dominant Major Identification:
The primary goal of this TPI is to determine whether Solana or Bitcoin is leading the market:
SOL Dominant: SOLBTC is trending up
BTC Dominant: SOLBTC is trending down
Neutral: No clear leader in the current cycle
8 Trend-Following Inputs:
Combines 8 carefully selected medium-term trend-following indicators into a single composite score for clear and actionable dominance detection.
Score-Based Regime Classification:
Score > 0.1 → SOL in relative uptrend → Dominant Major: SOL
Score < -0.1 → BTC in relative uptrend → Dominant Major: BTC
Between -0.1 and 0.1 → Neutral → No clear dominance
Dynamic Visuals:
Background colors shift to match the dominant asset
Bottom dashboard displays the state of each input, the composite score, and the resulting dominance label
Use Cases:
Rotation Strategies: Identify when capital is rotating between Solana and Bitcoin to optimize positioning.
Market Leadership Signals: Use dominance changes as a leading indicator for broader altcoin cycles and sentiment shifts.
Multi-Timeframe Confirmation: Pair with LTPI and STPI for higher conviction in directional bias.
Conclusion
The SOLBTC Ratio TPI distills the relationship between Solana and Bitcoin into one simple question: Who is leading right now? By combining 8 powerful trend-following inputs into a clear dominance score, it provides traders and investors with a precise, medium-term view of market leadership.
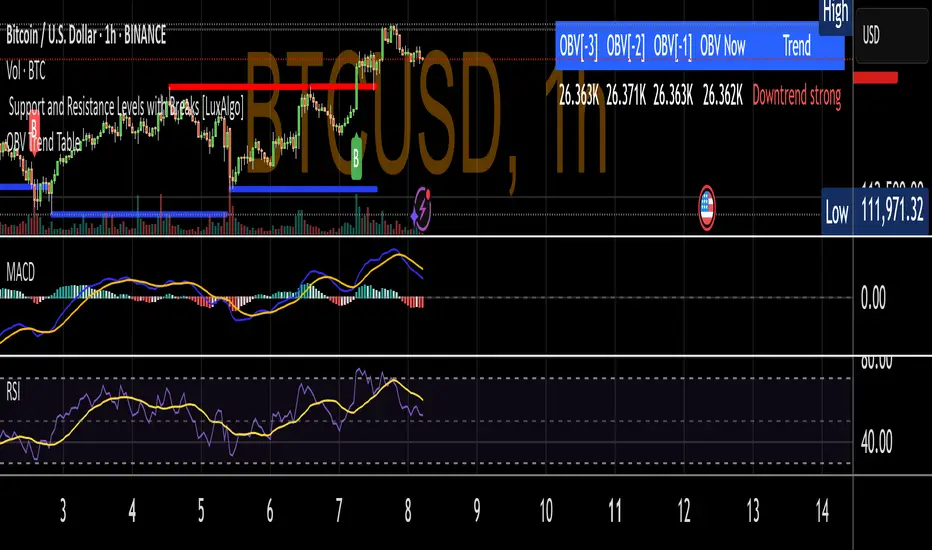
OBV Trend TableDisplays last 3 TF OBV values and current value of OBV. Also displays one of the trend values
- Uptrend healthy (price ↑ + OBV ↑)
- Downtrend strong (price ↓ + OBV ↓)
- Early reversal (price and OBV diverge)
- No clear trend (flat or mixed)
Turtle Trading System IndicatorKey Features & Components
Donchian Channels
The core of the indicator is the Donchian Channel, represented by the upper and lower blue bands.
Upper Channel: The highest price over a user-defined period.
Lower Channel: The lowest price over the same period.
Middle Line: The midpoint between the upper and lower channels.
These channels are used to identify potential breakouts, which form the basis for trade entries.
Trading Signals
The script automatically generates clear, non-repainting signals for potential trades:
Long Entry (Green ▲): A green upward-facing triangle appears below the candle when the closing price breaks above the upper Donchian channel, signaling the start of a potential uptrend.
Short Entry (Red ▼): A red downward-facing triangle appears above the candle when the closing price breaks below the lower Donchian channel, signaling the start of a potential downtrend.
Long Exit (Green X): A green cross appears above the candle when the price crosses below the middle line, suggesting the uptrend is weakening.
Short Exit (Orange X): An orange cross appears below the candle when the price crosses above the middle line, suggesting the downtrend is losing momentum.
Integrated Risk Management
A crucial element of the Turtle strategy is disciplined risk management, which is built into this indicator.
Volatility-Based Position Sizing
You can enable position sizing that adapts to market volatility using the Average True Range (ATR). When an entry signal occurs, a label appears showing a calculated position size unit. The formula aims to normalize risk, meaning you would trade smaller sizes in volatile markets and larger sizes in calmer markets. The formula used is:
Volatility Unit=
100
Risk %
×
4×ATR
Close Price
Dynamic Stop Loss
Upon a long or short entry, a stop-loss level is plotted on the chart as red circles. This level is calculated based on the ATR, automatically adjusting to the market's current volatility to provide a data-driven exit point for managing losses. It is calculated as:
Long Stop: Close Price - 1.8 * ATR
Short Stop: Close Price + 1.8 * ATR
On-Chart Information Panel
A convenient table is displayed in the bottom-right corner of the chart, showing the current ATR value and the calculated Position Size unit for quick and easy reference.
Customizable Settings
You can tailor the indicator to your specific strategy and risk tolerance:
Donchian Channel Period: Sets the lookback period for the channels. The default is 20. Shorter periods will be more sensitive and generate more signals.
ATR Period: Sets the lookback period for the Average True Range calculation, affecting both position size and stop-loss levels. The default is 14.
Risk Percentage: The percentage of equity you wish to risk per trade. This directly influences the position size calculation.
Use Volatility Position Sizing: A simple checkbox to turn the ATR-based position sizing on or off.

Multi-Length Quad Bollinger BandsHere is a Pine Script code for TradingView that plots four separate Bollinger Bands on your chart. The lengths are preset to 14, 50, 100, and 200, but every aspect—including lengths, standard deviations, colors, and the source price—is fully customizable through the script's settings menu.
The 14 and 50-period bands are enabled by default, while the 100 and 200-period bands are disabled to keep the chart clean initially. You can easily toggle any of them on or off.
