指数移動平均 (EMA)
EMA50Diff & MACD StrategyOne of my attempts to create a strategy for BTC.
Its a combination of EMA50Diff (the difference between spot and EMA50) and MACD.
Buy signal if (EMA50Diff) < -(EMADiffThreshold),
(MACD bearish crossunder),
(MACD) < -(MACDThreshold),
(EMA50Diff) > (EMA50Diff 1 candle ago),
(EMA50Diff 1 candle ago) < (EMA50Diff 2 candles ago)
Sell signal if (EMA50Diff) > (EMADiffThreshold),
(MACD bullish crossover),
(MACD) > (MACDThreshold),
(EMA50Diff) < (EMA50Diff 1 candle ago),
(EMA50Diff 1 candle ago) > (EMA50Diff 2 candles ago)
Exit either when target or stoploss get reached.
Initial capital is set to 100k and its currently going all-in on every trade but im looking for a better way to handle position sizes already..
Also i included slippage of 30 ticks and exchange commission of 0.15% (e.g. 2x BitMEX market taker fee)
Works best on 15m on bitfinex, bitstamp and gdax and i'm still trying to optimize it for bitmex too, will update when i got there..

Simple Fibonacci EMA StrategyThis script gives a buy signal when the 21 EMA crosses above the 55 EMA and a sell signal when the 55 EMA crosses below the 21 EMA. This strategy works well for cryptocurrencies at all time frames. However, it does not work for stocks or forex. Sometimes, the simple strategies are the best strategies, especially in markets that have not been dominated by institutions.
When editing how much of your balance to trade, attach at least one decimal place. For instance, 12.0, 90.0, and 83.3 would work, but 100, 32, or 70 does not work.

The Falcon v2 Long only strategy Using Stop loss and take profitHello,
Here is a backtest result from the beginning of the year on BTC. The white line is the Buy & Hold return.
Comission is set to 0.05% and there is no repainting : the price variable I'm using is heikenashi(tickerid).
The indicator is built upon RSI, EMAs and some other personnal tricks so predict trends.
I coded a stop loss and take profit system : the script will simply buy and sell upon conditions.
As usual I am selling access to the script, If some are interested I will publish an alert setup version. I am also open to development or reverse engineering commissions.

WhenMewn 2.0When Mewn works best on 1 hour charts.
Green Highlight= Strong Buy
Green Crosses = Support
Red Highlight is a Sell
Red Crosses = Resistance


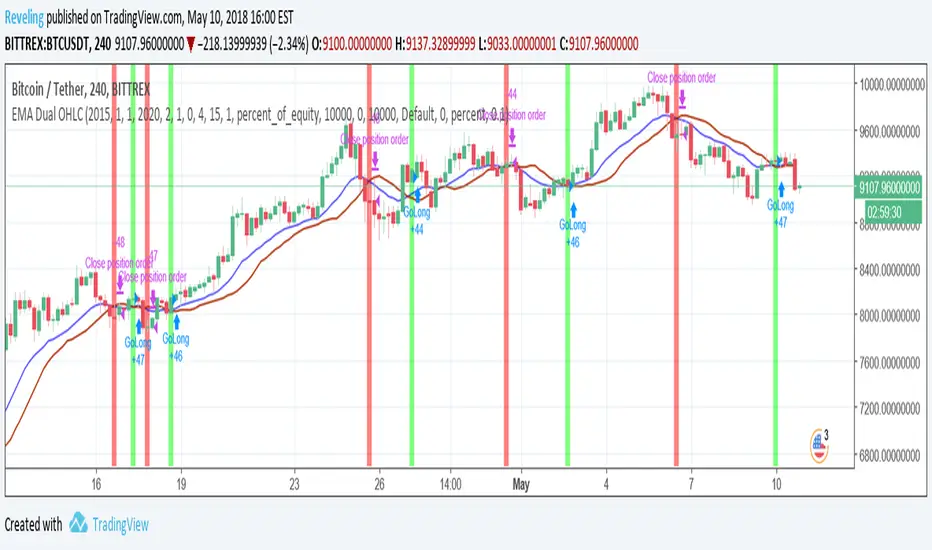
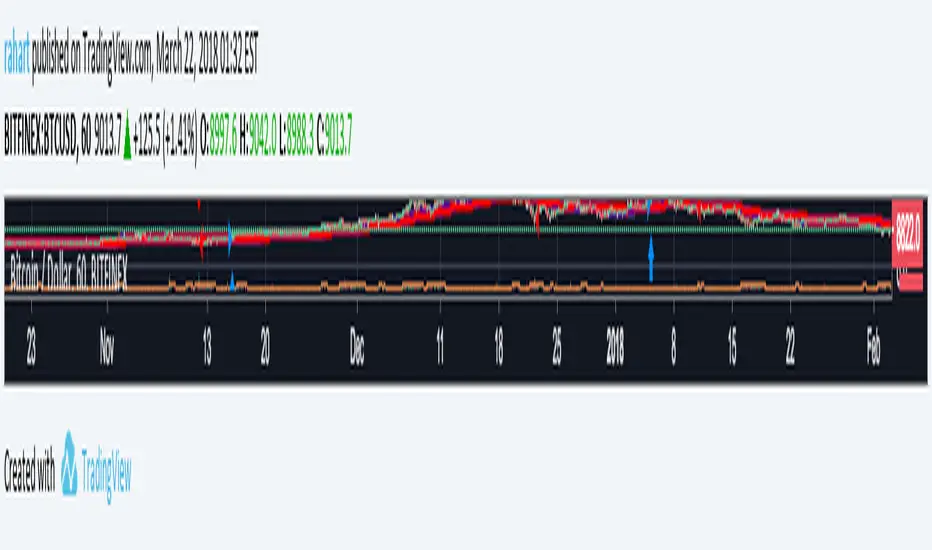
Long Term Swing Position Indicator Alpha VersionThis is a early version of a swing trading indicator I have been working on. It uses EMAs and ADX to find entries. This will eventually be integrated into my main trading indicator. The strategy is defaulted to start with 17,000 capital and trade with 100 percent of equity. You can test different ranges of dates by going into the settings and changing the end dates of the backtest. It is defaulted to test from 1/1/2018 to the current time. Keep in mind if you keep it set to use 100% equity it will not be able to enter positions if the initial capital is less than the price of 1 bitcoin -3.31% at the beginning of the test range. It currently has a pretty low success rate, but the average winning trade is significantly larger than the average losing trade so it still makes a significant profit. This has only been tested so far on the 15 minute and 30 minute charts for Bitfinex:BTCUSD.
The end goal for this indicator is to allow me to enter long term future positions to hold while I trade swaps on the short and medium term. This will allow me to increase profits.
This strategy will be changing significantly in the future as I test various ideas and setting configurations to maximize the effectiveness, but feel free to use it however you want.
My main indicator is currently in beta and will be finished before this one is completed, so if you want a solid indicator to trade with in the immediate future, I suggest checking that one out at
Please comment or direct message me if you have any questions of critiques, I will always respond within 24 hours. If you find out anything interesting while testing the strategy I would also appreciate it if you dropped me a message letting me know.


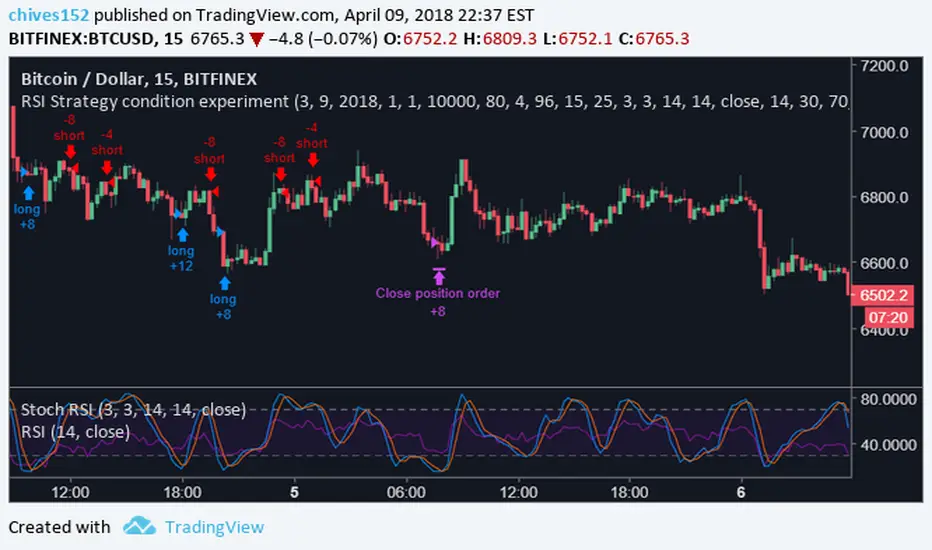
RSI Strategy condition experimentThis is a scalping indicator built for bitcoin on the 15m chart. It uses ADX and SRSI. A full indicator will be released very soon. Please comment with any questions or comments. The strategy ran below is the results if you started trading on 3/9/2018 with 10,000$ usd, and used 100% of your equity to enter positions. This is also designed to allow 2x leverage when certain conditions are met, which is the default. This feature can be turned off in settings.
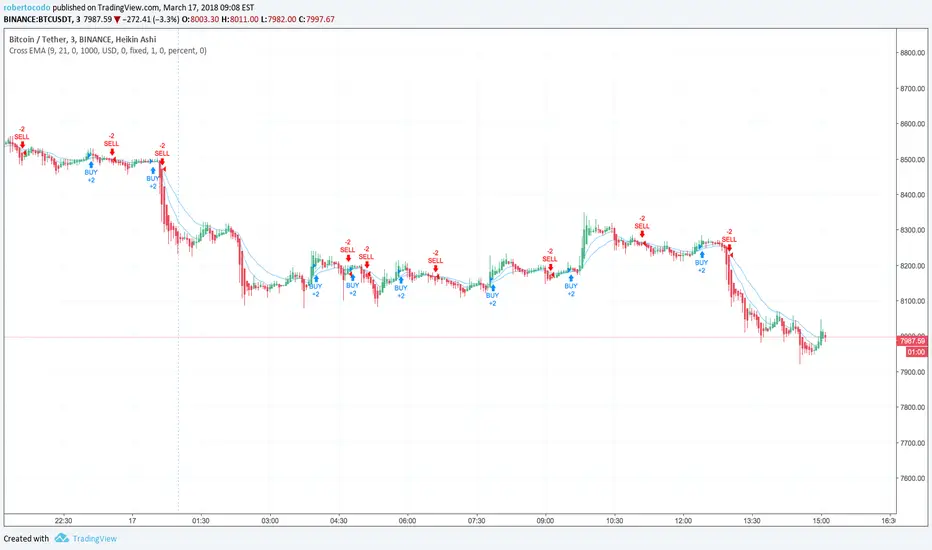
The Falcon - My BTC/USDT Strategy 5 min UTHello,
I made a custom indicator, I called it The Falcon because it reacts quickly and knows how to take perspective of the market.
This kind of indicator can be used for manual trading or bots.
About the indicator
In short, it will help you :
Make profit when the market is in trading range
Get in/Get out when a rally begins
Never go against the trend
I based my algorithm on several technical tools such as RSI , emas , for a total of 3 boolean conditions mixed together with AND and OR gates, resulting in those entry/exit points (arrows).
About the Strategy
I only used long entries and exits. No shorting.
It is tested on the last 18 days (the maximum TradingView allows for a 5 min range)
I set a 0.05% commission on each order.
I will grant access to people willing to make a small donation.
Here is my BTC address : 19sVQvCDmVfEACq7BiMnWSMqFPZ8qfSQ2K
If you prefer ETH : 0xc8a5d3a63a05db0c2363ea1c08b37a01cce9ebfb
Send me a Private Message with the ID of the transaction
If you want to do some forward testing first, send me a message.
This script comes with an Alert Setup.
I am also taking commissions if you want me to code something for you, or do some reverse engineering.
Also you can ask me anything in the comments.
Thanks and see you next time !

Pivoted EMAThis strategy checks if we have a low pivot above the EMA (48) line. If so it enters a long trade with a stop loss set to EMA - an additional gap.
This is reversed for Short trades: high pivot bellow the EMA, and SL set to EMA + gap.
The EMA gap for SL can be set individually for Short and Long positions. Backtests reveal that short positions need higher EMA SL gap that long positions.
The red lines above/bellow the candles during open trades are SL prices. The lines are invisible and the prices are gray in the list above the chart when not in active Trade. If the SL line is set equal to the EMA price the line appears as purple because they are both semi transparent. (this is the case for long trades in the current settings used in displaying this strategy).

SW SVE - Stochastic+Vol+EMAs [Sergio Waldoke]Script created by Sergio Waldoke (BETA VERSION v0.5, fine tuning PENDING)
Stochastic process is the main source of signals, reinforced on buying by Volume. Also by Golden Cross.
Selling is determined by K and D entering overselling zone or EMA's Death Cross signal, the first occurring,
and some other signals combined.
Buy Long when you see a long buy arrow.
Sell when you see a close arrow.
This is a version to be tuned and improved, but already showing excelent results after tune some parameters
according to the kind of market.
Strategy ready for doing backtests.

Buy and Sell Signals using EMA, Stochastic and PivotsBuy and Sell Signals using EMA, Stochastic and Pivots
Programmed to best work for short-term strategies.
Less number of signals but more accurate.
Works best on the Hourly chart with Stocks in an uptrend.
Results are tested using an initial capital of 1000.
Disclosure : I have not tested it on many stocks. Hence, please let me know your feedback so I may improvise it.

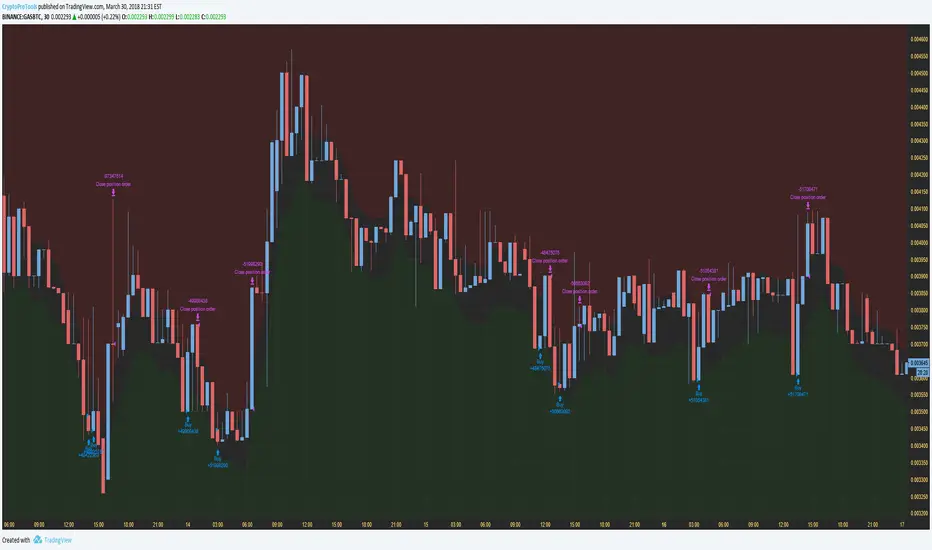
EMAGAIN Strategy FREE - CryptoProToolsSet Buy and Sell triggers based on the EMAGain indicator.
Strategy version for backtesting

Kozlod - 3MA strategy with SL/PT (7 MA types)Classic 3 MA strategy.
Long - Short MA crossover Medium MA and cross is above Long MA
Short - Short MA crossunder Medium MA and cross is below Long MA
You can choose one of these MA types in params:
Simple Moving Average ( SMA )
Exponential Moving Average ( EMA )
Weighted Moving Average ( WMA )
Hull Moving Average ( HMA )
Volume-weighted Moving Average ( VWMA )
Smoothed Moving Average ( SMMA )
Double Exponential Moving Average ( DEMA )
You can select SL/PT % levels.


Vegas Wave StrategyA quickly put together strat for the Vegas Wave. Buy and sell currently wait until the crossover or twist of the 233 and 144 EMAs and price action below the wave. This can be probably be fixed to sell faster but I'm feeling lazy.
My BTC/USDT 45min Ichimoku Strat v2Improved last version by adding a RSI derivative condition, which is very effective for spotting sheep herd moves, and follow them asap.
[Strategy] CoinDog - colored bars, RSI & EMA buy entry - v0.2Proof of Concept for algorithmic trading with Cryptocurrencies.
Could be used manually as swiss knife for trading or as automatic trading system for trade automation.
Main features:
has collored candle bars
draws main MAs - EMA for 10, 20, 60, SMA for 200
draws custom Boilinger Bands
draws RSI undersold, overbought
draws price change more then delta
draws volume change more then delta and xyz BTC
