Dwaggy Scalping Trio (VWAP + EMA + RSI)First attempt at pine script this is a scalping indicator that combines VWAP, EMA, and RSI to signal entry/exit for scalping lower time frames
Forecasting

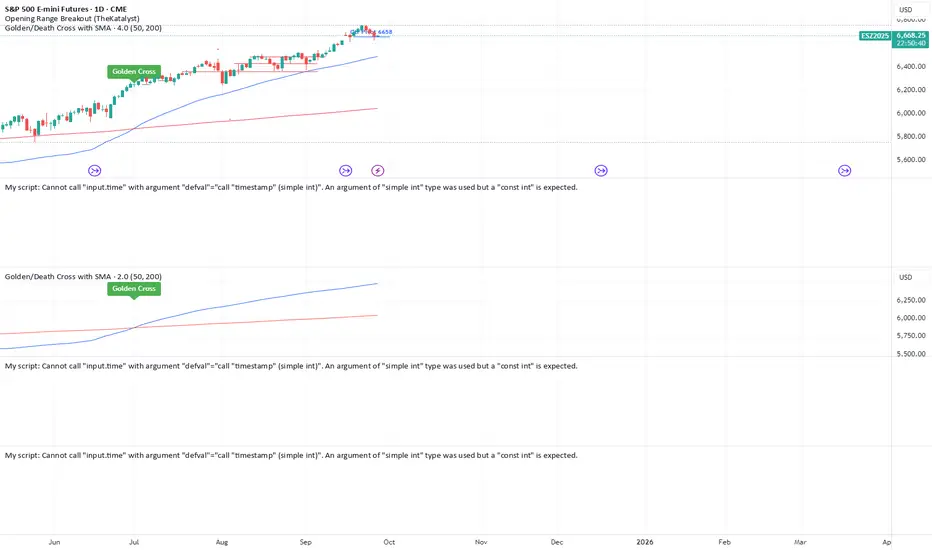
Golden/Death Cross with SMAGolden Cross: Triggered when the 50 SMA crosses above the 200 SMA.
Death Cross: Triggered when the 50 SMA crosses below the 200 SMA.
Estimated Manipulation Movement Signal [AlgoPoint]Follow the Footprints of Whale Movements That Drive the Market
Overview
The market is not always driven by natural supply and demand. Large players—often called "whales" or institutions—can create artificial price movements to trigger stop-losses, induce panic or FOMO, and build their large positions at favorable prices. These events are known as "stop hunts" or "liquidity grabs."
The EMMS indicator is a specialized tool designed to detect these specific moments of potential market manipulation. It does not follow trends in a traditional sense; instead, it identifies high-probability reversal points created by the calculated actions of Smart Money trapping other market participants.
How It Works: The 3-Module Logic
The indicator uses a multi-stage confirmation process to identify a potential stop hunt:
1. Anomaly Detection: The engine first scans the chart for "Anomaly Candles." These are candles with unusually high volume and a very long wick relative to their body. This combination signals a sudden, forceful, and potentially unnatural price push.
2. Liquidity Zone Detection: The indicator automatically identifies and tracks recent significant swing highs and lows. These levels are considered "Liquidity Zones" because they are areas where a large number of stop-loss orders are likely clustered. These are the "hunting grounds" for whales.
3. The Stop Hunt Signal: A final signal is generated only when these two events align in a specific sequence:
An Anomaly Candle (high volume, long wick) spikes through a previously identified Liquidity Zone.
The same candle then reverses, closing back inside the previous price range.
This sequence confirms that the move was likely a "trap" designed to engineer liquidity, and a reversal in the opposite direction is now highly probable.
How to Interpret & Use This Indicator
BUY Signal: A BUY signal appears after a sharp price drop that pierces a recent swing low (taking out the stops of long positions) and then aggressively reverses to close higher. This suggests that Smart Money has absorbed the panic selling they just induced. The signal indicates a potential move UP.
SELL Signal: A SELL signal appears after a sharp price spike that pierces a recent swing high (taking out the stops of short positions) and then aggressively reverses to close lower. This suggests that Smart Money has sold into the FOMO buying they just created. The signal indicates a potential move DOWN.
This indicator is best used as a high-probability confirmation tool, ideally in conjunction with your understanding of the overall market trend and structure.

Take Profit CalculatorRelease Notes: Take Profit Calculator v1.0
Introduction
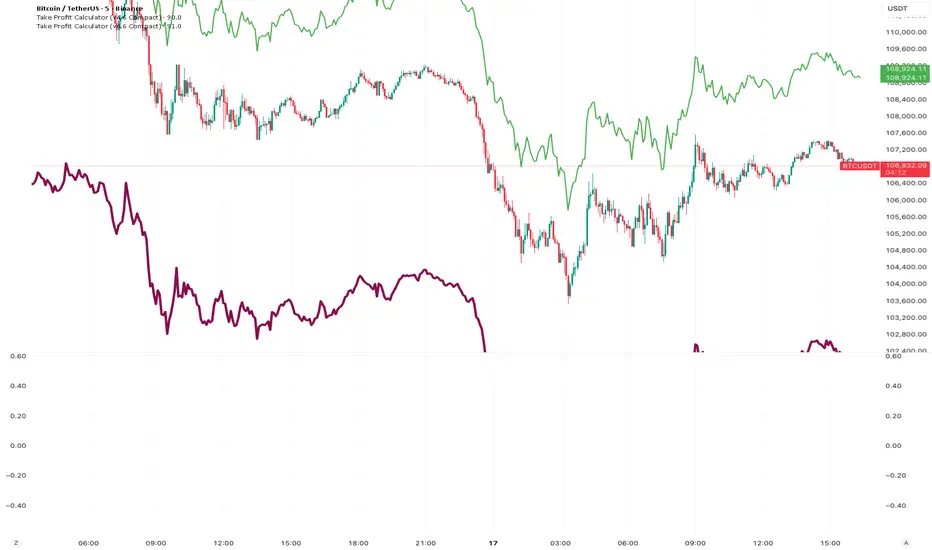
Introducing the Real-Time Take Profit Calculator, a dynamic tool for TradingView designed to instantly calculate and display your target exit price. This indicator eliminates the need for manual calculations, allowing scalpers and day traders to see their profit targets directly on the chart as the market moves.
Key Features
Dynamic Target Calculation: The take-profit line is not static. It recalculates on every tick, moving with the current price to show you the exact target based on a real-time entry point.
Full Trade Customization:
Margin: Set the amount of capital (in USDT) you are allocating to the trade.
Leverage: Input your desired leverage to accurately calculate the total position size.
Desired Profit: Specify your target profit in USDT, and the indicator will calculate the corresponding price level.
Long & Short Support: Easily switch between "Long" and "Short" trade directions. The indicator will adjust the calculation and the visual style accordingly.
Customizable Display:
Change the color and width of the take-profit line for both long and short scenarios.
Toggle a price label on or off for a cleaner chart view.
How to Use
Add to Chart: Apply the "Take Profit Calculator" indicator to your chart.
Open Settings: Double-click the indicator name or the line itself to open the settings panel.
Enter Your Parameters: Under "Trade Parameters," fill in your Margin, Leverage, and Desired Profit.
Select Direction: Choose either "Long" or "Short" from the Trade Direction dropdown.
Analyze: The horizontal line on your chart now represents the exact price you need to reach
Foresight Cone (HoltxF1xVWAP) [KedArc Quant]Description:
This is a time-series forecasting indicator that estimates the next bar (F1) and projects a path a few bars ahead. It also draws a confidence cone based on how accurate the recent forecasts have been. You can optionally color the projection only when price agrees with VWAP.
Why it’s different
* One clear model: Everything comes from Holt’s trend-aware forecasting method—no mix of unrelated indicators.
* Transparent visuals: You see the next-bar estimate (F1), the forward projection, and a cone that widens or narrows based on recent forecast error.
* Context, not signals: The VWAP option only changes colors. It doesn’t add trade rules.
* No look-ahead: Accuracy is measured using the forecast made on the previous bar versus the current bar.
Inputs (what they mean)
* Source: Price series to forecast (default: Close).
* Preset: Quick profiles for fast, smooth, or momentum markets (see below).
* Alpha (Level): How fast the model reacts to new prices. Higher = faster, twitchier.
* Beta (Trend): How fast the model updates the slope. Higher = faster pivots, more flips in chop.
* Horizon: How many bars ahead to project. Bigger = wider cone.
* Residual Window: How many bars to judge recent accuracy. Bigger = steadier cone.
* Confidence Z: How wide the cone should be (typical setting ≈ “95% style” width).
* Show Bands / Draw Forward Path: Turn the cone and forward lines on/off.
* Color only when aligned with VWAP: Highlights projections only when price agrees with the trend side of VWAP.
* Colors / Show Panel: Styling plus a small panel with RMSE, MAPE, and trend slope.
Presets (when to pick which)
* Scalp / Fast (1-min): Very responsive; best for quick moves. More twitch in chop.
* Smooth Intraday (1–5 min): Calmer and steadier; a good default most days.
* Momentum / Breakout: Quicker slope tracking during strong pushes; may over-react in ranges.
* Custom: Set your own values if you know exactly what you want.
What is F1 here?
F1 is the model’s next-bar fair value. Crosses of price versus F1 can hint at short-term momentum shifts or mean-reversion, especially when viewed with VWAP or the cone.
How this helps
* Gives a baseline path of where price may drift and a cone that shows normal wiggle room.
* Helps you tell routine noise (inside cone) from information (edges or breaks outside the cone).
* Keeps you aware of short-term bias via the trend slope and F1.
How to use (step by step)
1. Add to chart → choose a Preset (start with Smooth Intraday).
2. Set Horizon around 8–15 bars for intraday.
3. (Optional) Turn on VWAP alignment to color only when price agrees with the trend side of VWAP.
4. Watch where price sits relative to the cone and F1:
* Inside = normal noise.
* At edges = stretched.
* Outside = possible regime change.
5. Check the panel: if RMSE/MAPE spike, expect a wider cone; consider a smoother preset or a higher timeframe.
6. Tweak Alpha/Beta only if needed: faster for momentum, slower for chop.
7. Combine with your own plan for entries, exits, and risk.
Accuracy Panel — what it tells you
Preset & Horizon: Shows which preset you’re using and how many bars ahead the projection goes. Longer horizons mean more uncertainty.
RMSE (error in price units): A “typical miss” measured in the chart’s currency (e.g., ₹).
Lower = tighter fit and a usually narrower cone. Rising = conditions getting noisier; the cone will widen.
MAPE (error in %): The same idea as RMSE but in percent.
Good for comparing different symbols or timeframes. Sudden spikes often hint at a regime change.
Slope T: The model’s short-term trend reading.
Positive = gentle up-bias; negative = gentle down-bias; near zero = mostly flat/drifty.
How to read it at a glance
Calm & directional: RMSE/MAPE steady or falling + Slope T positive (or negative) → trends tend to respect the cone’s mid/upper (or mid/lower) area.
Choppy/uncertain: RMSE/MAPE climbing or jumping → expect more whipsaw; rely more on the cone edges and higher-TF context.
Flat tape: Slope T near zero → mean-revert behavior is common; treat cone edges as stretch zones rather than breakout zones.
Warm-up & tweaks
Warm-up: Right after adding the indicator, the panel may be blank for a short time while it gathers enough bars.
Too twitchy? Switch to Smooth Intraday or increase the Residual Window.
Too slow? Use Scalp/Fast or Momentum/Breakout to react quicker.
Timeframe tips
* 1–3 min: Scalp/Fast or Momentum/Breakout; horizon \~8–12.
* 5–15 min: Smooth Intraday; horizon \~12–15.
* 30–60 min+: Consider a larger residual window for a steadier cone.
FAQ
Q: Is this a strategy or an indicator?
A: It’s an indicator only. It does not place orders, TP/SL, or run backtests.
Q: Does it repaint?
A: The next-bar estimate (F1) and the cone are calculated using only information available at that time. The forward path is a projection drawn on the last bar and will naturally update as new bars arrive. Historical bars aren’t revised with future data.
Q: What is F1?
A: F1 is the indicator’s best guess for the next bar.
Price crossing above/below F1 can hint at short-term momentum shifts or mean-reversion.
Q: What do “Alpha” and “Beta” do?
A: Alpha controls how fast the indicator reacts to new prices
(higher = faster, twitchier). Beta controls how fast the slope updates (higher = quicker pivots, more flips in chop).
Q: Why does the cone width change?
A: It reflects recent forecast accuracy. When the market gets noisy, the cone widens. When the tape is calm, it narrows.
Q: What does the Accuracy Panel tell me?
A:
* Preset & Horizon you’re using.
* RMSE: typical forecast miss in price units.
* MAPE: typical forecast miss in percent.
* Slope T: short-term trend reading (up, down, or flat).
If RMSE/MAPE rise, expect a wider cone and more whipsaw.
Q: The panel shows “…” or looks empty. Why?
A: It needs a short warm-up to gather enough bars. This is normal after you add the indicator or change settings/timeframes.
Q: Which timeframe is best?
A:
* 1–3 min: Scalp/Fast or Momentum/Breakout, horizon \~8–12.
* 5–15 min: Smooth Intraday, horizon \~12–15.
Higher timeframes work too; consider a larger residual window for steadier cones.
Q: Which preset should I start with?
A: Start with Smooth Intraday. If the market is trending hard, try Momentum/Breakout.
For very quick tapes, use Scalp/Fast. Switch back if things get choppy.
Q: What does the VWAP option do?
A: It only changes colors (highlights when price agrees with the trend side of VWAP).
It does not add or remove signals.
Q: Are there alerts?
A: Yes—alerts for price crossing F1 (up/down). Use “Once per bar close” to reduce noise on fast charts.
Q: Can I use this on stocks, futures, crypto, or FX?
A: Yes. It works on any symbol/timeframe. You may want to adjust Horizon and the Residual Window based on volatility.
Q: Can I use it with Heikin Ashi or other non-standard bars?
A: You can, but remember you’re forecasting the synthetic series of those bars. For pure price behavior, use regular candles.
Q: The cone feels too wide/too narrow. What do I change?
A:
* Too wide: lower Alpha/Beta a bit or increase the Residual Window.
* Too narrow (misses moves): raise Alpha/Beta slightly or try Momentum/Breakout.
Q: Why do results change when I switch timeframe or symbol?
A: Different noise levels and trends. The accuracy stats reset per chart, so the cone adapts to each context.
Q: Any limits or gotchas?
A: Extremely large Horizon may hit TradingView’s line-object limits; reduce Horizon or turn
off extra visuals if needed. Big gaps or news spikes will widen errors—expect the cone to react.
Q: Can this predict exact future prices?
A: No. It provides a baseline path and context. Always combine with your own rules and risk management.
Glossary
* TS (Time Series): Data over time (prices).
* Holt’s Method: A forecasting approach that tracks a current level and a trend to predict the next bars.
* F1: The indicator’s best guess for the next bar.
* F(h): The projected value h bars ahead.
* VWAP: Volume-Weighted Average Price—used here for optional color alignment.
* RMSE: Typical forecast miss in price units (how far off, on average).
* MAPE: Typical forecast miss in percent (scale-free, easy to compare).
Notes & limitations
* The panel needs a short warm-up; stats may be blank at first.
* The cone reflects recent conditions; sudden volatility changes will widen it.
* This is a tool for context. It does not place trades and does not promise results.
⚠️ Disclaimer
This script is provided for educational purposes only.
Past performance does not guarantee future results.
Trading involves risk, and users should exercise caution and use proper risk management when applying this strategy.

Initial Balance Breakout Signals [LuxAlgo]The Initial Balance Breakout Signals help traders identify breakouts of the Initial Balance (IB) range.
The indicator includes automatic detection of IB or can use custom sessions, highlights top and bottom IB extensions, custom Fibonacci levels, and goes further with an IB forecast with two different modes.
🔶 USAGE
The initial balance is the price range made within the first hour of the trading session. It is an intraday concept based on the idea that high volume and volatility enter the market through institutional trading at the start of the session, setting the tone for the rest of the day.
The initial balance is useful for gauging market sentiment, or, in other words, the relationship between buyers and sellers.
Bullish sentiment: Price trades above the IB range.
Mixed sentiment: Price trades within the IB range.
Bearish sentiment: Price trades below the IB range.
The initial balance high and low are important levels that many traders use to gauge sentiment. There are two main ideas behind trading around the IB range.
IB Extreme Breakout: When the price breaks and holds the IB high or low, there is a high probability that the price will continue in that direction.
IB Extreme Rejection: When the price tries to break those levels but fails, there is a high probability that it will reach the opposite IB extreme.
This indicator is a complete Initial Balance toolset with custom sessions, breakout signals, IB extensions, Fibonacci retracements, and an IB forecast. All of these features will be explained in the following sections.
🔹 Custom Sessions and Signals
By default, sessions for Initial Balance and breakout signals are in Auto mode. This means that Initial Balance takes the first hour of the trading session and shows breakout signals for the rest of the session.
With this option, traders can use the tool for open range trading, making it highly versatile. The concept behind open range (OR) is the same as that of initial balance (IB), but in OR, the range is determined by the first minute, three or five minutes, or up to the first 30 minutes of the trading session.
As shown in the image above, the top chart uses the Auto feature for the IB and Breakouts sessions. The bottom chart has the Auto feature disabled to use custom sessions for both parameters. In this case, the first three minutes of the trading session are used, turning the tool into an Open Range trading indicator.
This chart shows another example of using custom sessions to display overnight NASDAQ futures sessions.
The left chart shows a custom session from the Tokyo open to the London open, and the right chart shows a custom session from the London open to the New York open.
The chart shows both the Asian and European sessions, their top and bottom extremes, and the breakout signals from those extremes.
🔹 Initial Balance Extensions
Traders can easily extend both extremes of the Initial Balance to display their preferred targets for breakouts. Enable or disable any of them and set the IB percentage to use for the extension.
As the chart shows, the percentage selected on the settings panel directly affects the displayed levels.
Setting 25 means the tool will use a quarter of the detected initial balance range for extensions beyond the IB extremes. Setting 100 means the full IB range will be used.
Traders can use these extensions as targets for breakout signals.
🔹 Fibonacci Levels
Traders can display default or custom Fibonacci levels on the IB range to trade retracements and assess the strength of market movements. Each level can be enabled or disabled and customized by level, color, and line style.
As we can see on the chart, after the IB was completed, prices were unable to fall below the 0.236 Fibonacci level. This indicates significant bullish pressure, so it is expected that prices will rise.
Traders can use these levels as guidelines to assess the strength of the side trying to penetrate the IB. In this case, the sellers were unable to move the market beyond the first level.
🔹 Initial Balance Forecast
The tool features two different forecasting methods for the current IB. By default, it takes the average of the last ten values and applies a multiplier of one.
IB Against Previous Open: averages the difference between IB extremes and the open of the previous session.
Filter by current day of the week: averages the difference between IB extremes and the open of the current session for the same day of the week.
This feature allows traders to see the difference between the current IB and the average of the last IBs. It makes it very easy to interpret: if the current IB is higher than the average, buyers are in control; if it is lower than the average, sellers are in control.
For example, on the left side of the chart, we can see that the last day was very bullish because the IB was completely above the forecasted value. This is the IB mean of the last ten trading days.
On the right, we can see that on Monday, September 15, the IB traded slightly higher but within the forecasted value of the IB mean of the last ten Mondays. In this case, it is within expectations.
🔶 SETTINGS
Display Last X IBs: Select how many IBs to display.
Initial Balance: Choose a custom session or enable the Auto feature.
Breakouts: Enable or disable breakouts. Choose custom session or enable the Auto feature.
🔹 Extensions
Top Extension: Enable or disable the top extension and choose the percentage of IB to use.
Bottom extension: Enable or disable the bottom extension and choose the percentage of IB to use.
🔹 Fibonacci Levels
Display Fibonacci: Enable or disable Fibonacci levels.
Reverse: Reverse Fibonacci levels.
Levels, Colors & Style
Display Labels: Enable or disable labels and choose text size.
🔹 Forecast
Display Forecast: Select the forecast method.
- IB Against Previous Open: Calculates the average difference between the IB high and low and the previous day's IB open price.
- Filter by Current Day of Week: Calculates the average difference between the IB high and low and the IB open price for the same day of the week.
Forecast Memory: The number of data points used to calculate the average.
Forecast Multiplier: This multiplier will be applied to the average. Bigger numbers will result in wider predicted ranges.
Forecast Colors: Choose from a variety of colors.
Forecast Style: Choose a line style.
🔹 Style
Initial Balance Colors
Extension Transparency: Choose the extension's transparency. 0 is solid, and 100 is fully transparent.

Options Max Pain Calculator [BackQuant]Options Max Pain Calculator
A visualization tool that models option expiry dynamics by calculating "max pain" levels, displaying synthetic open interest curves, gamma exposure profiles, and pin-risk zones to help identify where market makers have the least payout exposure.
What is Max Pain?
Max Pain is the theoretical expiration price where the total dollar value of outstanding options would be minimized. At this price level, option holders collectively experience maximum losses while option writers (typically market makers) have minimal payout obligations. This creates a natural gravitational pull as expiration approaches.
Core Features
Visual Analysis Components:
Max Pain Line: Horizontal line showing the calculated minimum pain level
Strike Level Grid: Major support and resistance levels at key option strikes
Pin Zone: Highlighted area around max pain where price may gravitate
Pain Heatmap: Color-coded visualization showing pain distribution across prices
Gamma Exposure Profile: Bar chart displaying net gamma at each strike level
Real-time Dashboard: Summary statistics and risk metrics
Synthetic Market Modeling**
Since Pine Script cannot access live options data, the indicator creates realistic synthetic open interest distributions based on configurable market parameters including volume patterns, put/call ratios, and market maker positioning.
How It Works
Strike Generation:
The tool creates a grid of option strikes centered around the current price. You can control the range, density, and whether strikes snap to realistic market increments.
Open Interest Modeling:
Using your inputs for average volume, put/call ratios, and market maker behavior, the indicator generates synthetic open interest that mirrors real market dynamics:
Higher volume at-the-money with decay as strikes move further out
Adjustable put/call bias to reflect current market sentiment
Market maker inventory effects and typical short-gamma positioning
Weekly options boost for near-term expirations
Pain Calculation:
For each potential expiry price, the tool calculates total option payouts:
Call options contribute pain when finishing in-the-money
Put options contribute pain when finishing in-the-money
The strike with minimum total pain becomes the Max Pain level
Gamma Analysis:
Net gamma exposure is calculated at each strike using standard option pricing models, showing where hedging flows may be most intense. Positive gamma creates price support while negative gamma can amplify moves.
Key Settings
Basic Configuration:
Number of Strikes: Controls grid density (recommended: 15-25)
Days to Expiration: Time until option expiry
Strike Range: Price range around current level (recommended: 8-15%)
Strike Increment: Spacing between strikes
Market Parameters:
Average Daily Volume: Baseline for synthetic open interest
Put/Call Volume Ratio: Market sentiment bias (>1.0 = bearish, <1.0 = bullish) It does not work if set to 1.0
Implied Volatility: Current option volatility estimate
Market Maker Factors: Dealer positioning and hedging intensity
Display Options:
Model Complexity: Simple (line only), Standard (+ zones), Advanced (+ heatmap/gamma)
Visual Elements: Toggle individual components on/off
Theme: Dark/Light mode
Update Frequency: Real-time or daily calculation
Reading the Display
Dashboard Table (Top Right):
Current Price vs Max Pain Level
Distance to Pain: Percentage gap (smaller = higher pin risk)
Pin Risk Assessment: HIGH/MEDIUM/LOW based on proximity and time
Days to Expiry and Strike Count
Model complexity level
Visual Elements:
Red Line: Max Pain level where payout is minimized
Colored Zone: Pin risk area around max pain
Dotted Lines: Major strike levels (green = support, orange = resistance)
Color Bar: Pain heatmap (blue = high pain, red = low pain/max pain zones)
Horizontal Bars: Gamma exposure (green = positive, red = negative)
Yellow Dotted Line: Gamma flip level where hedging behavior changes
Trading Applications
Expiration Pinning:
When price is near max pain with limited time remaining, there's increased probability of gravitating toward that level as market makers hedge their positions.
Support and Resistance:
High open interest strikes often act as magnets, with max pain representing the strongest gravitational pull.
Volatility Expectations:
Above gamma flip: Expect dampened volatility (long gamma environment)
Below gamma flip: Expect amplified moves (short gamma environment)
Risk Assessment:
The pin risk indicator helps gauge likelihood of price manipulation near expiry, with HIGH risk suggesting potential range-bound action.
Best Practices
Setup Recommendations
Start with Model Complexity set to "Standard"
Use realistic strike ranges (8-12% for most assets)
Set put/call ratio based on current market sentiment
Adjust implied volatility to match current levels
Interpretation Guidelines:
Small distance to pain + short time = high pin probability
Large gamma bars indicate key hedging levels to monitor
Heatmap intensity shows strength of pain concentration
Multiple nearby strikes can create wider pin zones
Update Strategy:
Use "Daily" updates for cleaner visuals during trading hours
Switch to "Every Bar" for real-time analysis near expiration
Monitor changes in max pain level as new options activity emerges
Important Disclaimers
This is a modeling tool using synthetic data, not live market information. While the calculations are mathematically sound and the modeling realistic, actual market dynamics involve numerous factors not captured in any single indicator.
Max pain represents theoretical minimum payout levels and suggests where natural market forces may create gravitational pull, but it does not guarantee price movement or predict exact expiration levels. Market gaps, news events, and changing volatility can override these dynamics.
Use this tool as additional context for your analysis, not as a standalone trading signal. The synthetic nature of the data makes it most valuable for understanding market structure and potential zones of interest rather than precise price prediction.
Technical Notes
The indicator uses established option pricing principles with simplified implementations optimized for Pine Script performance. Gamma calculations use standard financial models while pain calculations follow the industry-standard definition of minimized option payouts.
All visual elements use fixed positioning to prevent movement when scrolling charts, and the tool includes performance optimizations to handle real-time calculation without timeout errors.

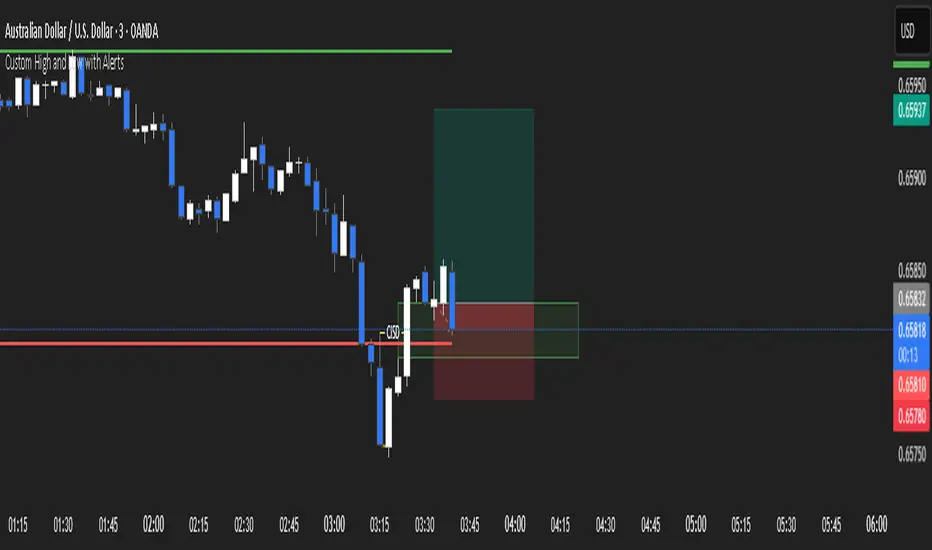
Custom High and Low (W,D,4,1)Custom High and Low (W,D,4,1)
can choose Weekly Daily 4h 1hr Previous High and Low.
Shashwat Khurana (v6) – VWAP ±1SD + RSI + ATR Filter A multi-factor volatility-adjusted mean-reversion model integrating dynamic liquidity thresholds and higher-order momentum filters for asymmetric risk calibration

$ - HTF Sweeps & PO3HTF Sweeps & PO3 Indicator
The HTF Sweeps & PO3 indicator is a powerful tool designed for traders to visualise higher timeframe (HTF) candles, identify liquidity sweeps, and track key price levels on a lower timeframe (LTF) chart. Built for TradingView using Pine Script v6, it overlays HTF candle data and highlights significant price movements, such as sweeps of previous highs or lows, to help traders identify potential liquidity sweep and reversal points. The indicator is highly customisable, offering a range of visual and alert options to suit various trading strategies.
Features
Higher Timeframe (HTF) Candle Visualisation:
- Displays up to three user-defined HTF candles (e.g., 15m, 1H, 4H) overlaid on the LTF chart.
- Customisable candle appearance with adjustable size (Tiny to Huge), offset, spacing, and colours for bullish/bearish candles and wicks.
- Option to show timeframe labels above or below HTF candles with configurable size and position.
Liquidity Sweep Detection:
- Identifies bullish and bearish sweeps when price moves beyond the high or low of a previous HTF candle and meets specific conditions.
- Displays sweeps on both LTF and HTF with customisable line styles (Solid, Dashed, Dotted), widths, and colours.
- Option to show only the most recent sweep per candle to reduce chart clutter.
Invalidated Sweep Tracking:
- Detects and visualises invalidated sweeps (when price moves past a sweep level in the opposite direction).
- Configurable display for invalidated sweeps on LTF and HTF with distinct line styles and colours.
Previous High/Low Lines:
- Plots horizontal lines at the high and low of the previous HTF candle, extending on both LTF and HTF.
- Customisable line style, width, and color for easy identification of key levels.
- Real-Time Sweep Detection:
-Optional real-time sweep visualisation for active candles, enabling traders to monitor developing price action.
Alert System:
- Triggers alerts for sweep formation (when a new sweep is detected).
- Triggers alerts for sweep invalidation (when a sweep is no longer valid).
- Alerts include details such as timeframe, ticker, and price level for precise notifications.
Performance Optimisation:
- Efficiently manages resources with configurable limits for lines, labels, boxes, and bars (up to 500 each).
- Cleans up outdated visual elements to maintain chart clarity.
Flexible Configuration:
- Supports multiple timeframes for HTF candles with user-defined settings for visibility and number of candles displayed (1–60).
- Toggle visibility for HTF candles, sweeps, invalidated sweeps, and high/low lines independently for LTF and HTF.
This indicator is ideal for traders focusing on liquidity hunting, order block analysis, or price action strategies, providing clear visual cues and alerts to enhance decision-making.

Super SignalWhen all lines are below the 20 line its a super signal to buy. When all trends are above the 80 line it is a super signal to sell.

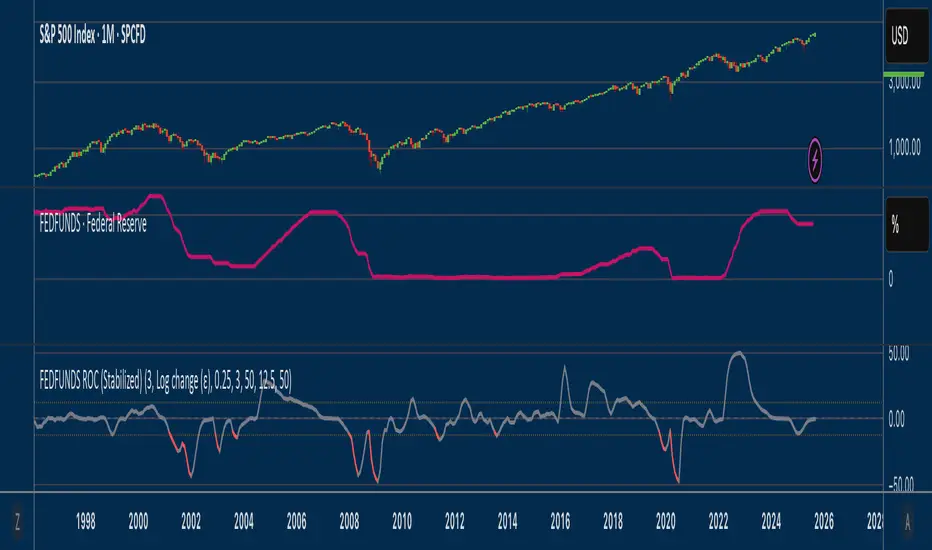
Fed Funds Rate-of-ChangeFed Funds Rate-of-Change
What it does:
This indicator pulls the Effective Federal Funds Rate (FRED:FEDFUNDS, monthly) and measures how quickly it’s changing over a user-defined lookback. It offers stabilized change metrics that avoid the “near-zero blow-up” you see with naive % ROC. The plot turns red only when the signal is below the lower threshold and heading down (i.e., value < –threshold and slope < 0).
This indicator is meant to be useful in monitoring fast cuts on the part of the FED - a signal that has preceded recession or market pullbacks in times prior.
Change modes: Percentage, log and delta.
Percent ROC (ε floor): 100 * (now - prev) / max(prev, ε)
Log change (ε): 100 * (ln(now + ε) - ln(prev + ε))
Delta (bps): (now - prev) * 100 (basis points; avoids percentage math)
Tip: For “least drama,” use Delta (bps). For relative change without explosions near zero, use Log change (ε).
Key inputs:
Lookback (months): ROC window in calendar months (because source is monthly).
Change Metric: one of the three options above.
ε (percentage points): small constant (e.g., 0.25 pp) used by Percent ROC (ε) and Log change (ε) to stabilize near-zero values.
EMA Smoothing length: light smoothing of the computed series.
Clip |value| at: optional hard cap to tame outliers (0 = off).
Threshold % / Threshold bps: lower/upper threshold band; unit adapts to the selected metric.
Plot as histogram: optional histogram view.
Coloring / signal logic
Red: value is below the lower threshold (–threshold) and the series is falling on the current bar.
How to use:
Add to any chart (timeframe doesn’t matter; data is monthly under the hood).
Pick a Change Metric and set Lookback (e.g., 3–6 months).
Choose a reasonable threshold:
Percent/Log: try 10–20%
Delta (bps): try 50–100 bps
Optionally smooth (EMA 3–6) and/or clip extreme spikes.
Interpretation
Sustained red often marks periods of accelerating downside in the Fed Funds change metric (e.g., policy easing momentum when using bps).
Neutral (gray) provides context without implying direction bias.
Notes & limitations
Source is monthly FRED series; values update on monthly closes and are stable (no intrabar repainting of the monthly series).
Threshold units switch automatically with the metric (%, %, or bps).
Smoothing/clip are convenience tools; adjust conservatively to avoid masking important shifts.
Mongoose Global Conflict Risk Index v1Overview
The Mongoose Global Conflict Risk Index v1 is a multi-asset composite indicator designed to track the early pricing of geopolitical stress and potential conflict risk across global markets. By combining signals from safe havens, volatility indices, energy markets, and emerging market equities, the index provides a normalized 0–10 score with clear bias classifications (Neutral, Caution, Elevated, High, Shock).
This tool is not predictive of headlines but captures when markets are clustering around conflict-sensitive assets before events are widely recognized.
Methodology
The indicator calculates rolling rate-of-change z-scores for eight conflict-sensitive assets:
Gold (XAUUSD) – classic safe haven
US Dollar Index (DXY) – global reserve currency flows
VIX (Equity Volatility) – S&P 500 implied volatility
OVX (Crude Oil Volatility Index) – energy stress gauge
Crude Oil (CL1!) – WTI front contract
Natural Gas (NG1!) – energy security proxy, especially Europe
EEM (Emerging Markets ETF) – global risk capital flight
FXI (China ETF) – Asia/China proxy risk
Rules:
Safe havens and vol indices trigger when z-score > threshold.
Energy triggers when z-score > threshold.
Risk assets trigger when z-score < –threshold.
Each trigger is assigned a weight, summed, normalized, and scaled 0–10.
Bias classification:
0–2: Neutral
2–4: Caution
4–6: Elevated
6–8: High
8–10: Conflict Risk-On
How to Use
Timeframes:
Daily (1D) for strategic signals and early warnings.
4H for event shocks (missiles, sanctions, sudden escalations).
Weekly (1W) for sustained trends and macro build-ups.
What to Look For:
A single trigger (for example, Gold ON) may be noise.
A cluster of 2–3 triggers across Gold, USD, VIX, and Energy often marks early stress pricing.
Elevated readings (>4) = caution; High (>6) = rotation into havens; Shock (>8) = market conviction of conflict risk.
Practical Application:
Monitor as a heatmap of global stress.
Combine with fundamental or headline tracking.
Use alert conditions at ≥4, ≥6, ≥8 for systematic monitoring.
Notes
This indicator is for informational and educational purposes only.
It is not financial advice and should be used in conjunction with other analysis methods.

Buy and Sell Signals (Altius Consulting)Generates Buy and Sell signals based on MACD and RSI.
- Plots MACD, Signal & Histogram (optional pane).
- Buy Label (toggle): Bullish MACD crossover + RSI < threshold (no convergence requirement).
- Sell Label: Bearish MACD crossover (MACD crosses below Signal) prints a SELL tag.
- Alert: Provided for convergence-based buy condition (add your own for simple crossover if desired).

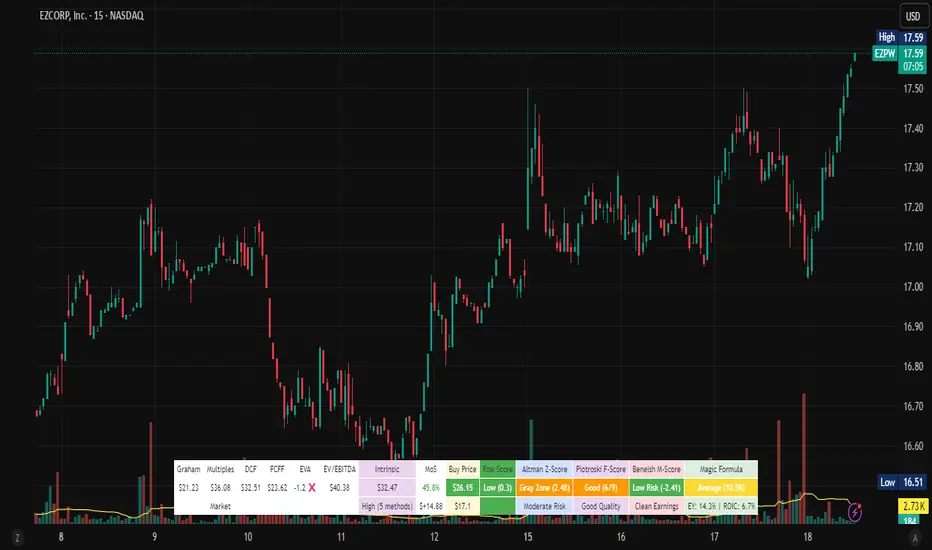
Stock Valuation Models - Professional Investment Analysis Tool📊 Overview
Stock Valuation Models is a comprehensive financial analysis indicator that combines multiple valuation methodologies to calculate intrinsic stock value. This professional-grade tool implements 7 different valuation methods , risk assessment framework, and financial health metrics to provide data-driven investment decisions.
🎯 Key Features
📈 Multiple Valuation Methods
Graham's Valuation - Conservative asset-based approach by Benjamin Graham
Multiples Valuation - Market-based P/E and P/B ratios from sector peers
Discounted Cash Flow (DCF) - Future cash flow projections with present value calculation
Dividend Discount Model - Gordon Growth Model for dividend-paying stocks
FCFF Model - Enterprise-level Free Cash Flow to Firm analysis
EVA Model - Economic Value Added measurement above cost of capital
Advanced Multiples - Enterprise Value ratios (EV/EBITDA, EV/Sales)
🏥 Financial Health Metrics
Altman Z-Score - Bankruptcy prediction and financial distress assessment
Piotroski F-Score - 9-point fundamental strength evaluation
Beneish M-Score - Earnings manipulation detection system
Magic Formula - Joel Greenblatt's combined quality and value scoring
⚖️ Risk Assessment Framework
Multi-Factor Risk Scoring - Fundamental, market, quality, and data quality risks
Risk-Adjusted Margin of Safety - Dynamic safety thresholds based on risk level
Position Sizing Guidance - Risk-appropriate investment allocation recommendations
🔍 Data Quality System
Real-Time Quality Tracking - Visual warnings for insufficient data
Fallback Methodology - Alternative calculations when primary data unavailable
Confidence Scoring - Method agreement and data quality assessment
⚙️ Settings & Parameters
Main Settings
Margin of Safety (%) - Minimum discount required before buying (Default: 15%)
Table Font Size - Choose between "Small" and "Normal" text size
Valuation Methods
Graham's Valuation - Best for mature, stable companies with strong fundamentals
Multiples Valuation - Compares to industry peers using dynamic sector ratios
Discounted Cash Flow - Ideal for growth companies with predictable cash flows
Dividend Discount Model - For consistent dividend-paying stocks (disabled by default)
FCFF Model - Enterprise approach for leveraged companies and M&A analysis
EVA Model - Measures value creation above cost of capital
Advanced Multiples - Wall Street standard EV ratios for professional analysis
Additional Metrics
Magic Formula - Combined quality and value scoring system
Altman Z-Score - Bankruptcy risk assessment (Safe >2.99, Distress <1.81)
Piotroski F-Score - Fundamental quality score (Excellent ≥8, Poor <4)
Beneish M-Score - Manipulation detector (High Risk >-2.22, Low Risk ≤-2.22)
🔧 How It Works
Dynamic Calculations
Sector-Based Ratios - Automatically detects company sector and applies appropriate valuation multiples
Economic Integration - Uses real-time risk-free rates, VIX volatility, and GDP growth data
Quality Weighting - Adjusts method weights based on company type (growth/mature/distressed) and market conditions
Negative Value Handling - Shows actual calculated values but excludes negative results from weighted average
Risk-Adjusted Analysis
VIX Integration - Higher market volatility increases required margin of safety
Sector Risk Premiums - Energy and Financial sectors get higher risk multipliers
Quality Adjustments - High Piotroski F-Score companies get lower risk ratings
Data Quality Impact - Insufficient data increases risk score and safety requirements
Visual Display
Horizontal Table Layout - Organized by method groups (Valuation → Results → Risk → Health)
Color-Coded Results - Green/Yellow/Red indicators for risk levels and recommendations
Warning Symbols - ⚠️ for data quality issues, ❌ for excluded negative values
Dollar Amounts - Both percentage and dollar-based margin of safety calculations
📈 Interpretation Guide
💎 Intrinsic Value Results
Weighted Average - Combines all enabled methods based on intelligent weighting
Confidence Level - High/Medium/Low based on method agreement and data quality
Method Count - Number of successful valuation calculations
🎯 Margin of Safety
Percentage - Current discount/premium to calculated intrinsic value
Dollar Amount - Absolute dollar difference per share
Buy Price - Risk-adjusted target purchase price
⚖️ Risk Assessment
Low Risk (Green) - Normal position sizing (3-5%)
Medium Risk (Yellow) - Reduced position sizing (1-3%)
High Risk (Red) - Minimal position sizing (<1%)
📊 Recommendations
STRONG BUY - Low risk + adequate margin + high confidence
BUY - Meets risk-adjusted margin requirements
HOLD - Positive margin but higher risk
SELL - Insufficient margin for risk level
🎓 Educational Tooltips
Every parameter includes detailed explanations accessible by hovering over the setting. Learn about:
When to use each valuation method
How different metrics are calculated
Interpretation thresholds and ratings
Risk factors and quality indicators
💡 Best Practices
🚀 For Growth Stocks
Enable DCF and Advanced Multiples
Focus on Piotroski F-Score for quality assessment
Use higher margin of safety due to volatility
💰 For Value Stocks
Enable Graham's and Multiples Valuation
Check Altman Z-Score for financial stability
Consider Magic Formula rating
📈 For Dividend Stocks
Enable Dividend Discount Model
Focus on sustainable dividend coverage
Check for consistent dividend history
⚠️ For Distressed Situations
Prioritize Graham's asset-based approach
Monitor Altman Z-Score closely
Use higher risk-adjusted margins
⚠️ Important Notes & Data Limitations
📅 Data Timing Considerations
Fundamental Data Lag - Company financial data (earnings, cash flows, balance sheet items) may be 1-3 months behind current market conditions
Quarterly Reporting Delays - Most recent available data reflects the company's situation as of the last filed quarterly/annual report
Market vs. Fundamentals Gap - Stock prices react instantly to news, while fundamental data updates occur periodically
Accuracy Impact - Recent business changes, market events, or company developments may not be reflected in current calculations
🔧 Technical Limitations
Data Dependencies - Requires fundamental data availability from TradingView
Quality Warnings - Pay attention to ⚠️ symbols indicating insufficient data
Risk Context - Always consider risk score in investment decisions
Market Conditions - Tool automatically adjusts for market volatility (VIX)
Sector Specificity - Ratios automatically adjust based on company's sector
💡 Best Practice Recommendations
Supplement with Current Analysis - Always combine with recent news, earnings calls, and management guidance
Monitor Data Quality - Check when the underlying financial data was last updated
Consider Market Context - Factor in recent market events that may affect company performance
Use as Starting Point - Treat calculations as baseline analysis requiring additional research
🔗 Methodology
Based on established academic research and professional practices:
Benjamin Graham - Security Analysis principles
Joel Greenblatt - Magic Formula methodology
Edward Altman - Z-Score bankruptcy prediction
Joseph Piotroski - Fundamental analysis scoring
Messod Beneish - Earnings manipulation detection
Modern Portfolio Theory - Risk-adjusted decision making
This indicator is designed for educational and analytical purposes. Always conduct additional research and consider consulting with financial professionals before making investment decisions.
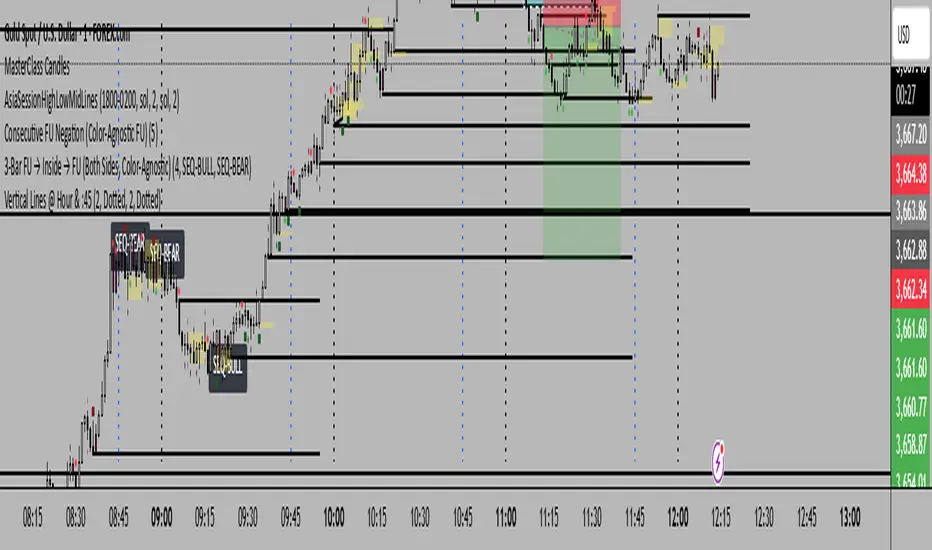
Vertical Lines @ Hour & :45vertical lines at hour and 45 past each hour
when manipulation is most likely to happen
Otekura Range Trade Algorithm [Tradebuddies]The Range Trade Algorithm calculates the levels for Monday.
On the chart you will see that the Monday levels will be marked as 1 0 -1.
The M High level calculates Monday's high close and plots it on the screen.
M Low calculates the low close of Monday and plots it on the screen.
The coloured lines on the screen are the points of the range levels formulated with fibonacci values.
The indicator has its own Value table. The prices of the levels are written.
Potential Range breakout targets tell prices at points matching the fibonacci values. These are Take profit or reversal points.
Buy and Sell indicators are determined by the range breakout.
Users can set an alarm on the indicator and receive direct notification with their targets when a new range occurs.
Fib values are multiplied by range values and create an average target according to the price situation. These values represent an area. Breakdown targets show that the target is targeted until the area.

MTF Levels [OmegaTools]📖 Introduction
The Ω Levels Indicator is a complete market structure and level-mapping framework designed to help traders identify key zones where price is likely to react.
It blends classic technical anchors (VWAP, pivots, means, standard deviations) with modern statistical pattern recognition to dynamically project areas of manipulation, extension, and equilibrium.
At its core, Ω Levels creates an evolving map of market balance vs. imbalance, showing traders where liquidity is most likely to build and where price could pivot or accelerate.
But what makes it truly unique is the Pivot Forecaster — an embedded predictive engine that applies machine-learning inspired logic to recognize conditions that historically precede market turning points.
🔎 Key Features
Customizable Levels Framework
Define up to three levels (manipulation, extensions, VWAP, pivots, stdev bands, or prior extremes).
Choose mean references such as Open, VWAP, Pivot Mean, or Previous Session Mean.
Style controls (solid, dotted, dashed) and fill modes (internal, external, ranges) allow you to adapt the chart to your visual workflow.
Dynamic Zone Highlighting
Automatic fills between internal/external levels, or between specific level pairs (1–2, 1–3, 2–3).
Makes it easy to visualize value areas, expansions, and compression zones at a glance.
Multi-Timeframe Anchoring
Works on any timeframe, but calculations can be anchored to a higher timeframe (e.g., show daily VWAP & pivots on a 15m chart).
This allows traders to align intraday execution with higher timeframe context.
Pivot Forecaster (Machine Learning / Pattern Recognition)
This is the advanced predictive component.
The algorithm collects historical conditions observed around pivot highs and lows (volume state, ATR state, % candle expansion, oscillator conditions).
It then builds statistical “profiles” of typical pivot behavior and compares them in real-time against current market conditions.
When conditions match the “signature” of a pivot, the indicator highlights a Forecast Pivot High or Forecast Pivot Low (displayed as small diamond markers).
This functions as a pattern-recognition system, effectively learning from past pivots to anticipate where the next turning point is more likely to occur.
⚡ How Traders Can Use It
Intraday Execution: Use VWAP, manipulation, and extension levels to frame trades around liquidity zones.
Swing Context: Overlay higher timeframe pivots and means to guide medium-term positioning.
Fade Setups: Forecasted pivots often coincide with exhaustion zones where fading momentum carries edge.
Breakout Validation: When price breaks a structural level but the forecaster does not confirm a pivot, continuation probability is higher.
Risk Management: Levels provide natural stop/target placements, while pivot forecasts serve as warning signals for potential reversals.
⚙️ Settings Overview
Timeframe: Choose the anchor timeframe for calculations (default: Daily).
Means: Two selectable mean references (Open, VWAP, Pivot Point, Previous Mean).
Levels: Three levels can be customized (Manipulation, Extension, 1–2 StDev, Pivot Point, VWAP, Previous Extremes).
Fill Modes: Highlight zones between internal/external levels or custom ranges.
Visual Customization: Colors, line styles, fill opacity, and toggle for old levels.
Pivot Forecaster: Fully automated — no settings required, it adapts to instrument and timeframe.
🧭 Best Practices
Align Levels With Market Profile: Treat the levels as dynamic S/R zones and watch how price interacts with them.
Use Forecaster as Confirmation: The diamonds are not standalone signals; they are context filters that help you decide whether a move has higher reversal odds.
Higher Timeframe Anchoring: On intraday charts, set the timeframe to Daily or Weekly to trade with institutional levels.
Combine With ATR: Pair with the Ω ATR Indicator to size positions according to volatility while Ω Levels provides the structural roadmap.
📌 Summary
The Ω Levels Indicator is more than a level plotter — it’s a market map + predictive engine.
By combining traditional levels with an intelligent pivot forecaster, it gives traders both the static structure of where price should react, and the dynamic signal of where it is likely to react next.
This dual-layer approach — structural + predictive — makes it an invaluable tool for discretionary intraday traders, swing traders, and anyone who wants to anticipate price behavior instead of just reacting to it.

Implied Volatility RangeThe Implied Volatility Range is a forward-looking tool that transforms option market data into probability ranges for future prices. Based on the lognormal distribution of asset prices assumed in modern option pricing models, it converts the implied volatility curve into a volatility cone with dynamic labels that show the market’s expectations for the price distribution at a specific point in time. At the selected future date, it displays projected price levels and their percentage change from today’s close across 1, 2, and 3 standard deviation (σ) ranges:
1σ range = ~68.2% probability the price will remain within this range.
2σ range = ~95.4% probability the price will remain within this range.
3σ range = ~99.7% probability the price will remain within this range.
What makes this indicator especially useful is its ability to incorporate implied volatility skew. When only ATM IV (%) is entered, the indicator displays the standard Black–Scholes lognormal distribution. By adding High IV (%) and Low IV (%) values tied to strikes above and below the current price, the indicator interpolates between these inputs to approximate the implied volatility skew. This adjustment produces a market-implied probability distribution that indicates whether the option market is leaning bullish or bearish, based on the data entered in the menu:
ATM IV (%) = Implied volatility at the current spot price (at-the-money).
High IV (%) = Implied volatility at a strike above the current spot price.
High Strike = Strike price corresponding to the High IV input (OTM call).
Low IV (%) = Implied volatility at a strike below the current spot price.
Low Strike = Strike price corresponding to the Low IV input (OTM put).
Expiration (Day, Month, Year) = Option expiration date for the projection.
Once these inputs are entered, the indicator calculates implied probability ranges and, if both High IV and Low IV values are provided, adjusts for skew to approximate the option market’s distribution. If no implied volatility data is supplied, the indicator defaults to a lognormal distribution based on historical volatility, using past realized volatility over the same forward horizon. This keeps the tool functional even without implied volatility inputs, though in that case the output represents only an approximation of ATM IV, not the actual market view.
In summary, the Implied Volatility Range is a powerful tool that translates implied volatility inputs into a clear and practical estimate of the market’s expectations for future prices. It allows traders to visualize the probability of price ranges while also highlighting directional bias, a dimension often difficult to interpret from traditional implied volatility charts. It should be emphasized, however, that this tool reflects only the market’s expectations at a specific point in time, which may change as new information and trading activity reshape implied volatility.

Piano Frequency LevelsPiano Frequency Levels
This indicator applies the mathematical principles of musical harmony to market analysis, creating support and resistance levels based on authentic piano frequency ratios. Drawing from centuries-old musical theory, it maps the precise mathematical relationships between piano keys to price levels.
How It Works: The indicator uses the exact frequency ratios from equal temperament tuning - the same mathematical system that makes pianos sound harmonious. Each level represents an actual piano key frequency, scaled proportionally to your chosen anchor price.
Key Features:
• Piano-Based Ratios: Uses authentic 12-tone equal temperament frequency relationships (1.05946 ratio between semitones)
• Directional Intelligence: Automatically creates ascending levels from lows (resistance) or descending levels from highs (support)
• Musical Note Labels: Optional display of actual piano key names (C4, D#5, F6, etc.) alongside price levels
• Black Key Subdivisions: Toggle authentic sharp/flat keys between natural notes for additional precision
• Octave Color Coding: Each musical octave displays in a different color for easy visual identification
• Anchor Reference: Bright green line clearly marks your C-note reference point
Musical Foundation: Every level corresponds to an actual piano key. The anchor point represents "C" (the musical root), with levels progressing through the natural musical sequence: C, D, E, F, G, A, B, then repeating in higher octaves. This creates proportional spacing that mirrors the harmonic relationships musicians have used for centuries.
Usage:
1. Set your anchor to a significant market high or low
2. Choose your desired number of levels (typically 12-24 for 1-2 octaves)
3. Enable "Add Black Keys" for additional intermediate levels
4. Enable "Show Note Names" to see which piano key each level represents
The Theory: Musical harmony is based on precise mathematical ratios that create pleasing relationships between frequencies. These same mathematical principles may manifest in market movements, as price action often exhibits proportional relationships similar to musical intervals.
Unique Advantages:
• Based on established mathematical principles rather than arbitrary ratios
• Provides both major levels (white keys) and intermediate levels (black keys)
• Automatically adapts direction based on anchor type (high vs low)
• Maintains authentic musical relationships across all timeframes and price ranges
Important Note: This indicator presents a theoretical framework for market analysis. Like all technical analysis tools, it should be used in conjunction with other forms of analysis and proper risk management. The musical ratios provide a unique perspective on potential support and resistance levels, but past performance does not guarantee future results.
Transform your charts into a musical instrument and discover the hidden harmonies in market movements.

Expected Value Monte CarloI created this indicator after noticing that there was no Expected Value indicator here on TradingView.
The EVMC provides statistical Expected Value to what might happen in the future regarding the asset you are analyzing.
It uses 2 quantitative methods:
Historical Backtest to ground your analysis in long-term, factual data.
Monte Carlo Simulation to project a cone of probable future outcomes based on recent market behavior.
This gives you a data-driven edge to quantify risk, and make more informed trading decisions.
The indicator includes:
Dual analysis: Combines historical probability with forward-looking simulation.
Quantified projections: Provides the Expected Value ($ and %), Win Rate, and Sharpe Ratio for both methods.
Asset-aware: Automatically adjusts its calculations for Stocks (252 trading days) and Crypto (365 days) for mathematical accuracy.
The projection cone shows the mean expected path and the +/- 1 standard deviation range of outcomes.
No repainting
Calculation:
1. Historical Expected Value:
This is a systematic backtest over thousands of bars. It calculates the return Rᵢ for N past trades (buy-and-hold). The Historical EV is the simple average of these returns, giving a baseline performance measure.
Historical EV % = (Σ Rᵢ) / N
2. Monte Carlo Projection:
This projection uses the Geometric Brownian Motion (GBM) model to simulate thousands of future price paths based on the market's recent behavior.
It first measures the drift (μ), or recent trend, and volatility (σ), or recent risk, from the Projection Lookback period. It then projects a final return for each simulation using the core GBM formula:
Projected Return = exp( (μ - σ²/2)T + σ√T * Z ) - 1
(Where T is the time horizon and Z is a random variable for the simulation.)
The purple line on the chart is the average of all simulated outcomes (the Monte Carlo EV). The cone represents one standard deviation of those outcomes.
The dashed lines represent one standard deviation (+/- 1σ) from the average, forming a cone of probable outcomes. Roughly 68% of the simulated paths ended within this cone.
This projection answers the question: "If the recent trend and volatility continue, where is the price most likely to go?"
Here's how to read the indicator
Expected Value ($/%): Is my average trade profitable?
Win Rate: How often can I expect to be right?
Sharpe Ratio: Am I being adequately compensated for the risk I'm taking?
User Guide
Max trade duration (bars): This is your analysis timeframe. Are you interested in the probable outcome over the next month (21 bars), quarter (63 bars), or year (252 bars)?
Position size ($): Set this to your typical trade size to see the Expected Value in real dollar terms.
Projection lookback (bars): This is the most important input for the Monte Carlo model. A short lookback (e.g., 50) makes the projection highly sensitive to recent momentum. Use this to identify potential recency bias. A long lookback (e.g., 252) provides a more stable, long-term projection of trend and volatility.
Historical Lookback (bars): For the historical backtest, more data is always better. Use the maximum that your TradingView plan allows for the most statistically significant results.
Use TP/SL for Historical EV: Check this box to see how the historical performance would have changed if you had used a simple Take Profit and Stop Loss, rather than just holding for the full duration.
I hope you find this indicator useful and please let me know if you have any suggestions. 😊

Stop Loss Advisor📊 Stop Loss Advisor - Advanced Risk Management Tool
A sophisticated Pine Script v5 indicator designed to suggest optimal stop loss distances based on market volatility, combining ATR and Standard Deviation analysis for precise risk management.
🎯 What Makes This Different from Bollinger Bands?
While Bollinger Bands focus on mean reversion and overbought/oversold conditions using a moving average center line, this indicator is specifically designed for risk management . It creates dynamic bands around the current price to suggest where NOT to place your stop loss, preventing you from being stopped out by normal market noise.
⚡ Key Features
Dynamic ATR Calculation - Fully customizable ATR periods with adaptive volatility filtering
Standard Deviation Integration - Optional StdDev component for enhanced statistical accuracy
Multiple Combination Modes - Average, Maximum, ATR Weighted, or StdDev Weighted
Flexible Price Sources - Choose from Close, HL2, HLC3, or OHLC4
Automatic Pip Calculation - Works across all instruments with automatic pip value detection
Smart Alerts System - Get notified when suggested stop loss exceeds your base risk tolerance
Real-time Information Table - Displays current values and risk status
Visual Labels - Shows exact pip distances directly on chart
Band Smoothing - Prevents erratic movements with customizable averaging
📈 How It Works
ATR Analysis : Calculates Average True Range to measure current market volatility
Statistical Enhancement : Optionally combines with Standard Deviation for more robust calculations
Dynamic Bands : Creates upper and lower bands that expand/contract with volatility
Pip Conversion : Automatically converts distances to pips for easy interpretation
Risk Assessment : Compares suggested distances with your base stop loss tolerance
🔧 Customization Options
ATR Settings:
Customizable ATR period (default: 14)
Adjustable multiplier with 0.1 step precision
Optional volatility filtering for enhanced sensitivity
Standard Deviation (Optional):
Independent period and multiplier settings
Multiple price source options
Four combination modes with ATR
Visual Customization:
Fully customizable colors for all elements
Multiple line styles (solid, dashed, dotted)
Optional band filling with transparency control
Show/hide ATR line overlay
Configurable band smoothing
💡 Perfect For
Forex Traders - Especially effective on major pairs and XAUUSD
Risk Managers - Calculate optimal stop distances before entering trades
Scalpers - Avoid being stopped out by normal market fluctuations
Swing Traders - Adapt stop losses to current volatility conditions
📊 Indicator Values
The information table displays:
Current ATR Value (in pips)
Suggested Long Stop Loss (distance in pips)
Suggested Short Stop Loss (distance in pips)
Risk Status - "SAFE" or "HIGH RISK" based on your base tolerance
Standard Deviation Value (when enabled)
Combination Method (when using both ATR and StdDev)
⚠️ Important Notes
This indicator suggests minimum stop loss distances, not entry/exit signals
Always combine with your trading strategy and risk management rules
Do not use as a standalone trading system
Backtesting recommended before live implementation
Default settings work well for most scenarios, but optimization is encouraged
🎨 Default Configuration
ATR Period: 14
ATR Multiplier: 2.0
Price Source: Close
Base Stop Loss: 20 pips
Band Smoothing: 3 periods
Standard Deviation: Optional (20 period, 2.0 multiplier)
🚀 Getting Started
Add the indicator to your chart
Set your base stop loss tolerance in the settings
Choose your preferred price source and ATR parameters
Enable Standard Deviation for enhanced accuracy (optional)
Monitor the information table for real-time risk assessment
Use the suggested distances as minimum stop loss levels
Pro Tip: In low volatility markets, the bands will contract suggesting tighter stops. In high volatility periods, they expand warning you to use wider stops to avoid being stopped out by normal price action.
📝 Version History & Updates
This indicator is actively maintained and updated based on user feedback. Future enhancements may include multi-timeframe analysis, trend-based asymmetric bands, and additional statistical measures.
Transform your risk management approach with data-driven stop loss suggestions that adapt to real market conditions!

The Maker StrategyDESCRIPTION
The Maker Strategy is a trend-following system built around exponential moving averages (EMAs). By analyzing the alignment of multiple EMAs, the strategy identifies strong bullish or bearish momentum and generates precise entry signals. This method is designed to capture sustained trends while filtering out sideways or noisy market conditions.
USER INPUTS :
• EMA 1 Length (Default: 30)
• EMA 2 Length (Default: 35)
• EMA 3 Length (Default: 40)
• EMA 4 Length (Default: 45)
• EMA 5 Length (Default: 50)
• EMA 6 Length (Default: 60)
LONG CONDITION :
A long signal is triggered when all EMAs are perfectly aligned in ascending order:
EMA1 > EMA2 > EMA3 > EMA4 > EMA5 > EMA6
SHORT CONDITION :
A short signal is triggered when all EMAs are perfectly aligned in descending order:
EMA1 < EMA2 < EMA3 < EMA4 < EMA5 < EMA6
WHY IT IS UNIQUE:
Unlike traditional EMA crossover systems that rely on just 2 or 3 moving averages, The Maker Strategy uses 6 EMAs in sequence. This ensures that trades are only taken when there is clear and strong market momentum. The approach minimizes false signals in ranging markets and focuses on capturing trends with higher probability setups.
HOW USER CAN BENEFIT FROM IT :
• Clear entry alerts for both long and short positions.
• Visual confirmation through candle coloring and EMA band fills.
• Works on multiple timeframes and instruments (stocks, forex, crypto, indices).
• Helps traders stay on the right side of the trend while avoiding whipsaws.
• A simple yet effective tool for those who want a disciplined, rules-based strategy.
