Opposing Candle V2🟩 OC (Opposing Candle) Multi–Timeframe Framework
🔍 Overview
The OC Indicator automatically detects and displays Opposing Candles (OCs) across up to three timeframes.
An Opposing Candle is a candle that fully engulfs the previous one, signaling a potential shift in control — either a trend continuation or a trend reversal.
This multi–timeframe framework gives traders a structured way to visualize displacement, pullbacks, and momentum shifts between timeframes.
⚙️ How It Works
Each OC is drawn as a box showing:
High & Low → The candle’s full range
Open Line (black) → Key control level
Midline (white) → Candle equilibrium
Optional labels for timeframe and session
You can enable up to 3 timeframes (e.g., 30m / 1H / 4H) and adjust how many OCs to display for each.
📈 Trading Framework
🔹 Continuation Setup (Trend Following)
1. 4H Bias → Bullish or Bearish
Identify clear trend structure (HH/HL = bullish, LH/LL = bearish).
Confirm strong displacement and visible gaps between OCs — signs of momentum and healthy trend continuation.
2. 1H Confirmation OC
OC forms in the direction of the 4H bias, confirming control.
3. 30min Pullback OC
Opposite–colored OC appears → represents the pullback.
4. Entry Trigger
A yellow candle closes beyond the 30min OC open line, confirming the end of the pullback.
→ Enter in trend direction.
🎯 Targets
Target 1: Next 1H OC high or low (in trend direction)
Target 2: Next 4H OC high or low
🛑 Stop: Beyond the 30min OC’s opposite wick
🔹 Reversal Setup (Trend Shift)
1. 4H Structure → Extended or Losing Momentum
When there are no higher–timeframe gaps and no displacement, momentum weakens — often a sign of potential reversal.
2. Opposing OC Forms on HTF
A strong engulfing OC appears against the previous trend at a key structural level.
3. Lower–Timeframe Alignment
1H and 30min OCs begin forming in the new direction, confirming control shift.
4. Entry Trigger
Break of the lower–timeframe OC open line signals the reversal confirmation.
🟢 Example: Bullish Reversal
4H downtrend shows compression (no displacement)
4H bullish OC forms at support
30min breaks above a bearish OC’s open line → Go long
🔴 Example: Bearish Reversal
4H uptrend stalls at resistance
4H bearish OC forms
30min breaks below a bullish OC’s open line → Go short
🎯 Targets
Target 1: Nearest opposing 1H OC high/low
Target 2: Major 4H structural high/low
🛑 Stop: Beyond the reversal OC wick
🧠 Key Concepts
Displacement = Strength. Strong, impulsive moves with clear gaps between OCs show continuation.
Compression = Weakness. Overlapping candles and no HTF displacement often hint at reversal.
OC = Control Candle. The open line is the “line in the sand” — when price breaks it, control flips.
Multi–TF Confluence = Precision. 4H → 1H → 30m gives you structure → confirmation → entry accuracy.
🎨 Features
✅ Multi–Timeframe OC detection (default: 30m / 1H / 4H)
✅ Bullish & Bearish boxes with open and midlines
✅ Break candles highlighted yellow
✅ Optional labels (timeframe + session)
✅ Session filters (Asia, London, NYAM, NYPM)
✅ Fully customizable visuals and extension lengths
フラクタル

Aperturas Semanales Precisas (corregido)Identifica aperturas semanales del precio y resalta aperturas mensuales

Apertura SemanalIdentifica las aperturas semanales de cada grafico y resalta las aperturas mensuales

Dynamic Fractal Flow [Alpha Extract]An advanced momentum oscillator that combines fractal market structure analysis with adaptive volatility weighting and multi-derivative calculus to identify high-probability trend reversals and continuation patterns. Utilizing sophisticated noise filtering through choppiness indexing and efficiency ratio analysis, this indicator delivers entries that adapt to changing market regimes while reducing false signals during consolidation via multi-layer confirmation centered on acceleration analysis, statistical band context, and dynamic omega weighting—without any divergence detection.
🔶 Fractal-Based Market Structure Detection
Employs Williams Fractal methodology to identify pivotal market highs and lows, calculating normalized price position within the established fractal range to generate oscillator signals based on structural positioning. The system tracks fractal points dynamically and computes relative positioning with ATR fallback protection, ensuring continuous signal generation even during extended trending periods without fractal formation.
🔶 Dynamic Omega Weighting System
Implements an adaptive weighting algorithm that adjusts signal emphasis based on real-time volatility conditions and volume strength, calculating dynamic omega coefficients ranging from 0.3 to 0.9. The system applies heavier weighting to recent price action during high-conviction moves while reducing sensitivity during low-volume environments, mitigating lag inherent in fixed-period calculations through volatility normalization and volume-strength integration.
🔶 Cascading Robustness Filtering
Features up to five stages of progressive EMA smoothing with user-adjustable robustness steps, each layer systematically filtering microstructure noise while preserving essential trend information. Smoothing periods scale with the chosen fractal length and robustness steps using a fixed smoothing multiplier for consistent, predictable behavior.
🔶 Adaptive Noise Suppression Engine
Integrates dual-component noise filtering combining Choppiness Index calculation with Kaufman’s Efficiency Ratio to detect ranging versus trending market conditions. The system applies dynamic damping that maintains full signal strength during trending environments while suppressing signals during choppy consolidation, aligning output with the prevailing regime.
🔶 Acceleration and Jerk Analysis Framework
Calculates second-derivative acceleration and third-derivative jerk to identify explosive momentum shifts before they fully materialize on traditional indicators. Detects bullish acceleration when both acceleration and jerk turn positive in negative oscillator territory, and bearish acceleration when both turn negative in positive territory, providing early entry signals for high-velocity trend initiation phases.
🔶 Multi-Layer Signal Generation Architecture
Combines three primary signal types with hierarchical validation: acceleration signals, band crossover entries, and threshold momentum signals. Each signal category includes momentum confirmation, trend-state validation, and statistical band context; signals are further conditioned by band squeeze detection to avoid low-probability entries during compression phases. Divergence is intentionally excluded for a purely structure- and momentum-driven approach.
🔶 Dynamic Statistical Band System
Utilizes Bollinger-style standard deviation bands with configurable multiplier and length to create adaptive threshold zones that expand during volatile periods and contract during consolidation. Includes band squeeze detection to identify compression phases that typically precede expansion, with signal suppression during squeezes to prevent premature entries.
🔶 Gradient Color Visualization System
Features color gradient mapping that dynamically adjusts line intensity based on signal strength, transitioning from neutral gray to progressively intense bullish or bearish colors as conviction increases. Includes gradient fills between the signal line and zero with transparency scaling based on oscillator intensity for immediate visual confirmation of trend strength and directional bias.
All analysis provided by Alpha Extract is for educational and informational purposes only. The information and publications are not meant to be, and do not constitute, financial, investment, trading, or other types of advice or recommendations.

Previous D/W/M HLOCHey traders,
Here's a simple Multi-Timeframe indicator that essentially turns time and price into a box. It'll take the previous high, low, opening price, or closing price from one of the three timeframes of your choice (day, week, or month). For whatever reason I can't get the opening price to function consistently so if you find improvements feel free to let me know, this will help traders who prefer to use opening price over closing price.
Naturally this form of charting is classical and nature and some key figures you could use to study its usage are
- Richard W. Schabacker (1930s)
- Edwards & Magee (1948)
- Peter Brandt
- Stacey Burke (more on the intraday side - typically our preference)
It's usage put plainly:
- Quantifying Accumulation or Distribution
- Revealing Energy Build-Up (Compression)
- Framing Breakouts and False Breakouts
- Structuring Time
- Identifying opportunities to trade a daily, weekly, or monthly range.

Auto HTF Candles [@gaucho_trader][Auto HTF Candles
(Title)
Tired of constantly switching between timeframes? 🔄 This indicator solves that problem by bringing Higher Timeframe (HTF) context directly onto your current chart.
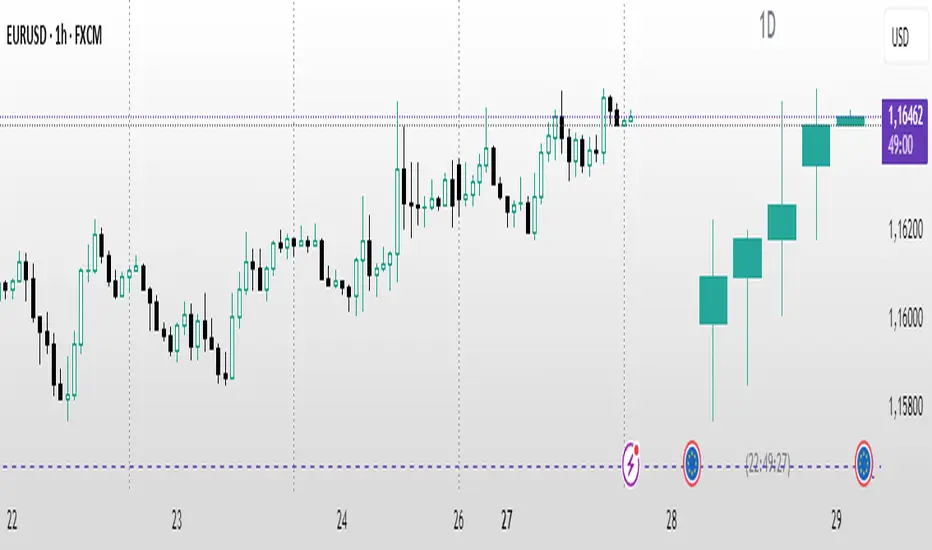
Auto HTF Candles plots up to three different sets of HTF candles in a clean, non-intrusive panel on the right side of your screen. Now you can watch a 4H candle develop while analyzing price action on a 5-minute chart, all in one view.
Core Concept 🎯
The principle is simple: your lower timeframe (LTF) trading decisions become significantly more powerful when aligned with the HTF trend and structure. By displaying the live HTF candles, you can instantly see if the current LTF move is a weak pullback against a strong HTF candle or a powerful breakout from an HTF consolidation. This indicator provides that essential macro context without ever leaving your main chart.
Key Features 📊
📈 Display Multiple Timeframes: Plot up to three fully independent higher timeframes simultaneously (e.g., 15m, 1H, and 4H).
🤖 Automatic HTF Selection: Enable the "Auto-Adjust HTF 1" feature, and the script will intelligently select a logical higher timeframe for you based on your current chart.
⏳ Real-Time Countdown Timer: Each timeframe displayed includes a timer showing the exact time remaining until the current HTF candle closes. This is crucial for anticipating end-of-candle volatility.
🎨 Fully Customizable Appearance: You have complete control over the visual style. Adjust colors, candle width, spacing, and the padding from the live price.
✨ Clean & Organized Layout: The candles are neatly arranged to the right of the current price, ensuring your main chart remains clear and unobstructed.
How to Use It 💡
Context is King: Use the HTF candles to define your bias. If the 4H candle is strongly bullish, you can look for more confident long entries on your 5m chart.
Identify Key Levels in Real-Time: Watch the highs and lows of the HTF candles as they form. These levels often act as powerful intraday support and resistance.
Anticipate Reversals: Is the 1H candle approaching its close and printing a long upper wick? This could signal a potential reversal, giving you a heads-up before the pattern is obvious on the LTF.
Streamline Your Workflow: Use the "Auto-Adjust" feature for a dynamic analysis setup. As you switch between different charts, your most relevant HTF context will follow you automatically.
Main Settings ⚙️
HTF 1, 2, 3: Enable and select up to three custom timeframes and set how many recent candles you want to display for each.
Auto-Adjust HTF 1: The star of the show. Toggle this on to let the script automatically select the first HTF based on your chart's period.
Styling: A comprehensive section to modify all colors, candle width, and the spacing between candles and timeframes.
Label Settings: Independently control the visibility, color, and size of the HTF name labels and the countdown timers.
⚠️ Disclaimer
This indicator is a tool for market analysis and should not be considered financial advice. Trading involves significant risk. Always perform your own due diligence before making any trading decisions.
Automatic Higher Timeframe Dividers [@gaucho_trader]🧭 Overview
The HTF Separators (auto) indicator automatically draws vertical lines marking the start of each candle belonging to a higher–timeframe (HTF).
This allows you to visually identify the boundaries of higher–timeframe candles within your current chart — an essential concept for multi–timeframe (MTF) analysis.
For example:
On a 15-minute chart, each line marks the start of a new 4-hour candle.
On a 1-hour chart, the lines show where each daily candle begins.
On a daily chart, they highlight the start of each month.
These vertical separators help you recognize moments when price often reacts or shifts, since the open of a new higher-timeframe candle frequently aligns with impulses, reversals, or structural changes.
⚙️ Main Features
✅ Automatic timeframe mapping:
1m → 15m
3m → 30m
5m → 1H
15m → 4H
1H → 1D
4H → 1W
1D → 1M
✅ Full customization:
Line color
Line width
Style (solid, dashed, or dotted)
✅ Optional HTF label:
Display a small label showing the detected higher timeframe (e.g. “HTF: 4H”).
🧩 How to use
Add the indicator to your chart.
Adjust the color, width, and style to your preference.
(Optional) Enable the label to display the current HTF being tracked.
Watch how vertical lines automatically appear whenever a new higher-timeframe candle starts.
This helps you align your trades and analysis with higher-timeframe structure, giving you a clearer understanding of market cycles and timing.
💡 Practical Example
If you trade on a 15-minute chart, each separator line represents the start of a 4-hour candle.
Use it to:
Understand the context of your current candle within the larger trend.
Spot key reaction points at HTF opens.
Time entries and exits around HTF shifts.
🧠 Best for
Traders using multi-timeframe analysis (MTF)
Intraday and swing traders seeking better HTF alignment
Anyone wanting a cleaner and more structured chart view
📈 Automatic Higher Timeframe Dividers is a lightweight, practical tool that brings clarity and temporal precision to your technical analysis — helping you instantly see where each major candle begins on your chart.

PO3-Goldbach Fractal levels [promuckaj]This script is developed on time & price, algorithmic market theory that is well explained in the book "Demystifying ICT" by Hopiplaka.
What is fractals Goldbach levels and why this indicator is different then the other one based on GB levels to.
Well, the whole idea behind this script was born long time a go, when I write the first, well known, indicator for GB levels. This script allow you to set one master/main PO3 GB number, usually the higher one, and then decide what fractal GB levels you want there within 12 partitions of main(higher one) PO3 dealing range.
That means that you can deal with every single partition level from main one, RB, OB, FV, LV, BR and MB, and look them through prism of GB levels reserved for each of them.
Indicator contain all the options to deal with lines, labels, colors etc, including options for non-goldbach and CE levels. All of them could be modify separately for main and fractal levels.
Here is one example, lets set main PO3 GB number for NQ to be 2187.
We can see that we are at the moment in discount MB partition, so now let’s do the magic and activate some of fractals there, for example for MB and BR in discount zone and zoom in the chart.
I hope it is more then clear how this could be used in your analysis and trading plan.

Candle Color Difference Marker (PSP)This indicator shows when the colors of the candles on two or three charts are different.
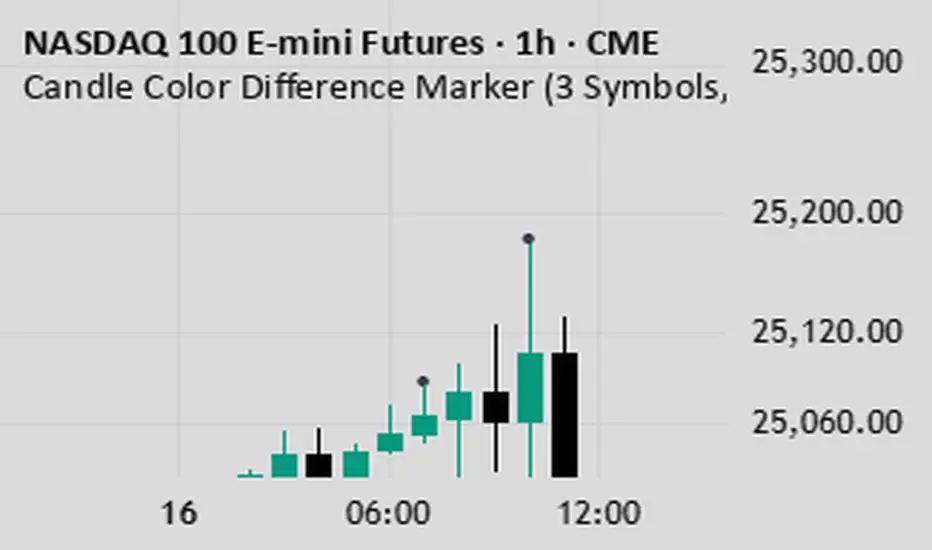
Charaf's PSPPrecision Swing Pair (PSP) is a correlation-based swing indicator that identifies divergence moments between two or three related assets (a “triad”). A PSP signal occurs when one asset’s candle closes bullish while another closes bearish — revealing potential swing turning points or short-term inefficiencies between correlated instruments such as indices, commodities, or FX pairs.
What It Does
Detects candle direction mismatches between correlated assets.
Marks PSP signals directly on the chart of your main asset.
Optional filters for volume, ATR, or momentum confirmation.
Helps traders catch early reversals, strength shifts, or pair-trading setups.
Works seamlessly across timeframes and correlated markets.
How It Works
You select a primary symbol (main chart) and secondary (or two others for triad setups).
PSP compares each candle’s close-to-open relationship:
If one asset closes bullish and another closes bearish, a PSP signal triggers.
Repeated divergence clusters often mark exhaustion zones or swing reversals.
Optional volatility or momentum filters help remove noise and refine signals.
Typical Use Cases
Triad trading: e.g., NAS100 / S&P500 / Dow — when one diverges, the weaker or stronger one tends to “catch up.”
Commodity pairs: e.g., Crude Oil / Gasoline / Heating Oil for refining spreads.
FX correlation setups: e.g., EURUSD vs GBPUSD.
Gold pairs: XAUUSD vs XAUEUR or XAUGBP.
How to Use PSP
Add the indicator to your main asset chart.
In the settings, enter the tickers of correlated assets you want to compare.
Adjust detection type (strict opposite closes or soft mismatch tolerance).
Optional: enable filters for ATR, RSI, or momentum.
Look for PSP signals at key structure zones — they often precede reversals or short-term dislocations.
Alerts
PSP Bullish Divergence: Primary bearish, secondary bullish.
PSP Bearish Divergence: Primary bullish, secondary bearish.
Custom alert messages are supported with placeholders for symbol and timeframe.
Recommended Markets
Indices triads (NAS100, SPX, DJ30)
Commodities triads (USOIL, RB1!, HO1!)
Metals triads (XAUUSD, XAUEUR, XAUGBP)
FX pairs (EURUSD, GBPUSD, USDCHF)
Inputs
Secondary symbol
(Optional) Third symbol for triad setups
Detection mode: strict / soft
Use ATR filter (on/off)
Use momentum filter (on/off)
Show markers (color, size, opacity)
Alert mode (on signal / on candle close)
How to Interpret
A PSP signal indicates misalignment — one asset leads, the other lags.
Often, the lagging asset will “catch up” in direction soon after.
Combine PSP signals with support/resistance or structure to identify swing reversals and momentum shifts.
Notes
PSP is not a buy/sell signal on its own — it’s a context tool for reading correlation behavior.
Best used with assets that historically move together (correlation > 0.7).
Test different timeframe alignments for your specific triad.
Example Workflow
Use PSP to identify divergence between NAS100 and SPX.
Confirm with price structure or RSI divergence.
Trade the “catch-up” move on the lagging asset once alignment resumes.
Changelog
v1.0 — Core divergence logic, 2-asset mode
v1.1 — Triad comparison support
v1.2 — Added volatility & momentum filters
v1.3 — Alert system & visual improvements
Tags:
correlation, divergence, indices, pair trading, spread, volatility, price action, structure, PSP, trading tools

GpPa - Φ Frames (V5.0.1)# GpPa — Φ Frames (V5.0.1)
**What it does**
This tool overlays nine “Phi Frames” on your chart. Each frame builds a dynamic price **box** from the **highest high** and **lowest low** over a user-defined lookback on a fixed timeframe. The boxes help you read structure, extremes, and balance zones across multiple scales in one view. No signals are generated.
**How it works (simple)**
* For every frame, the script requests data at a fixed resolution (e.g., 1D, 610m, 233m, 89m, etc.).
* It scans the last *N* bars at that resolution (your input).
* It draws a box from the start of that window to the current time, bounded by the window’s high and low.
* Optional “Re-Analysis Zone” guides project a vertical line into the future at a user-set offset, giving you a planning marker.
**Frames included**
* **M1** – 1D resolution (default length 258 bars)
* **M2** – 1D resolution (default length 160 bars)
* **M3** – 610-minute resolution (default length 233 bars)
* **M4** – 233-minute resolution (default length 377 bars)
* **M5** – 89-minute resolution (default length 610 bars)
* **M6** – 34-minute resolution (default length 987 bars)
* **M7** – 13-minute resolution (default length 1597 bars)
* **M8** – 5-minute resolution (default length 2584 bars)
* **M9** – 2-minute resolution (default length 4181 bars)
These durations follow a Fibonacci/Φ scheme. Using multiple frames together reveals confluence and nested ranges.
**Inputs & customization**
* **Per-frame controls:**
* *Length (bars)* — lookback window at the frame’s resolution.
* *Show/Hide* — toggle a frame on or off.
* *Color* — box border color.
* **Re-Analysis Zone (M4, M5, M6):**
* *Offset (bars)* — projects a future reference time from the right edge of the box.
* *Show/Hide* and *Color.*
* The line spans slightly above and below the box (+/-10% of its height) for visibility.
**Tips**
* Start with 2–3 frames to reduce clutter. Add more as needed.
* On lower chart resolutions, higher-timeframe boxes will “step” at their own closes.
* Use frames as context for your own entries, risk, and targets.
* Colors are semi-transparent by design so overlaps remain readable.
**Behavior & notes**
* Boxes update intrabar; values settle when the source timeframe closes.
* No alerts, signals, or strategy logic are included.
* Works on any symbol and timeframe.
* Overlay: **true**.
**Disclaimer**
This tool is for educational and informational purposes only. It is not financial advice. Always do your own research and manage risk.
**Credits**
Pine Script™ v6. © thewayofrichie.

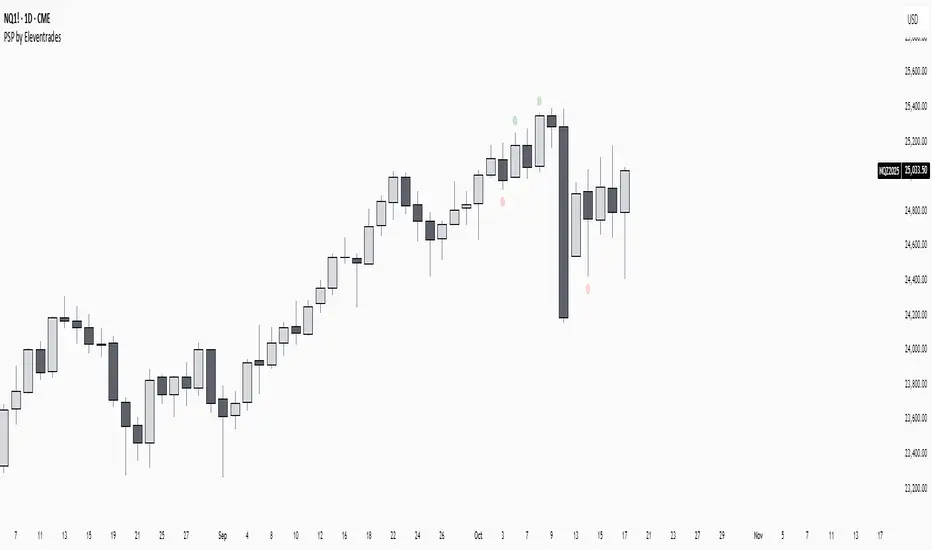
PSP by EleventradesPSP INDICATOR:
this is a free indicator i built that plots psp (precision swing point) on the chart in correlation with the related assets.
i’ve adjusted every setting and fixed every bug myself.
Gann Square Numbers S/R Levels This script can draw support and demand levels using Gann numbers of natural level.
Functions:
1: Default levels draw from natural numbrers 1 to 100.
2. can change minimum and maximum numbers of natural number. e.g min 50 and max 60. it will draw levels from 50 to 60.
3. You can filter levels of natural number by even and odd.
4. you can draw decimal levels of natural numbers also. e.g if natural number is 50
1.you can draw gann number for 50.01, 50.02, 50.03 , 50.04....
2. you can filter decimal points by odd, even, multiple of 3,5,10,20,25,50 also.

HTF CandlesThis Indicator allows you to display up to 10 higher timeframe candles.
One of them will always be the currently last candle (realtime candle if session is active). So if you choose to display only one candle it will be the current HTF candle. If you choose to display more than 1 candle it will be the current HTF candle plus the number of total candles minus one as historic candles (maximum 9 historic candles).
The goal is to simplify HTF analysis without the need to switch timeframes and detect HTF candle patterns while seeing the lower timeframe develop in realtime.
This is especially useful if you trade concepts like liquidity grabs/sweeps or any candle stick patterns and you want to utilize lower timeframe entries to maximize your risk to reward.
Setting Explanation
General Settings
# of Bars: Choose how many HTF candles you want to be displayed (maximum is 10).
Timeframe: Choose the timeframe that you want to be displayed.
Offset: Put in the number of bars you want to shift the HTF candles to the right (minimum is 0 which will result in a shift 3 bars to the right, to separate it from the current LTF candle). This way you can as well see 2 higher timeframes by applying the indicator twice to your chart and just shifting one timeframe so far to the right that it does not overlap the first HTF.
HTF Lines
Mark Start Of HTF Candles: If checked this will display lines according to the start of your HTF candles.
HTF Label
Show HTF Label: If checked you will see a label above the plotted HTF candles that tells you which timeframe it is.
Automatic Label Positioning: If checked your HTF Label will be 1 ATR above the highest HTF bar. This avoids putting in an absolute number which can be useful if you trade assets with vastly different prices (for example a 10 point distance will not sufficiently separate the label from the candles if trading BTC whereas a 100/500 point difference would put the label out of your screen if trading MNQ). By using the ATR the label will automatically be efficiently separated from the candles but not to far away.
Appearance
Body: Choose fill color for your bullish (left) and bearish (right) HTF candles.
Wick: Choose Wick/Border color for your HTF candles.
HTF Line: Choose color and line style for your HTF Lines (marking the start of a new HTF candle)
Label Position: Adjust the vertical distance of the label in regard to the highest high of the displayed HTF candles (This will be full points, not ticks, and is only used whenever "Automatic Label Positioning" is deselected).
Label Size: Adjust the font size of your HTF label.

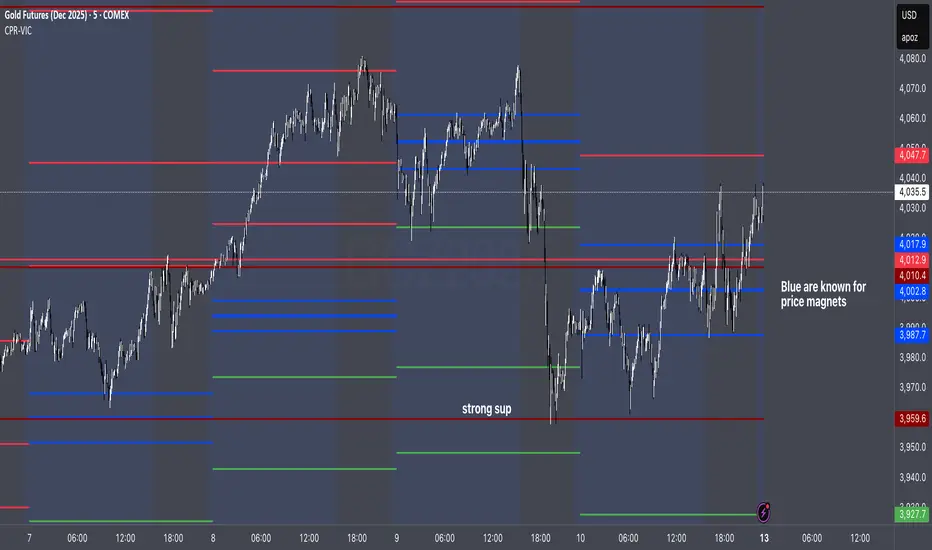
CPR by VictorVCentral Pivot Range
Where price is vs CPR
Above TC: bullish bias; TC/BC act as support. Hold above TC → trend day likely.
Inside CPR (BC–TC): balanced/choppy; expect mean reversion between edges until a clean break.
Below BC: bearish bias; BC/TC act as resistance.
Width of the CPR
Narrow: energy coiled → higher chance of breakout/trend day.
Wide: balanced market → range-bound behavior more likely.
Shift vs yesterday
CPR shifted up: bullish undertone.
Shifted down: bearish undertone.
Overlapping: neutral/indecisive.
Intraday tells
Acceptance: Several candles holding outside BC/TC = expansion in that direction.
Rejection: Wicks through BC/TC that close back inside = likely fade back toward the opposite edge.
Pivot (P) magnet: On non-trend days, price often gravitates back to P.
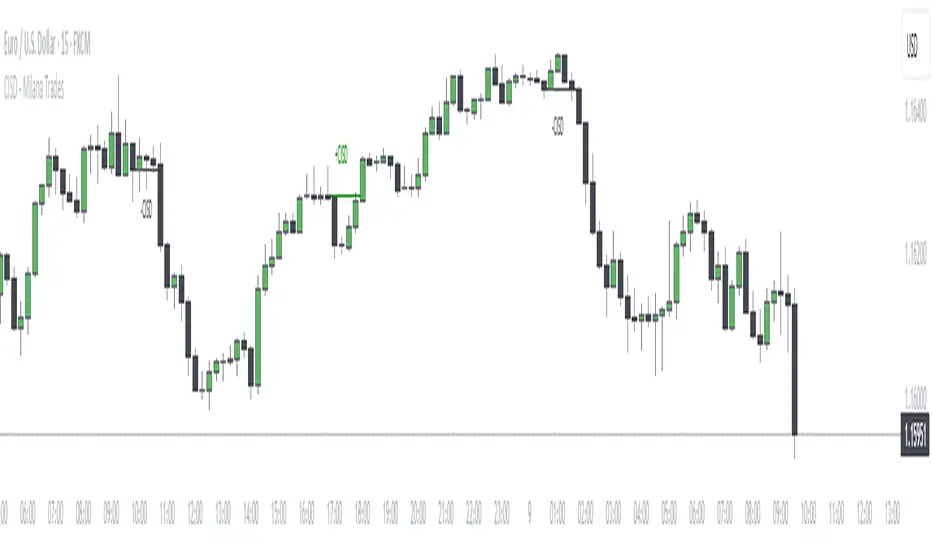
CISD + Fractals - Milana TradesThe CISD (Change in State of Delivery ) is a precision-engineered tool for identifying structural shifts within price action.
It algorithmically detects when price transitions from one swing direction to another — providing objective confirmation of market structure breaks that often precede trend reversals.
By mapping swing highs and lows, and visually marking breakpoints through CISD signals, this indicator enables traders to see the market’s internal structure in real time, without noise or subjective interpretation.
⚙️ Core Logic
The CISD algorithm uses a fractals-based structure recognition system to define market swings (high/low) and monitor for structural breaches.
Swing Identification
Using a configurable Pivot Strength parameter, the indicator detects significant local highs and lows based on price symmetry.
These pivots form the foundation of short-term and long-term structural reference points.
Execution Logic
Once a CISD is detected, the script dynamically projects a horizontal reference line at the validated structural level and plots a clear label (+CISD or –CISD) at the break location.
This provides an immediate, unobtrusive visualization of key structural events.
Visualization & Styling
The CISD interface is built for clarity and adaptability across all charting environments.
All stylistic parameters are fully customizable:
Pivot Strength – Sensitivity of swing identification
Fractal Visibility – Optional visualization of pivot origins
Bullish/Bearish Color Schemes – Independent line and text coloration
Line Style & Thickness – Adjustable for chart clarity
Label Size – Four-tier sizing (Tiny to Large) for multi-timeframe readability
Each CISD line maintains the context of structural order flow, allowing traders to visually differentiate active structure levels from historical breakpoints.
Alert System
The indicator integrates a fully functional alert module for automated market monitoring:
Any CISD – Alerts when any structural break occurs
Bullish CISD Formed – Alerts on bullish market structure shifts
Bearish CISD Formed – Alerts on bearish market structure shifts
These can be used for manual trade confirmation, smart alerts, or automated trading system triggers.
Fractals & SweepThe Fractals & Sweep indicator is designed to identify key market structure points (fractals) and detect potential liquidity sweeps around those areas. It visually highlights both Bill Williams fractals and regular fractals, and alerts the user when the market sweeps liquidity above or below the most recent fractal levels.
Fractal Recognition:
Detects both bullish (low) and bearish (high) fractals on the price chart.
Users can choose between:
Bill Williams fractal logic (default), or
Regular fractal logic (when the “Filter Bill Williams Fractals” option is enabled).
Fractals are plotted directly on the chart as red downward triangles for highs and green upward triangles for lows.
Fractal Tracking:
The indicator stores the most recent high and low fractal levels to serve as reference points for potential sweep detection.
Sweep Detection:
A bearish sweep is triggered when the price wicks above the last fractal high but closes below it — suggesting a liquidity grab above resistance.
A bullish sweep is triggered when the price wicks below the last fractal low but closes above it — suggesting a liquidity grab below support.
When a sweep occurs, the indicator draws a horizontal line from the previous fractal point to the current bar.
Alert System:
Custom alerts notify the trader when a bearish sweep or bullish sweep occurs, allowing for timely reactions to potential reversals or liquidity traps.

Ram HTF Direction & Market ProfileRam HTF Direction & Markey Profile.
I am trying to identify the HTF(Daily) Direction and Market profiles POC,VAL,VAH to trade on 1HR.

NINA Multi-TF Swings (W/D/H4/H1/M15)This indicator draws swing highs and lows of different timeframes on you current chart to identify as liquidity levels

Charles PO3# Charles PO3 - Release Notes
## 📊 Introduction
**Charles PO3** is a powerful PO3 (Power of 3) indicator designed for traders who need to simultaneously observe **Higher Time Frame (HTF)** price action on **Lower Time Frame (LTF)** charts.
This indicator draws multiple HTF candles on the right side of the chart and connects the current price to the HTF **Open, High, and Low** with dynamic projection lines. It helps you:
- View **Daily/Weekly** structure on a minute chart.
- Track HTF key price levels in **real time**.
- Better understand **multi-timeframe trend relationships**.
- Improve **timeframe consistency** in your trading decisions.
**Applicable Markets**: Forex, Futures, Stocks, Cryptocurrencies, and all other financial markets.
This script is based on the (www.google.com) created by (www.google.com).
This indicator is released under TradingViews default license (Mozilla Public License 2.0)
-----
## ✨ Core Features
### 🕐 Smart Timeframe Management
- **Automatic Timeframe Selection**: Automatically selects a suitable HTF based on the current chart period (optionally 1 or 2 levels of progression).
- **Manual Timeframe**: Supports custom selection of any timeframe (15 minutes, 1 hour, 4 hours, Daily, Weekly, etc.).
- **Custom Opening Time**: Supports custom HTF candle opening time and timezone (useful for non-standard trading sessions).
### 📈 Candle Display
- **Configurable Quantity**: Display 1-20 HTF candles (default 5).
- **Three Sizes**: Small, Medium, Large candles available.
- **Two Types**:
- Standard Candles
- Heikin Ashi (Smoothed Candles)
- **Custom Colors**:
- Bullish (Up) Candles: Independent color settings for body, wick, and border.
- Bearish (Down) Candles: Independent color settings for body, wick, and border.
- **Position Adjustment**: Adjustable offset from the right edge of the chart and spacing between candles.
### 🎯 Dynamic Projection Lines
- **Open Price Projection**: Extends from the HTF Open price to the center of the current candle.
- **High/Low Projection**: Extends from the HTF High/Low to the center of the current candle.
- **Real-Time Updates**: Projection lines automatically update their starting point upon price breakthrough.
- **Customizable Style**:
- Three line styles: Solid, Dashed, Dotted.
- Adjustable color and width.
- Independent On/Off switches.
### 🏷️ OHLC Price Labels
- **Real-Time Price Display**: Shows O/H/L/C prices to the right of the latest HTF candle.
- **Six Font Sizes**: Auto, Tiny, Small, Normal, Large, Huge.
- **Follows Candle Movement**: Label position updates dynamically with the candle.
### 🕒 Smart Time Labels
- **Adaptive Format**:
- **Daily**: Displays the day of the week (Mon, Tue, Wed...).
- **Weekly**: Displays Month-Day (10-05, 10-12...).
- **Other Timeframes**: Displays Hour:Minute (14:30, 21:00...).
- **Asset Type Recognition**:
- **Forex/Futures**: Automatically adjusts to display trading days (Mon-Fri).
- **Crypto**: Displays actual date (7 days a week).
- **Center Alignment**: Time label is positioned below the center of the candle.
- **Customizable Color**: Supports adjusting text color (default gray).
### 📊 HTF Data Mode
- **Weekly**: Only use HTF data to generate projections when on a weekly chart.
- **Always**: Always use HTF data.
- **Never**: Always use LTF data to construct the HTF candles.
### 🐛 Debug Tools
- **Debug Table**: Real-time display of indicator status (parameters, candle count, label count, etc.).
- **Pine Logs**: Detailed logs for timestamp conversions and label creation.
- **Optional Switch**: Debug features can be disabled in a production environment to improve performance.
-----
## ⚙️ Parameter Descriptions
### 📁 Settings (Basic Settings)
| Parameter | Type | Default | Description |
|---|---|---|---|
| **Timeframe** | Timeframe | Blank (Auto) | Sets the HTF timeframe; leave blank for automatic selection. |
| **Set Automatically** | Boolean | ✅ | Enables automatic timeframe selection. |
| **Two Levels** | Boolean | ✅ | Use 2 levels of progression (e.g., 15min→4H); off uses 1 level (15min→1H). |
| **Number of HTF Candles** | Integer | 5 | Number of HTF candles to display (1-20). |
| **Offset** | Integer | 10 | Bar offset of the candle group from the right edge of the chart. |
| **Size** | Option | Medium | Candle size: Small / Medium / Large. |
| **Type** | Option | Candles | Candle type: Candles (Standard) / Heikin Ashi (Smoothed). |
| **Margin** | Integer | 1 | Spacing between candles (in bars). |
| **Use HTF data to generate candles** | Option | Weekly | Weekly / Always / Never. |
### 🟢 Up Candles (Bullish Candles)
| Parameter | Type | Default | Description |
|---|---|---|---|
| **Body** | Color | \#6ba583 | Color for the bullish candle body. |
| **Wick** | Color | Black | Color for the bullish candle wick. |
| **Border** | Color | Black | Color for the bullish candle border. |
### 🔴 Down Candles (Bearish Candles)
| Parameter | Type | Default | Description |
|---|---|---|---|
| **Body** | Color | \#d75442 | Color for the bearish candle body. |
| **Wick** | Color | Black | Color for the bearish candle wick. |
| **Border** | Color | Black | Color for the bearish candle border. |
### 📏 Projections (Projection Lines & Labels)
#### Open Price Projection Line
| Parameter | Type | Default | Description |
|---|---|---|---|
| **Open** | Boolean | ✅ | Show Open price projection line. |
| ⚫ **Color** | Color | Translucent Black | Open price line color. |
| **Style** | Option | Dotted | Solid / Dotted / Dashed. |
| **Width** | Integer | 1 | Line width (1-5). |
#### High/Low Projection Lines
| Parameter | Type | Default | Description |
|---|---|---|---|
| **High/Low** | Boolean | ✅ | Show High/Low projection lines. |
| ⚫ **Color** | Color | Translucent Black | High/Low line color. |
| **Style** | Option | Dotted | Solid / Dotted / Dashed. |
| **Width** | Integer | 1 | Line width (1-5). |
#### OHLC Price Labels
| Parameter | Type | Default | Description |
|---|---|---|---|
| **OHLC Prices** | Boolean | ✅ | Show price labels. |
| ⚫ **Color** | Color | Translucent Black | Text color. |
| **Size** | Option | Auto | Auto / Tiny / Small / Normal / Large / Huge. |
#### HTF Time Labels
| Parameter | Type | Default | Description |
|---|---|---|---|
| **HTF Time** | Boolean | ✅ | Show time labels. |
| **Time Label Color** | Color | Gray | Time text color. |
### 🕐 Custom Opening Time (Custom Opening Time)
| Parameter | Type | Default | Description |
|---|---|---|---|
| **Use Custom Opening Time?** | Boolean | ❌ | Enable custom opening time. |
| **Timezone** | Option | Exchange | Timezone selection (using Timezone library). |
| **Time (hh:mm)** | Time | 02:00 | Custom opening time (hour:minute). |
### 🐛 Debug (Debugging)
| Parameter | Type | Default | Description |
|---|---|---|---|
| **Enable Debug Info** | Boolean | ❌ | Enable Pine Logs for detailed logging. |
| **Show Debug Table** | Boolean | ✅ | Display the debug info table in the top right corner. |
-----
## 🎓 Usage Recommendations
### Recommended Timeframe Combinations
- **1-Minute Chart** → HTF: 15 Minutes
- **5-Minute Chart** → HTF: 1 Hour
- **15-Minute Chart** → HTF: 4 Hours
- **1-Hour Chart** → HTF: Daily
- **4-Hour Chart** → HTF: Weekly
- **Daily Chart** → HTF: Weekly/Monthly
### Best Practices
1. **Trend Trading**: Use the Daily HTF on a 1-Hour chart to ensure you are trading with the higher-timeframe trend.
2. **Support/Resistance**: The HTF High/Low projection lines serve as natural support and resistance levels.
3. **Open Breakout**: Observe the HTF Open price projection line to catch directional breakouts after the open.
4. **Time Synchronization**: Use the time labels to understand the lifecycle stage of the HTF candle.
5. **Multi-Timeframe Confirmation**: Observe multiple HTF candles simultaneously to confirm trend consistency.
-----
## 📌 Version Information
- **Version**: 1.0
- **Pine Script**: v6
- **Dependency Library**: `n00btraders/Timezone/1`
- **Chart Limitations**:
- Max historical bars: 500
- Max Box objects: 500
- Max Label objects: Default (TradingView limit)
-----
**Happy Trading\! 📈**

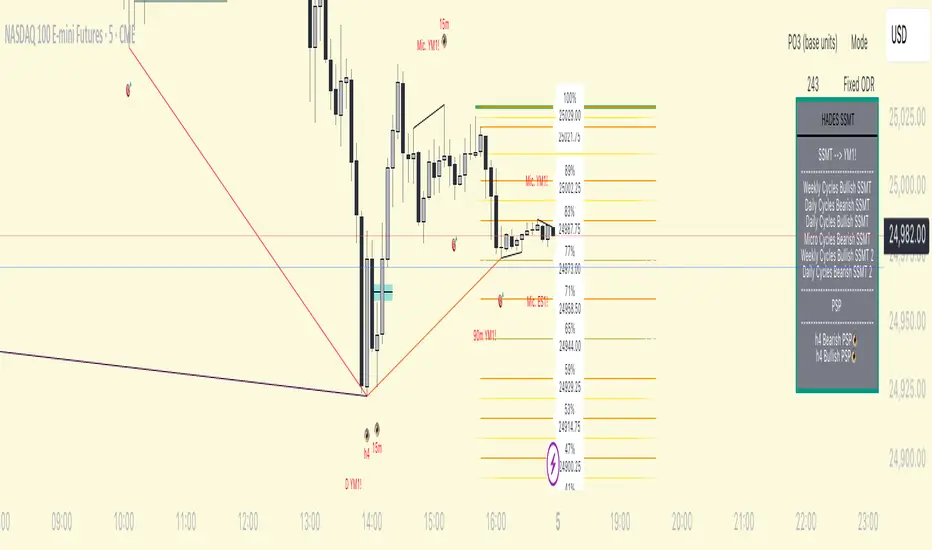
HADES Timecycle SMTWhat this indicator tracks
1) Time‑cycles based on QT (Micro → 90‑minute → Daily → Weekly)
HADESSMT segments the trading day and week into recurring phases and paints them directly on your chart:
real time plotting of SSMTs for Micro cycles, when Q1 and Q2 highs or lows are different for correlated assets. same for the 90‑minute quarters , Daily cycles and Weekly cycles
2) SSMT : The script continuously compares your chart to a correlated instrument and highlights cycle‑scoped SMT divergences :
Scopes: Micro, 90m, Daily, Weekly.
The tool draws compact slanted segments between consecutive cycle highs/lows and places a small label with the scope tag (e.g., 90m, D, W, Mic.) and the comparison ticker.
Table summary: A docked panel logs Bullish/Bearish SMT currently active per scope.
In plain English: when two tightly related markets fail to confirm each other’s new extremes inside the same cycle window, HADESSMT calls that out visually and in the table.
3) PSP /scanner (👁️)
A compact scanner runs on 240m, 60m, and 15m composite views of your chosen inter‑market set and tags bars with an eye icon (👁️):
👁️ below price → a bullish turning‑point signature.
👁️ above price → a bearish turning‑point signature.
Events are logged in the table (e.g., “60m Bullish PSP 👁️”).
Treat PSP tags as context—they’re not trade signals by themselves. They often add confluence when they align with SSMT and cycle boundaries.
4) “True Open” levels
includes a daily open line that marks midnight open for the day.
Inter‑market sets (Triads & Dyads)
HADESSMT automatically picks a comparison instrument based on what you’re charting. Two mechanisms exist:
Triads (auto‑pairing):
FX: EUR + GBP ↔ inverse DXY
Metals: Gold + Silver
US Indices: NQ + YM + ES
You can show one or both comparison legs.
Tip: If you don’t see SMT labels, ensure your symbol belongs to one of the configured sets or customize the tickers in Triad inputs.
On‑chart visuals you’ll see
Thin slanted SMT markers between successive cycle extremes with a small scope/ticker tag.
👁️ PSP labels on higher‑timeframe bars.
True‑Open lines labeled 00:00 (daily) .
Summary table (right side by default) containing:
The comparison ticker currently in use,
Any active Bullish/Bearish SMT per scope,
Recent PSP 👁️ calls at 240/60/15 minutes.
How to use it (practical flow)
Pick your market & ensure a comparison exists (Triad ).
Important: HADESSMT is a context engine, not a trade system. Use your own risk management and confirmation.
Triad– enable one/both SMT comparisons; edit the default tickers if your broker symbols differ.
Timezone – UTC offset (default -4) to align cycle splits with your session.
Micro features appear on charts ≤ 5m.
90‑minute features are designed for charts ≤ 30m.
Daily features prefer charts ≤ 3h.
Weekly features render reliably on daily charts and below.
(If a layer doesn’t appear, you may be on a timeframe above its designed threshold.)
FAQs
Why don’t I see SMT on my market?
Ensure the symbol is in one of the configured Triad sets, or add your own correlated ticker(s).
What exactly is PSP?
A compact pressure/turn signature across your inter‑market set. It’s presented as an 👁️ tag and a table entry (bullish/bearish). The internal detection specifics are intentionally abstracted.
HM2 - Murrey Math Levels# Murrey Math Indicator - Comprehensive Description
## **What is Murrey Math?**
Murrey Math is a trading system developed by T.H. Murrey that divides price action into 8 equal segments (octaves) based on Gann and geometry principles. It automatically identifies key support and resistance levels where price is likely to react, making it a powerful tool for determining entry/exit points and price targets.
## **How It Works**
The indicator:
1. **Analyzes price history** over a lookback period (default 64-200 bars)
2. **Finds the highest high and lowest low** in that period
3. **Calculates a "fractal"** - a geometric scaling factor based on price magnitude
4. **Creates 8 equal divisions** between key levels, plus 4 overshoot levels (total 13 levels)
5. **Labels each level** from -2/8 to +2/8 with their trading significance
## **The 13 Murrey Math Levels**
### **Core Levels (0/8 to 8/8):**
- ** - Ultimate Support** (Blue)
- Extreme oversold condition
- Strong buying opportunity
- Price rarely breaks below this
- ** - Weak, Stall & Reverse** (Orange)
- Weak support level
- Price often stalls and reverses here
- ** - Pivot/Reverse Level** (Red)
- Major support that can become resistance
- Important reversal zone
- ** - Bottom of Trading Range - BUY Zone** (Green)
- Bottom boundary of normal trading
- **Premium BUY zone** - 40% of trading happens between 3/8 and 5/8
- ** - Major Support/Resistance** (Blue)
- **THE MOST IMPORTANT LEVEL**
- The midpoint - best entry/exit level
- Strong pivot point that price respects
- ** - Top of Trading Range - SELL Zone** (Green)
- Top boundary of normal trading
- **Premium SELL zone**
- ** - Pivot/Reverse Level** (Red)
- Major resistance that can become support
- Important reversal zone
- ** - Weak, Stall & Reverse** (Orange)
- Weak resistance level
- Price often stalls and reverses here
- ** - Ultimate Resistance** (Blue)
- Extreme overbought condition
- Strong selling opportunity
- Price rarely breaks above this
### **Overshoot Levels:**
- ** & ** (Gray) - Extreme downside overshoot zones
- ** & ** (Gray) - Extreme upside overshoot zones
- These indicate extreme moves beyond normal trading ranges
## **Trading Zones (from your diagram)**
1. **Consolidation Trading Area** (0/8 to 3/8)
- Price is in a bearish zone
- Look for BUY opportunities near support levels
2. **Normal Trading Area** (3/8 to 5/8)
- **40% of trading occurs here**
- Price oscillates between these boundaries
- Range-bound trading strategies work best
3. **Premium Trading Area** (5/8 to 8/8)
- Price is in a bullish zone
- Look for SELL opportunities near resistance levels
## **Trading Strategies**
### **Buy Signals:**
- Price bounces off 0/8 (ultimate support)
- Price pulls back to 3/8 in an uptrend
- Price breaks above 4/8 after consolidation
### **Sell Signals:**
- Price rejects at 8/8 (ultimate resistance)
- Price rallies to 5/8 in a downtrend
- Price breaks below 4/8 after consolidation
### **Range Trading:**
- Buy near 3/8, sell near 5/8 when price is ranging
- Use 4/8 as the pivot to determine trend direction
## **Key Advantages**
✅ **Objective levels** - No subjective placement
✅ **Self-adjusting** - Automatically recalculates based on recent price action
✅ **Clear trading zones** - Easy to identify support/resistance
✅ **Works on all timeframes** - From 1-minute to monthly charts
✅ **Combines with other indicators** - Works well with RSI, MACD, etc.
## **Important Notes**
- The indicator is **dynamic** - levels update as new highs/lows form
- **4/8 is the most critical level** - price above = bullish, below = bearish
- When price reaches overshoot levels (±1/8, ±2/8), expect strong reversals
- Works best in trending markets; can give false signals in choppy conditions
This geometric approach to support/resistance has been used by traders for decades and remains popular due to its objective, mathematical nature!

BluePrint SessionsBlueprint Sessions is a multi-session visual tool designed to help traders identify the three most important global market opens with precision.
Features:
Adaptive to chart timezone — sessions automatically adjust to the time zone you select in TradingView.
Three Key Market Sessions:
Asian Session
London Session
New York Session
