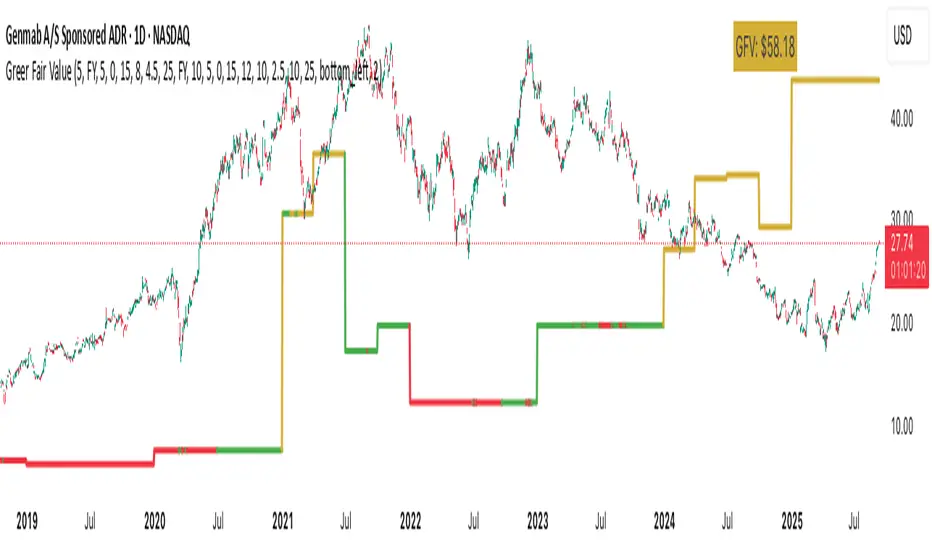
Greer Fair Value✅ Greer Fair Value
Greer Fair Value: Graham intrinsic value + Buffett-style DCF with auto EPS/FCF and auto growth (CAGR of FCF/share), defaulting to a simple GFV badge that color-codes opportunity at a glance.
📜 Full description
Greer Fair Value is inspired by the valuation frameworks of Benjamin Graham and Warren Buffett. It combines Graham’s rate-adjusted intrinsic value with a two-stage, per-share DCF. The script auto-populates EPS (TTM) and Free Cash Flow per share (FY/FQ/TTM) from request.financial(), and can auto-estimate the near-term growth rate (g₁) using the CAGR of FCF/share over a user-selected lookback (with sensible caps). All assumptions remain editable.
Default view: only the GFV badge is shown to keep charts clean.
Badge color logic:
Gold — both DCF and Graham fair values are above the current price
Green — exactly one of them is above the current price
Red — the current price is above both values
Show more detail (optional):
Toggle “Show Graham Lines” and/or “Show DCF Lines” to plot fair values (and optional MoS bands) over time.
Toggle “Show Dashboard” for a compact data table of assumptions and outputs.
Optional summary label can be enabled for a quick on-chart readout.
Inputs you can customize: EPS source/manual fallback, FCF/share source (FY/FQ/TTM), g₁ auto-CAGR lookback & caps, terminal growth gT, discount rate r, MoS levels, step-style plots, table position, and decimals.
Note: TradingView’s UI controls whether “Inputs/Values in Status Line” are shown. If you prefer a clean status line, open the indicator’s settings and uncheck those options, then Save as default.
Disclaimer: For educational/informational purposes only; not financial advice. Markets involve risk—do your own research.
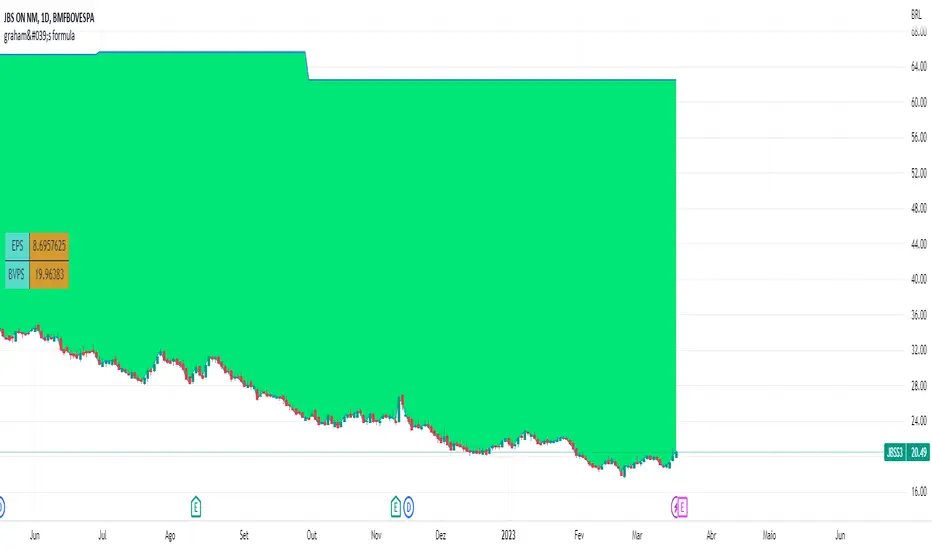
Graham
graham's formulaThis indicator plots a line with the fair value of the stock following Graham's formula, VI = √ (22.5 x EPS x BVPS)
coloring the space between the closing price of the stock and the fair value.
It also presents a table containing the last EPS and the last BVPS of the stock.
The Benjamin Graham formula is a formula for the valuation of growth stocks.
It was proposed by investor and professor of Columbia University, Benjamin Graham - often referred to as the "father of value investing".
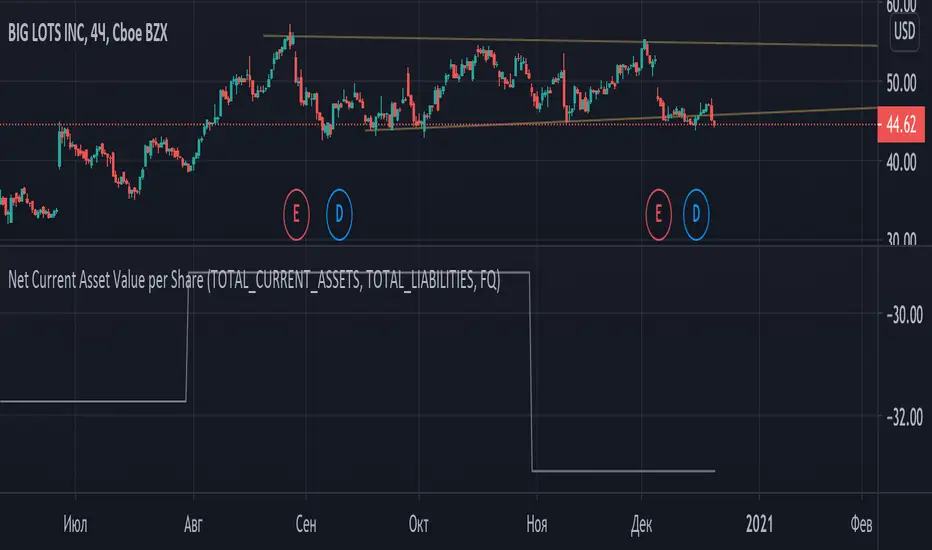
Graham Net Current Asset Value per ShareNet current asset value per share (NCAVPS) is a measure created by Benjamin Graham as one means of gauging the attractiveness of a stock. A key metric for value investors, NCAVPS is calculated by taking a company's current assets and subtracting total liabilities.
NCAVPS = Current Assets - (Total Liabilities + Preferred Stock) ÷ Shares Outstanding.
According to Graham, investors will benefit greatly if they invest in companies where the stock prices are no more than 67% (or 2/3) of their NCAV per share (price <= (2/3)*NCAV).
Coloring pattern:
- price <= (1/3)*ncav -> light green
- (1/3)*ncav < price <= (2/3)*ncav -> green
- (2/3)*ncav < price <= ncav -> dim red
- price > ncav -> red
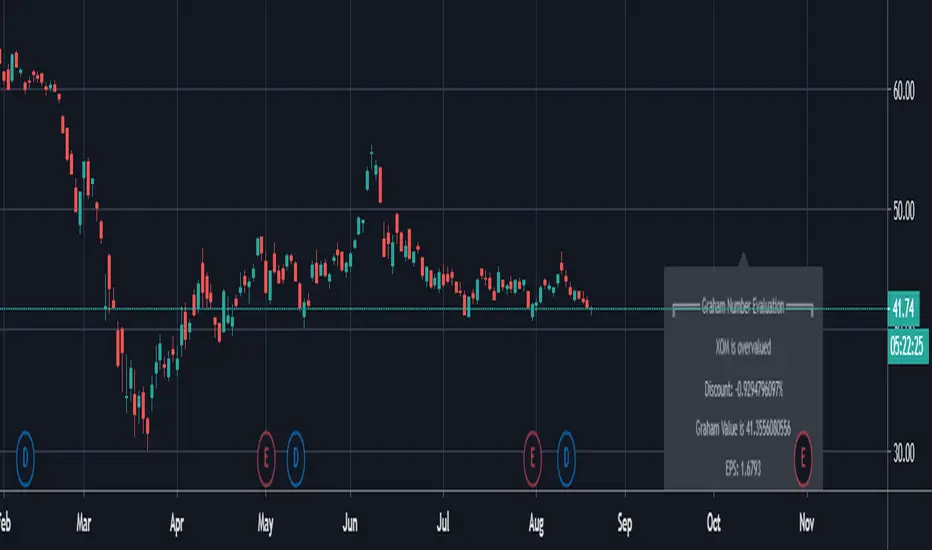
Graham NumberGraham Number is named after the “father of value investing,” Benjamin Graham, who was a mentor of Warren Buffett. The figure takes into account earnings per share and book value per share to measure a stock's maximum fair market value. In other words, it is the upper end of the price range that a defensive investor should pay for the stock.
The Graham Number = Square Root of (22.5) x (tmm EPS) x (mrq Book Value per Share).
The 22.5 is included in the formula as a rule of thumb to account for Graham's assumption that the price-to-earnings ratio should not be over 15 and the price to book ratio should not be over 1.5 for an undervalued stock. So, the number is generated as (P/E of 15) x (P/B of 1.5) = 22.5.
So the script generates a Graham number plot.

Graham FormulaThis is an Tradingview implementation of the Grahams Formula as described in Benjamin Grahams book "The Intelligent Investor".
In theory this can be used to screen for over- and undervalued stocks, however as Graham himself notes, you should look into other fundamentals when using them in conjunction with Grahams formula.
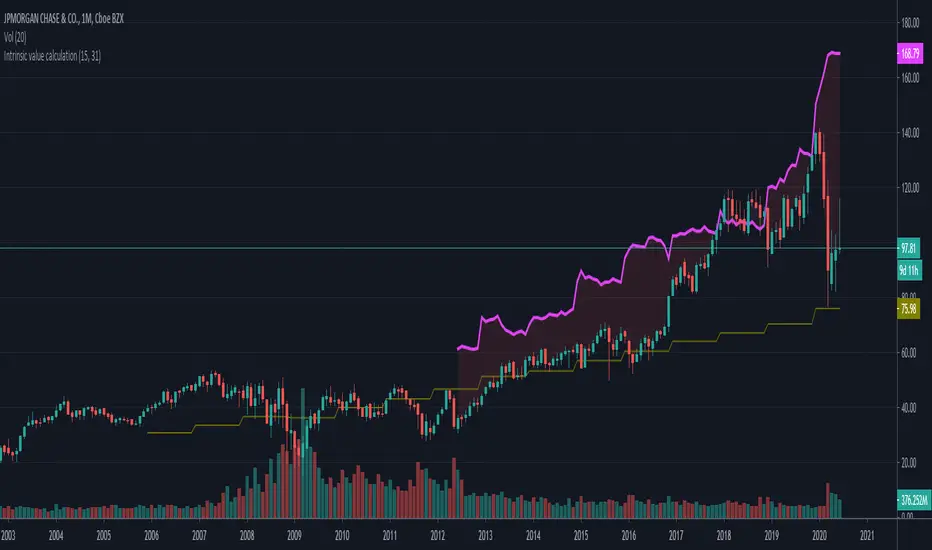
Intrinsic value calculation Intrinsic value calculator based on Warren Buffet's and Ben Graham's work
In value investing determing the true value of a COMPANY instead of a stock price is crucial.
This little indicator shows the "Intrinsic value" of the choosen stock meaning the value of the stock in 10 years time. Calculation is based on historical book value's average annual growth rate and dividends paid.
Since this is about long therm investing, use monthly charts.
"Intrinsic value can be defined simply: It is the discounted value of the cash that can be taken out of a business during its remaining life.”
– Warren Buffett
One way to calculate that is by the growth in per share book value and dividends taken in the forseeable future (10 years) than discount it with the prevailing 10 year note's rate.
In the inputs you have to set 2 variables:
1. How many years back you have the first data for book value per share available?
2. What was the per share book value that year?
(Bookvalue is ploted in olive colour and you can get the oldest one if you move your cursor over the latest data on the left)
CAUTION! You have to reenter it for every stock you analyse as this is stock-specific data!
After setting the input data, you will see the "Intrinsic Value"'s pink curve ploted over the price chart.
If the price is well below the pink line, the company is undervalued and can be a possible applicant for long therm investment.
Margin of safety: when the current price is 50% below the intrinsic value that means a 10% yearly growth potential (100% growth in 10 years) or a 100% margin of safety.
I am a beginer in Pine so please excuse my coding...
If anybody knows hot to extract historical data from 15 years ago, please share it with me, so I can automate the whole calculation without inputs necessary.