Fear & Greed [Zofesu]🎯Fear & Greed
In a world full of noise, most traders fail because they enter the market when emotions are at their peak. Fear & Greed is not just an indicator; it is a sentiment-calibration engine. It is designed to identify "Institutional Overheating" — those rare moments when the market is so overextended that a reversal or a massive liquidity sweep is inevitable.
🧠 How it Works
The engine uses a Percentile Rank Algorithm to compare current price action and volume against a 300-bar historical baseline. It filters out the "retail noise" and only triggers when both price volatility and volume reach extreme levels.
🛠️ Core Components
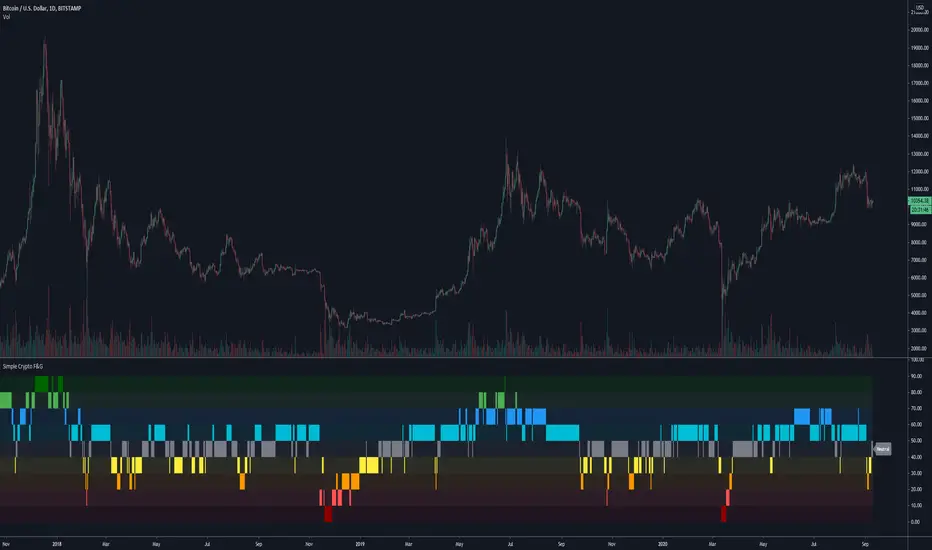
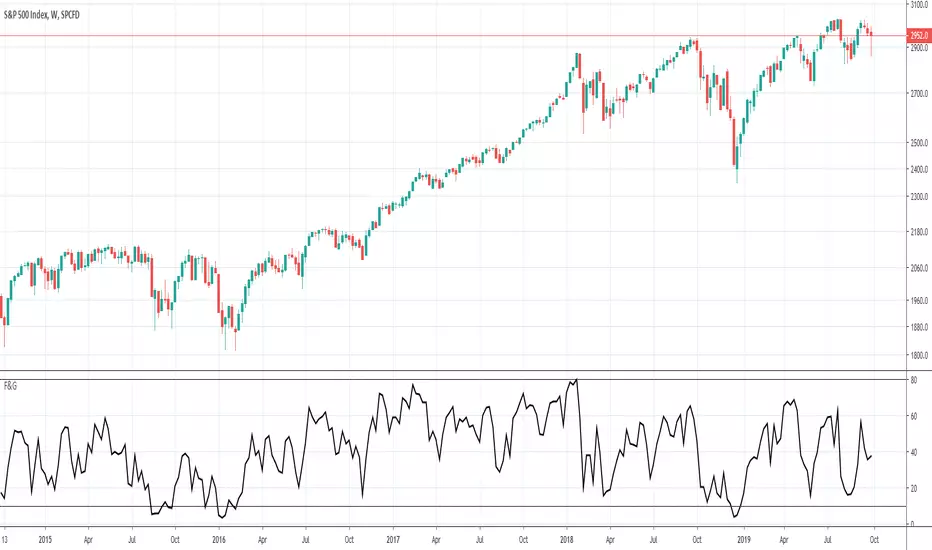
📊 White Candles (The Signal): When a candle turns white, the market has reached a state of emotional exhaustion. It means the price is in the 94th percentile of extremes, backed by a 98th percentile volume. These are your "Pay Attention" zones.
⚡ Small Dots (Local Peaks): Green (Greed) or Red (Fear) dots mark the exact bar where the sentiment reached its local maximum.
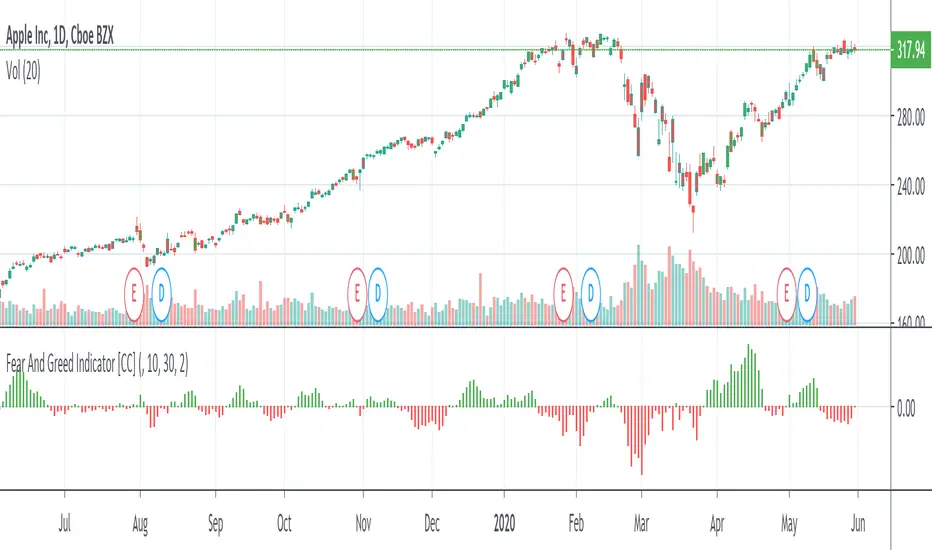
⚓ HTF Tags (G/F Labels): These are your "Macro Compass." They show the Fear (F) or Greed (G) from a Higher Timeframe (e.g., 8H). Trading a local Fear signal while the HTF is also in Fear increases your probability of catching a major market bottom.
⚙️ Strategic Application
Liquidity Sweeps: Look for White Candles to appear just as the price hits a major support or resistance level. This often signals a "Final Flush" before a reversal.
The Wait: As a disciplined trader, do not chase the first white candle. Wait for the Exhaustion. When the white candles stop appearing and the "Dot" is placed, look for your entry where the retail stop-losses were just triggered.
Trend Confirmation: Use the HTF Tags to ensure you are not fighting the "Big Boys." If the HTF shows "G" (Greed), be very careful with shorting, even if you see a local greed peak.
🚀 Technical Settings (Zofesu Optimized)
Target Volume Percentile (97%): Only the most significant volume spikes are considered.
Historical Sample (200): A balanced window that adapts to current market volatility without being Laggy.
HTF (1Week): Provides a week bird's-eye view, perfect for D1 trading.
📚 Experience and practice
The only limitation is that it is harder to find a top than a bottom. Especially on stocks that are booming. Don't try to look for a signal at all costs. Don't be afraid to have strict conditions.
When you are on D1, set the sensitivity to 99, turn on the week, then set the history to 200 or 800. Proceed in whole 100s. When you find F/G signals, start reducing the sensitivity to 98-97-.... Then on the D1 chart you can also look at what is happening on lower time frames. You will switch the HTF downwards D1-H4-....
💡 When you find good results and a setting that suits you, save it in a template that is implemented in TradingView. Use both the symbol and the interval. If you trade something regularly, you will have it ready in the future. Have fun.
⚠️ Disclaimer
Past performance does not guarantee future results. Always use proper risk management. Designed for disciplined traders who value quality over quantity.
Pine Script® インジケーター