Extreme HMA ATR BandsExtreme HMA ATR Bands
Extreme HMA ATR Bands are a fast and smooth trend-following tool designed to capture directional moves while minimizing false signals across volatile markets.
🚀 Benefits
• High responsiveness to market moves
• Smooth trend tracking with fewer false signals
• Strong performance on assets such as SOLUSD, SUIUSD, and CROUSD
• Clear visual band structure for easier market interpretation
💡 Core Idea
The indicator builds adaptive bands around a smoothed price structure derived from Hull-type processing. By focusing on extreme values and combining them into a balanced midpoint, the bands capture trend direction while maintaining smooth behavior.
ATR is then applied to dynamically scale the bands according to market volatility.
⚙️ How It Works
A fast-smoothed price series is calculated using Hull-style logic.
Highest and lowest values of this series are measured over multiple stages.
These extremes are processed again to balance responsiveness and smoothness.
The resulting midpoint forms the base trend line.
ATR is added and subtracted from this midpoint to generate adaptive upper and lower bands.
The result is a fast yet stable band structure that reacts efficiently to market direction changes.
📌 Usage Notes
• Price moving above the upper band suggests bullish pressure.
• Price moving below the lower band suggests bearish pressure.
• Band expansion signals increasing volatility.
• Band contraction often indicates consolidation phases.
Enjoy and trade smart.
ハル移動平均 (HMA)

Stabilized HMA ScalperStabilized HMA Scalper / Stab. HMA 2.0
Stabilized HMA Scalper is a visual trend-structure overlay indicator designed to highlight directional momentum, trend alignment, and market state through a combination of adaptive moving averages and contextual visual cues.
The indicator blends a Hull Moving Average (HMA) for responsiveness with an ALMA-based baseline filter to stabilize trend interpretation and reduce noise. The result is a clean, visually expressive framework for reading market structure directly on the price chart.
Core Design Philosophy
This script is built around trend confirmation and state visualization, not prediction or automation.
All elements are calculated on confirmed bar closes and do not repaint.
The indicator focuses on three analytical dimensions:
1. Dual Moving Average Structure
Hull Moving Average (HMA)
Acts as the primary momentum curve.
Designed for fast reaction to directional changes.
Slope behavior is used to infer momentum expansion or contraction.
ALMA Baseline Filter
Provides a stabilizing reference for broader trend context.
Helps distinguish directional movement from short-term fluctuations.
Used as a structural filter rather than a trigger mechanism.
2. Trend State Visualization
When HMA slope and price position relative to the ALMA baseline align, the indicator visually highlights the active market state:
Bullish alignment: upward momentum with supportive structure
Bearish alignment: downward momentum with confirming structure
Neutral / range: mixed conditions or transitional phases
A dynamic gradient fill between HMA and ALMA visually reinforces this alignment, offering an immediate understanding of trend strength and continuity.
3. Visual Markers & Labels
Discrete chart markers may appear at moments when momentum structure transitions into a new aligned state.
These markers are contextual annotations, intended to draw attention to changes in trend conditions rather than to provide standalone decisions.
They are based solely on historical price data and are fully non-repainting.
Dashboard
An optional on-chart dashboard summarizes the current market state classification (Bullish / Bearish / Range) based on the internal trend logic.
Position and size are fully configurable.
Designed for at-a-glance situational awareness.
Reflects the same logic used in the chart visuals.
Usage Disclaimer
This indicator is provided for technical analysis and educational purposes only.
It does not generate financial advice or guarantee outcomes and should be used as part of a broader analytical workflow.

Trend-ProE un trend basado en medias móviles de hull, 1 acelerada un 20% y otra normal de periodo mas largo

PSP Suite for Algo 1HTF -25% Target## 🔹 PSP Suite for Algo 1HTF – 25% Target
**(Nifty Options – CE / PE)**
### 📌 What this indicator is for
PSP Suite for Algo is a **trend-based directional options indicator** designed specifically for **NIFTY index options trading**.
It helps traders capture **high-probability directional moves** with **clear CE / PE signals**, controlled risk, and predefined targets.
---
## ⏱ Best Timeframe
* **Primary Timeframe:** ✅ **1 Hour (1H TF)**
* Do **not** use on lower timeframes for best accuracy
* Works best during **trending sessions**
---
## 📊 Instrument Best Suited
* **NIFTY Index**
* **NIFTY Weekly Options**
* Buy **CE** on BUY signal
* Buy **PE** on SELL signal
⚠️ Avoid Bank Nifty / Fin Nifty unless properly back-tested.
---
## 🟢 How to Trade (Simple Rules)
### ▶ BUY CE Signal
* When **BUY CE** label appears:
* Buy **ATM or slight ITM CE**
* Prefer same-week expiry
* Enter **after candle close** on 1H timeframe
### ▶ BUY PE Signal
* When **SELL PE** label appears:
* Buy **ATM or slight ITM PE**
* Prefer same-week expiry
* Enter **after candle close** on 1H timeframe
🚫 No over-trading: **Only one position per signal**
---
## 🎯 Target & Stop Loss (Strict Rule)
* **Target:** 🎯 **25% Option Premium**
* **Stop Loss:** ❌ **25% Option Premium**
* **Risk : Reward:** ⚖️ **1 : 1**
👉 When trade moves strongly in your favor, **manual trailing is recommended** (as shown on chart).
---
## 💰 Expected Returns on Nifty
* **Per Trade:**
* ~ **100 – 250 Nifty points equivalent move**
* Option premium typically gives **20–40% moves**
* **Accuracy:** High during **clear trends**
* Best results when market is **not sideways**
---
## 📅 Ideal Market Conditions
✅ Trending Market
✅ Expansion after consolidation
❌ Avoid very low-volatility / choppy sessions
---
## 🔔 Alerts
* Built-in alerts available for:
* **BUY CE**
* **BUY PE**
* Recommended to enable **Once Per Bar Close**
---
## 🧠 Important Notes
* This is **not a scalping tool**
* Designed for **positional intraday / short swing**
* Follow **discipline in SL & position sizing**
* Works best with **trend confirmation from price structure**
---
## ⚠️ Disclaimer
This indicator is for **educational and analytical purposes only**.
Options trading involves risk. Please trade responsibly.

Algomist - Adaptive Velocity Cross🚀 Algomist: The Adaptive Velocity Cross (AVC)
Automate Your Edge
This strategy transcends the limitations of classic Moving Average (MA) crossovers. The Adaptive Velocity Cross (AVC) is a state-of-the-art trend-following system designed for automated execution, filtering out low-probability whipsaws and prioritizing high-momentum breakouts in volatile markets.
It's not just a signal generator; it's a fully automated, risk-managed trading plan that delivers structured trade signals directly to your Algomist account.
🔥 Key Features & Technology
Adaptive Hull Moving Averages (HMA): Utilizes the Hull MA to significantly reduce lag compared to standard EMAs and SMAs. The faster and slower HMAs provide a highly responsive gauge of short-term and medium-term trend direction.
Multi-Layer Volatility Filtering: Trades are strictly prohibited during flat, low-volatility market conditions.
Current Timeframe Filter (ATRMinFilter): Ensures trades only fire when current market momentum is strong enough to carry the trend.
Higher Timeframe Filter: Checks the ATR on a higher timeframe (e.g., 1H) to confirm the structural trend strength, preventing entries during tight squeezes.
Visual Trend Velocity: The space between the Fast (Blue) and Slow (Pink) HMAs is colored and filled, providing an immediate visual cue for trend direction and strength (width of the band).
Asymmetric Risk Management: Uses the dynamic Average True Range (ATR) to calculate Stop Loss and Take Profit levels, ensuring risk and reward are proportional to current market volatility.
⚙️ How It Works (The Logic)
The AVC only executes a trade when all three high-conviction criteria are met:
Trend Signal: The Fast $\text{HMA}$ crosses the Slow $\text{HMA}$ (Crossover).
Volatile Market Confirmation: The market must be sufficiently volatile on both the current timeframe and the higher structural timeframe ($\text{ATR}$ filters passed).
Risk Management: A defined $\text{SL}$ (Stop Loss) and $\text{TP}$ (Take Profit) are calculated based on the current market $\text{ATR}$ to manage the position before entry.
🤖 Automation Ready
The strategy is built with automation as the priority. Upon a confirmed entry, the script sends a cleanly formatted JSON string via a TradingView Webhook alert to Algomist. Create your account and get your own web hook @ www.algomist.app
Example Alert Output:
{
"symbol": "ETHUSDC",
"side": "LONG",
"entry_price": 67500.0,
"stop_loss": 66000.0,
"take_profit": 70000.0,
"timestamp": 1766715660462
}
This signal is ready for immediate consumption by your Algomist execution engine, ensuring lightning-fast and error-free order placement.
📊 Recommended Use
Asset Class: Highly effective on high-liquidity, high-volatility assets (e.g., Crypto Majors, Forex Pairs, Indices).
Timeframes: Works best on 1m to 15 min charts.
Risk Profile: Medium-to-High frequency trend-following system.
Disclaimer: The strategy code provided is for informational and educational purposes. Past performance is not indicative of future results. Always backtest and forward-test any automated strategy extensively before using real capital.

ChromaFlows Momentum Index - Consensus Engine V1.2ChromaFlows Momentum Index — Conceptual Description
Overview
ChromaFlows Momentum Index is a momentum-analysis tool designed to evaluate trend quality and directional agreement by combining multiple oscillators into a single consensus-based system.
Rather than displaying independent signals from separate indicators, this script produces output only when all internal engines align, filtering out conflicting or low-quality momentum conditions.
The goal is not to generate standalone trading signals, but to provide a clear visual representation of momentum consensus and regime strength.
Conceptual Architecture
The indicator is built around three momentum engines, each assigned a distinct functional role:
Slow Stochastic — acts as the primary momentum baseline, defining the broader overbought/oversold context.
Fast Stochastic — functions as a short-term acceleration filter, detecting rapid changes in momentum relative to the baseline.
RSI — serves as a regime validator, confirming whether momentum conditions are stable enough to be considered directional.
These components are not averaged or displayed independently.
Each engine is conditionally dependent on the others.
Interaction & Consensus Logic
ChromaFlows uses a strict consensus model:
A directional state is produced only when all momentum engines agree on direction.
If even one engine diverges, the system suppresses directional output and enters a neutral state.
This logic prevents partial or conflicting momentum signals from being displayed and reduces noise commonly produced by single-indicator oscillators.
The resulting output represents agreement quality, not raw oscillator values.
Visual Output & Interpretation
The main oscillator wave represents the current momentum state derived from the consensus logic:
Bullish Consensus — all engines aligned to the upside
Bearish Consensus — all engines aligned to the downside
Neutral State — disagreement or low-quality momentum
Additional visual elements (signal markers and trend filters) are derived from the same internal state, providing contextual confirmation rather than independent signals.
These visuals are intended to help users interpret momentum context, not to automate execution.
Originality & Purpose
This script is not a visual mashup of existing indicators.
Its output cannot be replicated by observing the individual components separately, as the system’s behavior depends on conditional interaction and suppression logic between engines.
By requiring full agreement before displaying momentum states, ChromaFlows emphasizes momentum clarity over signal frequency, making it suitable as a contextual analysis layer within broader trading frameworks.
Usage Notes
ChromaFlows Momentum Index is a visual analysis tool designed to assist with market interpretation.
It does not provide investment advice or guarantee outcomes and should be used in conjunction with other forms of analysis and risk management.
Version Notes (V1.2)
• Expanded divergence detection logic added for SMI line for improved momentum context
• Minor internal optimizations and code refinements

HMA Fibo Trend RibbonHMA Fibo Trend Ribbon - Fibonacci Trend Indicator
📊 Indicator Description
This is a trend indicator based on the harmony of Fibonacci numbers. The indicator uses seven Hull Moving Averages with periods corresponding to the Fibonacci sequence: 8, 13, 21, 34, 55, 89, 144. This mathematical harmony allows the indicator to perfectly align with natural market cycles and wave structures.
🎯 Fibonacci Philosophy in Market Analysis
The Fibonacci sequence is not just a set of numbers, but a fundamental pattern found in nature, art, and financial markets. Using these periods provides:
Natural alignment with market cycles
Multifractal analysis (covering different wave levels)
Harmonious interaction between timeframes
Universal application across all timeframes
🔧 Indicator Settings
Visual Settings:
Show Main Line - Show main line (HMA 144 - golden ratio)
Show Ribbon Lines - Show the remaining 6 Fibonacci lines
Show Trend Change Labels - Show trend change labels
Show Info (Trend %) - Show info label with trend percentage
Ribbon Opacity - Ribbon transparency (0-100%)
🎨 Visualization of Fibonacci Structure
Color Harmony:
Each HMA line corresponds to a specific Fibonacci level
Collective movement creates the "Fibonacci Ribbon"
Color differentiation based on direction
Info Label:
Displays consensus of 7 Fibonacci levels
Percentage ratio of bullish/bearish lines
Color coding of the trend
📊 Interpretation of Fibonacci Signals
Consistency Levels:
7/7 lines in one direction - Perfect Fibonacci harmony
5-6/7 lines - Strong trend
3-4/7 lines - Consolidation/transition phase
0-2/7 lines - Opposite trend
🚀 Advantages of Fibonacci Approach
Natural harmony with market cycles
Universal - works on any asset and timeframe
Predictive power - anticipates reversal zones
Period synergy - signal amplification when aligned
Minimal lag - HMA responds better than regular MAs
⚡ Implementation Features
Technical Details:
Algorithm: Hull Moving Average (optimized for speed)
Periods: Pure Fibonacci sequence
Calculation: Consensus of 7 harmonic levels
Visualization: Intuitive color scheme
Performance:
Optimized for TradingView
Minimal system load
Support for all chart types
⚠️ Usage Recommendations
Combine with other Fibonacci tools
Verify signals on different timeframes
Use for trade entry filtering
Test on historical data before live trading
✍️ Author: A-Swift
📅 Version: 1.0 Fibonacci
🔗 Code: Open Source (MPL 2.0)
🧮 Basis: Fibonacci Sequence (8, 13, 21, 34, 55, 89, 144)
Fibonacci Fact:
The number 144 in the Fibonacci sequence is the square of its ordinal number (12²) and represents perfect harmony in market cycles. This makes the HMA with period 144 particularly significant for determining the main trend.

HMA 9/50 Crossover + RSI 50 Filter1. The Core Indicators
HMA 9 (Fast): Acts as the primary trigger line. Its unique calculation minimizes lag compared to standard moving averages, allowing for faster entries.
HMA 50 (Slow): Defines the medium-term trend direction and acts as the "anchor" for crossover signals.
RSI 14: Serves as a "momentum gate." Instead of traditional overbought/oversold levels, we use the 50 midline to confirm that the directional strength supports the crossover.
2. Entry Conditions
Long Entry: Triggered when the HMA 9 crosses above the HMA 50 AND the RSI is greater than 50.
Short Entry: Triggered when the HMA 9 crosses below the HMA 50 AND the RSI is less than 50.
3. Execution & Reversal
This strategy is currently configured as an Always-in-the-Market system.
A "Long" position is automatically closed when a "Short" signal is triggered.
To prevent "pyramiding" (buying multiple positions in one direction), the script checks the current position_size before opening new entries.
How to Use
Timeframe: Optimized for 3-minute (3m) candles but can be tuned for 1m to 15m scalping.
Settings: Use the Inputs panel to adjust HMA lengths based on the volatility of your specific asset (e.g., shorter for stable stocks, longer for volatile crypto).
Visuals:
Aqua Line: HMA 9
Orange Line: HMA 50
Green Background: Bullish RSI Momentum (> 50)
Red Background: Bearish RSI Momentum (< 50)
Risk Disclosure
Whipsaws: This strategy is likely to underperform in sideways markets.
Backtesting: Past performance does not guarantee future results. Always test this strategy in the Strategy Tester with appropriate commission and slippage settings before live use.

Trinity Ultimate 10 MA Ribbons)I got tired of trying to find a multi MA ribbon that could also color change and allow different types, if it exists then I could not find it... So here it is...
The **Trinity Ultimate 10 MA Ribbon** is a highly customizable, professional-grade moving average ribbon that combines extreme flexibility with beautiful visual feedback. Designed for traders who want full control without sacrificing clarity, it allows you to build a ribbon using up to ten completely independent moving averages — each with its own length, type, color, thickness, and visibility setting — while automatically coloring both the lines and the fills according to bullish or bearish conditions.
### Key Features
- Ten fully independent moving averages that can be mixed and matched exactly as you want.
- Each MA has its own selectable type: EMA (default), SMA, WMA, HMA, RMA, VWMA, or ALMA — perfect for combining fast EMAs with a slow HMA or a classic 200-period SMA.
- Every single MA line automatically changes color in real time: bright green when price is above the MA (bullish) and red when price is below the MA (bearish), making trend strength instantly visible across all timeframes.
- Smart, reactive ribbon fills that appear only between consecutive enabled MAs. Turn any MA on or off and the fills instantly adjust — no gaps, no broken bands, no manual rework.
- Nine layered fills with individually adjustable transparency (default is gradually increasing transparency from the fastest to the slowest MA), creating a smooth, depth-like ribbon effect that looks stunning on any chart background.
- Fill color itself is dynamic: green for bullish candles (close > open) and red for bearish candles, or you can customize both colors to any shade you prefer.
- Full control over every visual element: base colors, line thickness (1–10), lengths, and show/hide toggles for each of the ten MAs.
- Clean and lightweight code that compiles instantly in Pine Script v5 and works on all markets and timeframes without lag.
In short, this is the most flexible and visually informative moving-average ribbon available on TradingView today. Whether you want a classic 9-EMA ribbon, a Guppy-style multiple-timeframe setup, a hybrid EMA/HMA mix, or just three or four key levels, the indicator adapts perfectly while always telling you at a glance where the bulls and bears are in control.

Responsive ADX (RADX)Introducing the new Responsive ADX (RADX), running with a (length = 9) and exactly how it differs from the standard built-in ADX you see on TradingView chart.
This indicator is still a true ADX at its core — it measures trend strength from 0 to 100 and uses the classic +DI and –DI lines to show direction — but it has been carefully "tuned" to react noticeably faster while staying smooth and usable. With the length set to 9, it is one of the most responsive versions you can run without turning into noise.
How it behaves differently from the normal (Wilder) ADX
Normal ADX is lagging, now this version gives you the same trend-strength reading 4–8 bars earlier than the built-in ADX. On a daily chart that can easily be 4–8 calendar days of earlier warning. On a 4-hour chart it’s 16–32 hours earlier. That head-start is the whole point.
The ADX line rises and falls much quicker.
When a new trend actually starts, you will often see this Fast ADX cross above 18–20 while the built-in ADX is still sleeping below 15. Conversely, when a trend dies, this version drops faster, so you’re not left holding a dead trade for an extra week.
The +DI and –DI lines are almost identical to the original, but lightly smoothed with a 5-period EMA (you can turn this off). This makes the DI crossovers cleaner and reduces whipsaws without adding meaningful lag.
The final ADX smoothing uses a lightweight Hull-style technique instead of Wilder’s very slow RMA. This is the main “secret sauce” that removes roughly half the lag while keeping the line smooth and readable.
Values are realistic and tradable.
With length 9 you will typically see:
– 0–18 = flat / chop
– 15–20 = emerging trend (background starts colouring)
– 20–50 = strong trend (most people take this as confirmation)
– above 50–60 only in very powerful moves (same as normal ADX)
The aqua / purple background only appears when both conditions are met: the correct DI is on top and Fast ADX is above your chosen “weak-to-trending” level (default 18).
This prevents the background from flashing on and off in sideways markets — exactly the same logic you liked in the original Trinity ADX, but now much earlier.
In very simple terms
Think of the normal built-in ADX as a diesel truck — reliable but slow to accelerate and slow to stop. Fast Responsive ADX with length 9 is the same truck with a turbocharger — same destination and same load capacity, but it gets up to speed twice as fast and brakes earlier when the road turns.
We would recommend people who switch to this version keep the (length 9–12) because the edge in timing is obvious on the chart.
That’s it — this is a new more responsive version, still-logical ADX!

paigep.llc - SuperMASuperMA is a multi-layered moving-average and candle-coloring system that combines SMA, EMA, and optional HMA logic to help traders visualize trend shifts, pullbacks, and momentum changes in a clean, structured way.
The script includes multiple modules: trend-based moving averages, pullback signals, exit logic, and an optional HMA cross engine.
📌 Core Features
1. Full SMA + EMA Framework
The indicator plots multiple moving averages (8, 9, 13, 20, 50, 200) using both SMA and EMA calculations. Each line automatically colors bullish or bearish based on its relationship to the 200-period baseline.Users can toggle SMAs and EMAs independently for clearer chart control.
2. Main Trend Entry & Exit Logic (8×200 and 8×20)
Built-in crossover logic detects:
Main Entry: SMA 8 crossing above/below EMA 200
Main Exit: SMA 8 and SMA 20 cross (with an option to choose which SMA is treated as the “fast” leg)
A “first exit only” option allows the script to ignore additional exit signals until a new trend regime begins.
3. Pullback Module (20 SMA Interaction)
Pullback entries and exits occur when price crosses the 20 SMA during existing trend conditions.
This includes:
Pullback entries through the 20 SMA
Pullback exits back across the 20 SMA
Labels and candle colors are available for all pullback events.
4. Optional HMA Cross Module
A separate module allows traders to use two Hull Moving Averages (HMA) with customizable:
Lengths
Independent timeframes
Line colors
Cross-based entries and exits
This module has its own events, labels, and optional candle coloring.
5. Advanced Candle Coloring System
Candle coloring is layered in priority order, based on:
Main trend entries
Main exits
HMA entries
HMA exits
Pullback entries
Pullback exits
Trend-only candles (based on SMA 8 relative to EMA 200)
Users may also independently color wicks and borders.
6. Configurable Alerts (Fully Decoupled from Visuals)
Alerts are available for all major events, including:
Main Entries (8×200)
Main Exits (8×20)
Pullback Entries and Exits
HMA Entries and Exits
Bull or Bear Trend candles
Any colored candle event
Alerts can fire on bar close only or intrabar, depending on user preference.
📌 Use Cases
SuperMA helps traders visualize:
Trend direction using SMA/EMA structure
Momentum shifts through HMA crosses
Pullback zones around the 20 SMA
Early regime transitions based on the 8×200 relationship
Candle-level context through color-coded bars
The indicator works across all markets and timeframes.
⚠️ Note
This tool is for visual and analytical assistance only. It does not guarantee future performance and should be combined with additional analysis and risk management.

paigep.llc - SuperMA
SuperMA is a multi-layered moving-average and candle-coloring system that combines SMA, EMA, and optional HMA logic to help traders visualize trend shifts, pullbacks, and momentum changes in a clean, structured way.
The script includes multiple modules: trend-based moving averages, pullback signals, exit logic, and an optional HMA cross engine.
📌 Core Features
1. Full SMA + EMA Framework
The indicator plots multiple moving averages (8, 9, 13, 20, 50, 200) using both SMA and EMA calculations. Each line automatically colors bullish or bearish based on its relationship to the 200-period baseline. Users can toggle SMAs and EMAs independently for clearer chart control.
2. Main Trend Entry & Exit Logic (8×200 and 8×20)
Built-in crossover logic detects:
Main Entry: SMA 8 crossing above/below EMA 200
Main Exit: SMA 8 and SMA 20 cross (with an option to choose which SMA is treated as the “fast” leg)
A “first exit only” option allows the script to ignore additional exit signals until a new trend regime begins.
3. Pullback Module (20 SMA Interaction)
Pullback entries and exits occur when price crosses the 20 SMA during existing trend conditions.
This includes:
Pullback entries through the 20 SMA
Pullback exits back across the 20 SMA
Labels and candle colors are available for all pullback events.
4. Optional HMA Cross Module
A separate module allows traders to use two Hull Moving Averages (HMA) with customizable:
Lengths
Independent timeframes
Line colors
Cross-based entries and exits
This module has its own events, labels, and optional candle coloring.
5. Advanced Candle Coloring System
Candle coloring is layered in priority order, based on:
Main trend entries
Main exits
HMA entries
HMA exits
Pullback entries
Pullback exits
Trend-only candles (based on SMA 8 relative to EMA 200)
Users may also independently color wicks and borders.
6. Configurable Alerts (Fully Decoupled from Visuals)
Alerts are available for all major events, including:
Main Entries (8×200)
Main Exits (8×20)
Pullback Entries and Exits
HMA Entries and Exits
Bull or Bear Trend candles
Any colored candle event
Alerts can fire on bar close only or intrabar, depending on user preference.
Use Cases
SuperMA helps traders visualize:
Trend direction using SMA/EMA structure
Momentum shifts through HMA crosses
Pullback zones around the 20 SMA
Early regime transitions based on the 8×200 relationship
Candle-level context through color-coded bars
The indicator works across all markets and timeframes.
⚠️ Note
This tool is for visual and analytical assistance only. It does not guarantee future performance and should be combined with additional analysis and risk management.

EMA CrossMoving averages based trend indicator
Plots
Hull Moving average 34
Simple MA 200
Exponential MA 5
Signals on crossing and turn around points.

Hull VWMA Crossover StrategyA simple variation on the Hull Moving Average which reacts faster to high volume events, making it more responsive in those cases than even the standard Hull average -- CREDIT GOES TO Saolof - -- Edited into a strategy with some more options that im going to continue to refine. LMK if theres any features or confluence you want me to add -- cheers!

Buy/Sell Hull Crossover Signals (Fast & Slow)This indicator generates buy and sell signals using fast- and slow-period Hull Moving Averages (HMAs). A bullish signal occurs when the fast HMA crosses above the slow HMA, while a bearish signal triggers when it crosses below. To reduce repainting, you can optionally require confirmation on bar close.
The script includes visual tools such as a color-shifting ribbon between HMAs, optional background shading to show market regime, and lightweight buy/sell labels for quick signal recognition. Alerts are built in so you can automate notifications when crossover conditions occur.
Designed to be simple, responsive, and easy to layer into existing strategies, this indicator helps traders spot momentum shifts and trend transitions with clarity.

Colored HMASimply a colored HMA. Perfect for trend following systems in combination with other indicators.

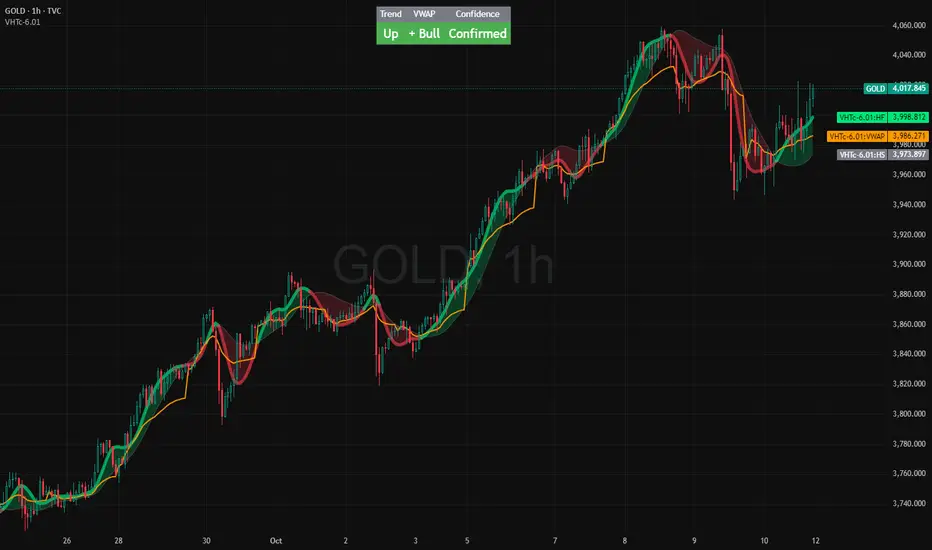
VWAP HMA Trends
It visually syncs Trend, VWAP, and Confidence — giving you instant clarity to trade with calm precision.
⚙️ The Three Core Gauges:
1. 📈 Trend Green for up, Red for down (Trend: Confirms direction)
2. 💰 VWAP Price vs. Volume Weighted Average Price. Institutional Fair Value. (Bull or Bear)
3. 🎯 Confidence Agreement between trend & VWAP. Dont fight the trend.
Bonus Feature: Confidence Turns 🟢 Confident when aligned, 🟡 Cautious when mixed.
Together, these create a clean, visual readout of the market’s health.
🧩 How to Use
Watch the Color Flow:
🟢 Green Cloud → Buyers in control.
🔴 Red Cloud → Sellers in control.
Check VWAP (Orange Line):
Price above VWAP → bullish strength.
Price below VWAP → bearish control.
Hovering at VWAP → indecision. Wait.
---
Act With Discipline:
Trade only when all gauges agree.
Add size only in Confident conditions.
Trim or tighten stops when it shifts to Cautious.
⚡ Quick Reference:
🟢 Green cloud + above VWAP + Confident | Uptrend continuation | Favor long bias
🔴 Red cloud + below VWAP + Confident | Downtrend continuation | Favor short bias
Mixed colors or Cautious: Wait or scale back
Cloud flips color: Possible shift. Reassess bias next bar
⚖️ Disclaimer: Educational and informational use only. Not financial advice. Always use independent judgment and position sizing.
TGFA Flexible Alerts Multi-MA CrossoversTGFA Flexible Alerts, Multi-MA Crossovers
Description
Flexible MA crossovers with BUY/SELL alerts, customizable candle colors, and an info box for ATR/volatility insights. Supports EMA/SMA/HMA/VWAP on any chart.
Overview
TGFA Flexible Alerts is a versatile Pine Script indicator for traders seeking customizable moving average (MA) crossovers, visual signals, and quick-reference metrics. It overlays crossover lines (e.g., fast EMA over slow SMA), generates BUY/SELL labels and alerts, colors candles based on themes, and includes an optional info box with ATR bands, support/resistance, and trend projections. Built for any symbol and timeframe (optimized for 1H intraday), it auto-detects Heikin Ashi charts and handles mixed MA types like responsive HMA with lagging EMAs. All logic uses built-in TA functions for reliability—no repainting on confirmed bars.
Key Features
MA Crossover Engine: Configurable lines (EMA, SMA, HMA, VWAP) with dynamic colors (HMA tints green/red based on slope). Enable/disable via inputs.
Invert Signals Toggle: Flips BUY/SELL logic for mixed MA setups (e.g., HMA as fast line over EMA).
Reasoning: Traditional crossovers assume a fast line (low lag) crossing above a slow line (high lag) for buys. HMA's hull design makes it ultra-responsive, so it may "lead" too aggressively—causing premature signals. Inverting aligns it with user intuition (e.g., HMA dipping below then recovering signals strength), reducing false positives in trending markets. Test on your pairs!
Visual Alerts: BUY/SELL labels at crossover price (with optional price display and offset adjustment).
Single MA Overlays: Independent plots for EMA/SMA/HMA/VWAP (length 0 to hide).
Info Box: Real-time table with current price, ±1/2 ATR bands, median price (over lookback), trend (SMA50 slope), volatility % (ATR normalized), support/resistance (recent highs/lows), and reversal projections (tied to SMA50 pivot for up/down bias).
Candle Coloring: 20+ themes (dark/light canvases) for bull/bear/reversal/low-volume bars—e.g., Emerald Blaze greens uptrends, dims on low vol. Toggle off for no changes.
Chart Source Flexibility: Auto-switches to Heikin Ashi if detected; manual override for Regular/HA.
Alerts fire on crossovers/crossunders (custom messages with ticker/interval). Open-source for forking.
How to Use
Add to Chart: Search in TradingView's public library, apply to any symbol (e.g., stocks, forex). Best on 1H for intraday, but works on daily/weekly too.
Setup Crossovers: Choose Line 1/2 types/lengths (e.g., HMA 9 over SMA 20). Enable "Invert Signals" if using HMA—prevents lag mismatches in volatile assets.
Alerts & Labels: Toggle labels for visuals; set TradingView alerts on "Buy"/"Sell" conditions. Use offset for crowded charts.
Info Box Insights: Enable for quick scans—e.g., enter long near support if trend is bullish and price > median. Adjust ATR length (default 14) for sensitivity.
Candle Themes: Pick a scheme (e.g., Neon Pulse for dark mode); it overrides bar colors without altering data.
Customization Tip: For HMA-heavy setups, invert + short lengths (5-9) catch turns early; pair with volume filter in alerts.
Limitations & Disclaimers - Designed for overlay on price charts; may overlap in tight ranges—adjust transparency via styles.
HMA can repaint intra-bar; signals confirm on close. Not back tested for all assets—validate with strategy tester.
Info box projections use SMA(50) as a trend pivot (same for up/down as reference); customize via code for advanced calcs. Candle colors are cosmetic only.
This is an analysis tool, not advice. Trading involves risk; combine with fundamentals/news. Past performance isn't indicative of future results. No liability for losses.
I'm still a newbie, so feedback encouraged!
Thank you!!
ThisGirl

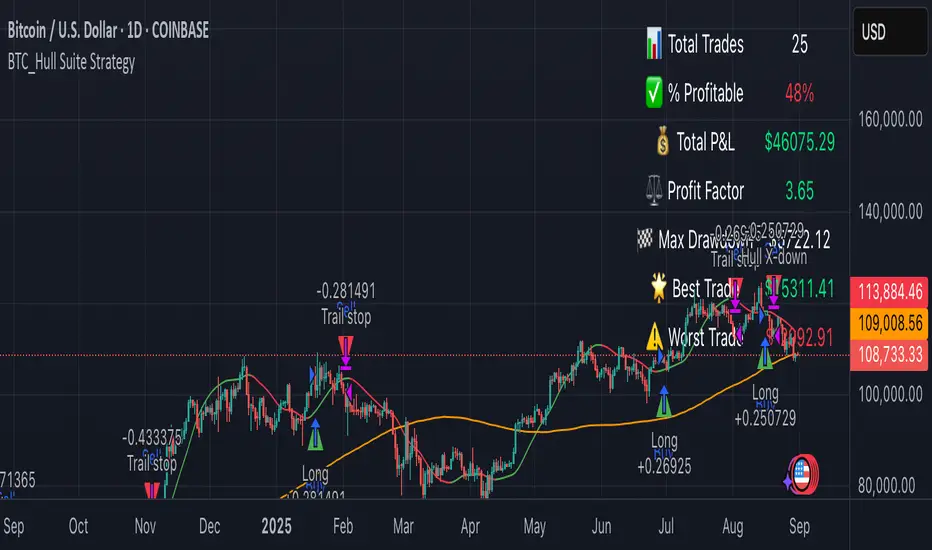
BTC_Hull Suite StrategyOverview
BTC_Hull Suite Strategy is a trend-following system designed to keep drawdowns modest while staying exposed during genuine uptrends. It uses the Hull Moving Average (HMA) for fast, low-lag trend turns, a long-term SMA filter to avoid chop, and a percentage trailing stop to protect gains.
🔧 What the strategy includes
- Hull Moving Average (HMA) with configurable length (default 55)
- SMA filter (default 130) to trade only with higher-timeframe bias
- Trailing stop in percent (default 5%) based on the running peak of close
- Execution model: signals are evaluated on the previous bar and entries are placed at the next bar’s open (TradingView default)
📈 How it works:
✅ Entry (Long):
Detects a bullish Hull turn by comparing the current HMA to its value 3 bars ago:
h > h3 and h <= h3 → HMA just turned up on the prior bar
The SMA filter must confirm: close > sma
If both are true (and within the date window), a long is opened next bar at the open
❌ Exit:
Hull turn down: h < h3 and h >= h3 , or
Trailing stop: price closes below peak * (1 – trailingPct)
Either condition closes the position at the current bar’s close
Notes:
pyramiding = 1 → allows one add-on (maximum two concurrent long positions)
Position sizing defaults to 20% of equity per entry (adjustable in Properties)
Who is this for?
This strategy is tailored for Bitcoin traders (spot or perpetuals) who want a rules-based, low-lag trend system with built-in drawdown protection.
It works best on Daily or 4H charts, but parameters can be adapted for other timeframes.
⚠️ Disclaimer
This strategy is provided for educational and research purposes only.
It is not financial advice. Markets are risky — always test on your own data, include realistic fees/slippage, and forward-test before using real capital.
HMA Trend Line (Croc Signal Line)HMA Trend Line (Croc Signal Line) — The Ultimate Hull Moving Average Trend Indicator
Full English description here:
What is the HMA Trend Line (Croc Signal Line)?
The HMA Trend Line (Croc Signal Line) is a powerful, adaptive trend indicator for TradingView, based on the Hull Moving Average (HMA). This indicator is designed to help traders identify real market trends with less lag and reduced noise compared to traditional moving averages like SMA (Simple Moving Average) and EMA (Exponential Moving Average).
Why use the HMA Trend Line?
+ Faster Trend Detection: The Hull Moving Average (HMA) responds more quickly to price action, giving you earlier buy and sell signals.
+ Smoother and Cleaner: It provides a visually clean trend line that avoids the choppiness of classic EMAs and SMAs.
+ Reduced Lag: The HMA Trend Line follows the market closer, helping you avoid late entries or exits and spot trend reversals sooner.
+ Dynamic Support and Resistance: Use the line as a dynamic support or resistance to manage trades and identify pullbacks or breakouts.
What does “Croc Signal Line” mean?
The “Croc” in Croc Signal Line stands for:
+ Clean
+ Responsive
+ Optimized
+ Curve
This highlights the unique advantage of this indicator: a curve that is both fast-reacting and smooth, helping traders focus on real trends and filter out market noise.
How does the Hull Moving Average (HMA) work?
The HMA was developed by Alan Hull and uses weighted moving averages and a unique calculation to deliver both responsiveness and smoothness. Unlike standard moving averages, the HMA reacts faster to new price moves and avoids false signals in ranging or volatile markets.
How to use the HMA Trend Line (Croc Signal Line) on TradingView?
+ Watch for price crossing above the trend line for potential bullish signals, and below for bearish signals.
+ Use on any timeframe: from 1-minute scalping to daily, weekly, or even monthly charts.
+ Works with all asset classes: Forex, stocks, indices, cryptocurrencies, commodities, and futures.
+ Combine with other indicators (like Stochastics, RSI, or volume) for confirmation and to build your unique trading strategy.
+ Adjust the Signal Line Period for your market and style: shorter periods for faster markets, longer for smoother trends.
Who should use this indicator?
+ Day traders, swing traders, and long-term investors looking for reliable, actionable trend signals.
+ Anyone seeking a cleaner, more responsive alternative to the classic moving averages.
+ Traders who want a simple, visually clear way to filter out market noise and see real price direction.
Disclaimer:
This indicator is for educational and study purposes only. Please perform your own backtesting and analysis before using it in live trading. This script does not constitute financial advice. Use at your own risk.
--------

RSI-BBGun-v6.1RSI BB Gun – Operator's Guide
“Eyes on target. Wait for the right moment. Then strike.”
________________________________________
🎯 Mission Objective
RSI BB Gun identifies extreme market conditions using RSI and Bollinger Bands, then overlays trend and volatility intelligence so you know when the setup is real.
The ❌ is your target acquisition signal—price just moved from an extreme zone back into play. Now you’ve got a clean radar lock.
________________________________________
📡 How to Operate
🟣 Step 1: Watch for the ❌'s (Black X = RSI & Bollinger Band Extremes Encountered)
• The Purple X means price and RSI are both stretched—and just snapped back into range.
• The target is now in the cross hairs and potentially ready for engagement.
🟥 Step 2: Confirm the Trend
• The thick ribbon tells you if the trend is with you:
o 🟢 Green = Uptrend. Focus on long setups.
o 🔴 Red = Downtrend. Focus on puts or short plays.
• Align with trend. Only engage when the field favors your position.
🔺 Step 3: Evaluate Signal Context
• Green Triangles = price just crossed below lower Bollinger Band (oversold).
• Red Triangles = price crossed above upper Band (overbought).
• Horizontal Lines Disappeared = The bar after the green or red horizontal line disappears means its time. We patiently wait for this as it means the momentum may be changing.
• These are your early indicators—they scout the setup on the GO / NO GO DECISION.
• ❌ + triangle + trend = clean shot.
________________________________________
☁️ Avoid These Situations
• ❌ in a choppy/no-trend zone = false alarm. Don’t engage.
• Repeated black ❌s without a purple ❌confirmation = low conviction. Let it go.
________________________________________
________________________________________
🪖 Operator's Mindset
“You don’t chase trades. You stalk them. When the ❌ flashes, the system has found a target. What you do next is up to your discipline, your tools, and your plan.”
________________________________________
Note: This is a free version. Upcoming paid version includes multi-timeframes working together. Multiple strategies. Volatility meter. Make money and master the BB Gun so that you can elevate to the Snipers weapon.
🔒 Want More Firepower?
Upgraded version coming soon. Unlocks next-gen targeting tools:
• Multi-timeframe RSI intelligence in a live dashboard
• Precision-timed combo signals based on layered volatility + RSI logic
• Advanced trend filters, trade zone overlays, and sniper-level entry indicators
• Ideal for swing traders and options strategists who want clarity under pressure
💥 Budget-friendly. No subscription. Upgrade when you're ready to go Pro.
Tip: Make 4+ trades mastering this setup. Then use a small portion of the trades to gain more features. Always be in a position you cannot lose.
🆚 Why This Beats Standard RSI/BB Tools
Mission Feature Basic Indicators RSI Ribbon Lite
Trend Confirmation ❌ ✅ Ribbon Overlay
Multi-Timeframe Awareness ❌ ✅ 5-Timeframe RSI Grid
Volatility Confirmation ❌ ✅ Weighted ATR Scoring
Combo Signal Alerts ❌ ✅ ❌ Reentry Combo Alerts
TradingView Alerts ❌ ✅ Built-In Radar Ping
#rsi #bb #bollingerbands #hull ma #trend

Normalized EMA Cycle (NEC)Normalized EMA Cycle (NEC)
The Normalized EMA Cycle (NEC) is a versatile momentum and trend reversal tool designed to detect high-probability turning points and gauge the strength of price cycles.
It combines fast and slow Exponential Moving Averages (EMAs), dynamic normalization, and adaptive transparency to create clear, intuitive reversal signals on the chart.
🔹 How It Works
EMA Differencing
The NEC calculates the difference between a fast EMA and a slower EMA:
Fast EMA Length (default 6) captures short-term momentum.
Slow EMA Length (default 16) tracks broader trends.
The slope of this difference identifies accelerating or decelerating momentum.
Normalization to 0–100 Scale
The raw EMA difference is scaled relative to the recent Alpha Period range (default 6 bars).
This transforms the value into a normalized oscillator ranging between 0 and 100.
A 3-period Hull Moving Average (HMA) smooths this series to reduce noise.
Overbought and Oversold Thresholds
By default:
Overbought Level: 75
Oversold Level: 25
Crossovers of these levels are used to detect potential reversals.
Adaptive Alpha Adjustment
The normalized value is transformed into an “Alpha Schaff” line, dynamically shifting between price and normalized cycles.
This helps the model adjust to different volatility regimes.
Trend Reversal Logic
Bullish Reversal:
Normalized oscillator crosses above the Oversold Level.
EMA difference slope is positive.
Bearish Reversal:
Normalized oscillator crosses below the Overbought Level.
EMA difference slope is negative.
Additional confirmation comes when price crosses the Alpha Schaff line in the direction of momentum.
Dynamic Confidence Visualization
The indicator calculates a trend confidence score based on the normalized separation of the EMAs.
The transparency of reversal markers dynamically adjusts:
Strong trends = more opaque signals
Weak trends = more transparent signals
🔹 How to Use
✅ Entries
Long Signal: Aqua upward label appears below a bar.
Conditions:
Bullish reversal or price crossing above Alpha Schaff
Normalized slope is rising
Short Signal: Fuchsia downward label appears above a bar.
Conditions:
Bearish reversal or price crossing below Alpha Schaff
Normalized slope is falling
✅ Trend Strength
The less transparent the signal marker, the more significant the trend.
✅ Customization
Use the inputs to fine-tune sensitivity:
Shorter EMAs: Faster signals
Longer EMAs: Smoother trends
Alpha Period: Adjusts the lookback range for normalization
🟢 Best Practices
NEC is best used in combination with other trend confirmation tools (e.g., price structure, volume, or higher timeframe EMAs).
Avoid relying on signals in extremely low-volume or choppy ranges.
⚠️ Disclaimer
This script is intended for educational purposes only and does not constitute financial advice. Trading involves substantial risk, and you should consult your financial advisor before making any investment decisions.

Hull For LoopHull For Loop is a sophisticated trend-following indicator that combines the smoothness of Hull Moving Averages with advanced trend detection algorithms and robust confirmation mechanisms.
## How It Works
At its foundation, Hull For Loop employs a custom-calculated Hull Moving Average using weighted moving average for-loops to achieve optimal smoothness and responsiveness. The system operates through three distinct layers: Hull MA calculation with adjustable smoothing multipliers, advanced trend detection using ATR-based slope thresholds, and multi-bar trend confirmation to filter false breakouts.
The logic flow is elegantly simple yet powerful:
- Hull Calculation combines half-period and full-period weighted moving averages, then applies square-root smoothing for enhanced responsiveness
- Trend Detection analyzes Hull slope against dynamic ATR-based thresholds, classifying market direction as bullish, bearish, or neutral
- Confirmation System requires sustained directional movement across multiple bars before triggering signals, dramatically reducing whipsaws
When Hull slope exceeds the positive threshold, bullish conditions emerge. When it falls below the negative threshold, bearish momentum takes control. The multi-bar confirmation ensures only sustained moves generate actionable signals, making this system ideal for trend-following strategies across volatile markets.
The advanced slope analysis mechanism adapts to market volatility through ATR integration, ensuring sensitivity remains optimal during both high-volatility breakouts and low-volatility consolidations, delivering consistent performance across varying market conditions.
## Features
- Custom Hull Implementation : For-loop calculations for precise weighted moving average control and enhanced smoothness
- Dynamic Trend Detection : ATR-based slope analysis automatically adjusts sensitivity to market volatility conditions
- Multi-Bar Confirmation : Configurable confirmation periods (1-5 bars) eliminate false signals and reduce trading noise
- Advanced Visual System : Dynamic color coding, optional arrows, and statistics table for comprehensive market visualization
- Optimized for Bitcoin : Extensively backtested parameters delivering 128.58% returns with 55% drawdown reduction versus buy-and-hold
- Flexible Configuration : Hull length (1-200), smoothing multiplier (0.1-3.0), sensitivity (1-10), and confirmation settings
- Professional Alerts : Comprehensive alert system for trend changes and entry signals with strength percentages
- Real-time Analytics : Optional statistics table displaying trend direction, strength, Hull value, and current price
## Signal Generation
Hull For Loop generates multiple signal types for comprehensive trend analysis and precise entry/exit timing:
Primary Signals : Confirmed trend changes from bullish to bearish or vice versa - highest probability directional moves
Entry Signals : Initial trend confirmation after multi-bar validation - optimal position entry points
Strength Indicators : Real-time trend strength percentages based on directional momentum over lookback periods
Visual Confirmations : Color-coded Hull line providing instant visual trend status
The confirmation system adds crucial reliability - signals must persist through the specified confirmation period before activation, ensuring only sustained moves trigger trading decisions rather than temporary price fluctuations.
## Visual Implementation
The indicator employs sophisticated visual elements for immediate trend comprehension and professional chart presentation:
- Dynamic Hull Line : Color-changing line (green/red/gray) with configurable width reflecting current trend status
- Optional Directional Arrows : Triangle markers below/above bars marking confirmed trend changes and entry points (disabled by default)
- Statistics Panel : Optional real-time table showing trend direction, strength percentage, Hull value, and current price
- Professional Color Scheme : Customizable bullish (green), bearish (red), and neutral (gray) color system
## Alerts
Hull For Loop includes comprehensive alert conditions for automated trading integration:
- Hull Trend Change - Confirmed trend direction shift with strength percentage
- Hull BUY Signal - Bullish trend confirmation with price and strength data
- Hull SELL Signal - Bearish trend confirmation with price and strength data
- Alert Frequency - Once per bar to prevent spam while maintaining accuracy
All alerts include contextual information: trend direction, current price, and trend strength percentage for informed decision-making.
## Use Cases
Trend Following : Optimized for sustained directional moves with superior drawdown protection compared to buy-and-hold strategies
Swing Trading : Multi-bar confirmation eliminates false breakouts while capturing significant trend changes
Position Trading : Smooth Hull calculation provides stable signals for longer-term directional positioning
Risk Management : Advanced confirmation system dramatically reduces whipsaw trades and false signals
Crypto Trading : Specifically optimized for Bitcoin with parameters delivering exceptional historical performance
The system demonstrates exceptional performance across volatile assets.
