Algorithmic Value Oscillator [CRYPTIK1]Algorithmic Value Oscillator
Introduction: What is the AVO? Welcome to the Algorithmic Value Oscillator (AVO), a powerful, modern momentum indicator that reframes the classic "overbought" and "oversold" concept. Instead of relying on a fixed lookback period like a standard RSI, the AVO measures the current price relative to a significant, higher-timeframe Value Zone .
This gives you a more contextual and structural understanding of price. The core question it answers is not just "Is the price moving up or down quickly?" but rather, " Where is the current price in relation to its recently established area of value? "
This allows traders to identify true "premium" (overbought) and "discount" (oversold) levels with greater accuracy, all presented with a clean, futuristic aesthetic designed for the modern trader.
The Core Concept: Price vs. Value The market is constantly trying to find equilibrium. The AVO is built on the principle that the high and low of a significant prior period (like the previous day or week) create a powerful area of perceived value.
The Value Zone: The range between the high and low of the selected higher timeframe.
Premium Territory (Distribution Zone): When the oscillator moves into the glowing pink/purple zone above +100, it is trading at a premium.
Discount Territory (Accumulation Zone): When the oscillator moves into the glowing teal/blue zone below -100, it is trading at a discount.
Key Features
1. Glowing Gradient Oscillator: The main oscillator line is a dynamic visual guide to momentum.
The line changes color smoothly from light blue to neon teal as bullish momentum increases.
It shifts from hot pink to bright purple as bearish momentum increases.
Multiple transparent layers create a professional "glow" effect, making the trend easy to see at a glance.
2. Dynamic Volatility Histogram: This histogram at the bottom of the indicator is a custom volatility meter. It has been engineered to be adaptive, ensuring that the visual differences between high and low volatility are always clear and dramatic, no matter your zoom level. It uses a multi-color gradient to visualize the intensity of market volatility.
3. Volatility Regime Dashboard: This simple on-screen table analyzes the histogram and provides a clear, one-word summary of the current market state: Compressing, Stable, or Expanding.
How to Use the AVO: Trading Strategies
1. Reversion Trading This is the most direct way to use the indicator.
Look for Buys: When the AVO line drops into the teal "Accumulation Zone" (below -100), the price is trading at a discount. Watch for the oscillator to form a bottom and start turning up as a signal that buying pressure is returning.
Look for Sells: When the AVO line moves into the pink "Distribution Zone" (above +100), the price is trading at a premium. Watch for the oscillator to form a peak and start turning down as a signal that selling pressure is increasing.
2. Best Practices & Settings
Timeframe Synergy: The AVO is most effective when your chart timeframe is lower than your selected "Value Zone Source." For example, if you trade on the 1-hour chart, set your Value Zone to "Previous Day."
Confirmation is Key: This indicator provides powerful context, but it should not be used in isolation. Always combine its readings with your primary analysis, such as market structure and support/resistance levels.
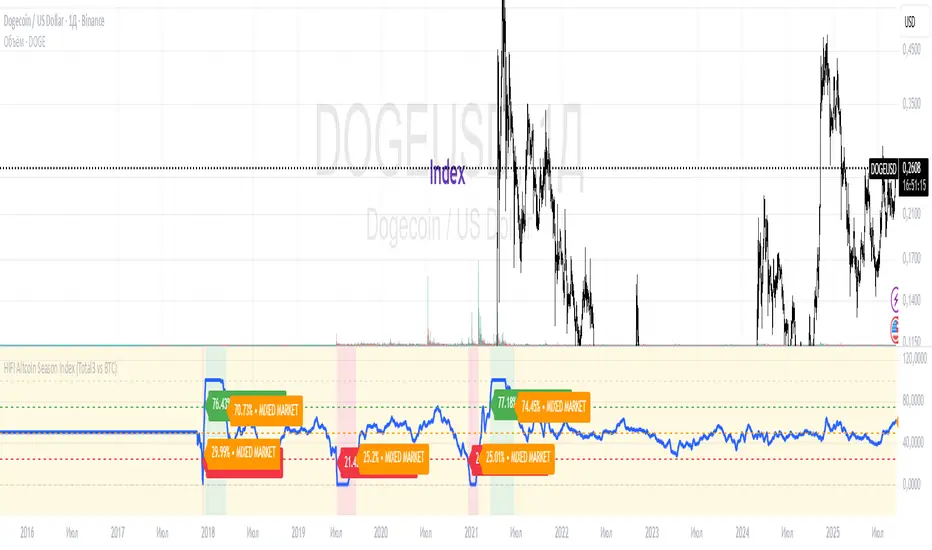
Index

HIFI Altcoin Season Index (Total3 vs BTC)This indicator helps you determine whether the crypto market is in an "altcoin season" or a "bitcoin season." It doesn't compare every single altcoin to Bitcoin individually; instead, it uses a more efficient approach.
Methodology
The index calculates the difference in price performance over a selected period (default 90 days) between the total market capitalization of altcoins without Ethereum (TOTAL3) and Bitcoin (BTC).
Interpretation
Value above 75: TOTAL3 is showing significantly stronger growth than BTC, indicating an ALTCOIN SEASON. 🚀
Value below 25: BTC is outperforming TOTAL3, indicating a BITCOIN SEASON. 👑
Value between 25 and 75: The market is in a mixed or neutral phase. 🤷
Benefits
This method avoids the technical limitations of Pine Script when requesting data for a large number of symbols, making the indicator stable and reliable.
Disclaimer: This indicator is a tool for market analysis and should not be considered financial advice.
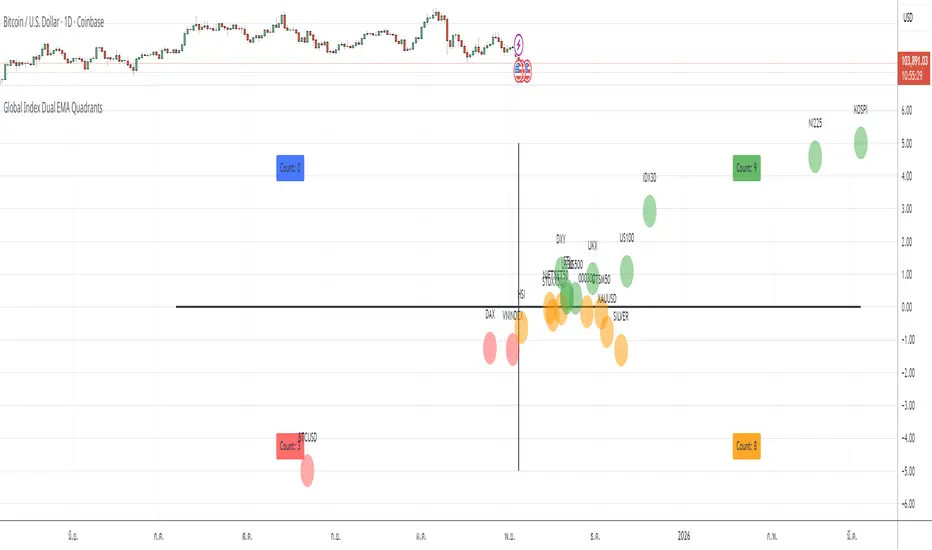
Global Index EMA QuadrantsThis indicator displays global market indices on a 2D quadrant matrix based on their percentage distance from a selected EMA length across two different timeframes.
Features
• X-axis: % distance from EMA on a higher timeframe (default Weekly)
• Y-axis: % distance from EMA on a lower timeframe (default Daily)
• Bubble colors represent quadrants
• Count labels show how many indices are in each quadrant
How to Use
Select your preferred X timeframe, Y timeframe, and EMA length from the settings panel.
Analyze which quadrant each index is currently in to assess market momentum and breadth.
The zero axes represent the EMA level on each timeframe.
Notes
• This indicator uses only built-in request.security() data from TradingView
• No external APIs, personal data, or third-party content are used
• Designed purely for educational and market breadth analysis purposes
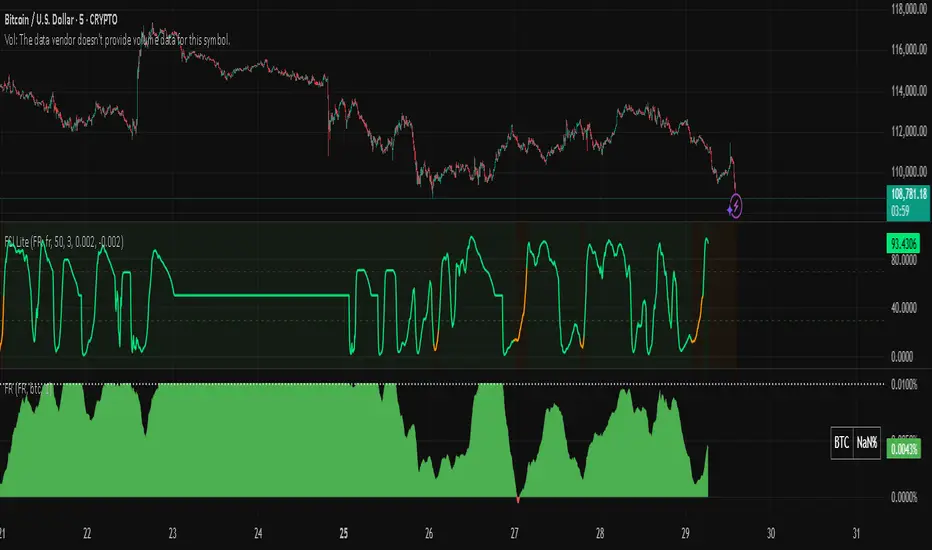
Snapfront Funding Stress IndexThe Funding Stress Index (FSI Lite) transforms raw funding rate data into a clear, intuitive stress gauge for crypto perpetual markets.
🔹 What it does:
Normalizes funding rates against their rolling baseline
Highlights extreme positive/negative funding as “stress zones”
Uses φ²-based coherence mapping for a sharper, sentiment-driven signal
Helps detect periods where traders are overpaying to stay long or short
🔹 How to use:
Add a Funding Rate feed (Bybit, Binance, OKX, etc.) to your chart.
Apply FSI Lite on top of it (Indicator on Indicator).
Watch stress levels as they enter:
🟢 High stress (positive funding) → longs paying shorts heavily, often overheated market.
🔴 Low stress (negative funding) → shorts paying longs, capitulation signals.
🟠 Neutral zone → balanced, less directional pressure.
🔹 Best for:
Identifying overheated long/short positioning
Timing entries around liquidation clusters
Adding funding context to your trading strategy
⚠️ Note: This is the Lite (free) version. It is educational only and not financial advice.
Dual Custom Index with SpreadDual Custom Index with Spread
Create powerful custom indices from any instruments and analyze their relative strength dynamics
Overview
This advanced indicator allows you to build two completely customizable indices from your choice of instruments and analyze their spread relationship. Perfect for inter-market analysis, sector rotation strategies, currency strength comparisons, and sophisticated relative performance studies.
Key Features
🔧 Fully Customizable Index Construction
Build each index from up to 6 instruments with individual weightings
Enable/disable instruments on the fly without losing settings
Automatic weight validation ensures mathematically accurate calculations
Invert functionality for instruments that move opposite to index strength
📊 Advanced ADX-Based Methodology
Uses sophisticated ADX +DI/-DI directional bias calculations
Normalized bias calculation for consistent scaling across different instruments
Optimized default settings for intraday trading with full customization options
Professional-grade smoothing and filtering options
📈 Dual Analysis Modes
Difference Mode: Shows absolute strength difference (Index1 - Index2)
Ratio Mode: Shows relative performance ratio (Index1 / Index2)
Additional spread smoothing for cleaner signals
🎨 Professional Display Options
Custom labels with full color, size, and positioning control
Dynamic "Follow Line" labels that move with your data
Static corner positioning for reference displays
Clean error messaging and validation feedback
Use Cases
Gold Trading: Create gold strength vs USD strength indices for precise market timing
Sector Analysis: Compare technology vs financial sector strength for rotation strategies
Currency Strength: Build custom currency baskets for advanced forex analysis
Commodity Spreads: Analyze relative strength between different commodity groups
Regional Markets: Compare strength between different geographical market indices
Crypto Analysis: Track relative performance between different cryptocurrency sectors
Technical Specifications
Instruments per Index: Up to 6 with individual enable/disable
Weight Validation: Automatic 100% total weight enforcement
Calculation Method: ADX-based directional bias with trend strength weighting
Smoothing Options: Multiple levels of customizable smoothing
Error Handling: Professional validation with clear user feedback
Optimization Tips
Intraday Trading: Use DI Length 3-7 for faster response
Daily Analysis: Use DI Length 10-14 for smoother signals
Noisy Markets: Increase Final Smoothing for cleaner signals
Trending Markets: Lower smoothing values for faster reaction
Perfect for traders who need sophisticated inter-market analysis tools beyond standard indicators. Whether you're analyzing gold vs dollar dynamics, sector rotation opportunities, or custom currency strength relationships, this indicator provides institutional-grade analysis capabilities with complete customization flexibility.

RSI With TSIThis indicator combines the power of the Relative Strength Index (RSI) and the True Strength Index (TSI) into a single tool, helping traders identify both short-term and long-term momentum shifts with improved clarity and precision.
Features:
Relative Strength Index (RSI):
Adjustable period and source for RSI calculation (default: 14, close).
RSI displayed with distinct color.
Includes upper (70) and mid (50) level lines with background fill for visual emphasis.
Background fill highlights the RSI range visually.
True Strength Index (TSI):
Customizable long, short, and signal lengths.
TSI and its signal line plotted for momentum analysis.
Zero line added to quickly identify bullish or bearish zone.
📊 Why Use This Indicator?
This dual-indicator setup is excellent for:
Momentum confirmation between RSI and TSI.
Identifying early entries and trend continuations.
Spotting divergences and momentum reversals.

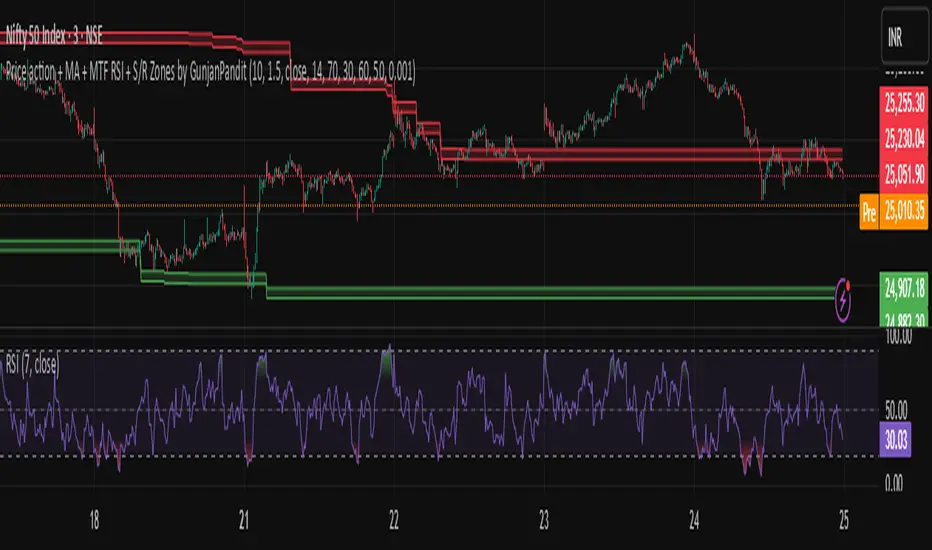
Price action + MA + MTF RSI + S/R Zones by GunjanPanditDescription:
This script combines multiple powerful trading tools into a unified indicator designed for trend-following and confirmation-based entries. It is built to assist traders in identifying actionable signals based on price structure, volatility, and momentum across multiple timeframes.
🔧 How It Works
✅ UT Bot Core Logic
The script uses a variation of the UT Bot (Ultimate Trend Bot) method to generate buy/sell signals.
Signals are based on ATR-filtered trailing stop levels to reduce noise and detect real trend changes.
A Buy is triggered when the price closes above the UT trailing stop.
A Sell is triggered when the price closes below it.
✅ Multi-Timeframe RSI Confirmation
RSI is calculated on a user-defined higher timeframe (default: 1 hour).
A buy signal is confirmed only if RSI is below the oversold level, and vice versa for sell signals.
This confirmation layer adds an extra filter to improve signal reliability and reduce whipsaws.
✅ Support & Resistance Zones (MTF)
The script automatically plots dynamic support and resistance zones using highs/lows from the selected higher timeframe.
These zones are visualized as shaded bands, helping users recognize key levels where price may reverse or consolidate.
✅ Visual Aids & Alerts
Buy and Sell signals are clearly labeled on the chart.
Optional RSI plot in a separate pane for visual monitoring.
Real-time alert conditions included for both Buy and Sell entries.
📈 Use Case & Recommendations
This script is best suited for:
Swing trading or intraday strategies in trending markets.
Traders who want confirmation across timeframes to filter noise.
Spotting key entry zones aligned with momentum and volatility.
Recommended to use in combination with:
Volume or trend structure analysis.
Stop-loss and take-profit risk management based on ATR or S/R zones.
inal Thoughts
This indicator is ideal for traders who value:
Multi-timeframe analysis
Visual clarity
Signal confirmation
And clean, customizable overlays for actionable trading insights.
CRS by TQCRS by TradeQUO
Comparative Relative Strength Indicator
What it does
Computes the percentage difference in performance between your current chart symbol (e.g. GC1!) and a chosen benchmark (e.g. ES1!, DXY, NQ1!).
Smooths that “CRS” line with a configurable moving average (SMA, EMA, WMA) — default length is 63 bars.
Key Plots
CRS (%) (aqua) — how your symbol has held up relative to the benchmark since the chart loaded.
CRS MA (%) (fuchsia) — smoothed trend of that relative strength.
How to Interpret
Trend-Following
Long when CRS crosses above its MA and is above 0 → your symbol is outperforming.
Short (or reverse) when CRS crosses below its MA and is below 0 → underperformance.
Regime Filter
CRS > 0 → Risk-On environment for your symbol vs. benchmark.
CRS < 0 → Risk-Off relative to the benchmark.
Divergence Signals
Bearish Divergence: Price makes a higher high, but CRS makes a lower high → potential sell-off incoming.
Bullish Divergence: Price makes a lower low, but CRS makes a higher low → look for rebound opportunity.
Pairs Trading
Outperformance: Long your symbol + Short benchmark when CRS > MA.
Underperformance: Short your symbol + Long benchmark when CRS < MA.
Why it matters
Reveals relative market leadership early, not just absolute price moves.
Helps you allocate risk dynamically, spot rotations and catch reversals before they show in price alone.

Apex Edge - RSI Trend LinesThe Apex Edge - RSI Trend Lines indicator is a precision tool that automatically draws real-time trendlines on the RSI oscillator using confirmed pivot highs and lows. These dynamic trendlines track RSI structure in motion, helping you anticipate breakout zones, reversals, and hidden divergences.
Every time a new pivot forms, the indicator automatically re-draws the RSI trendline between the two most recent pivots — giving you an always-current view of momentum structure. You’ll instantly see when RSI begins compressing or expanding, long before price reacts.
Key Features: • Dynamic RSI trendlines drawn from the last 2 pivots
• Auto re-draws in real-time as new pivots form
• Optional "Full Extend" or "Pivot Only" modes
• Slope color-coded: green = support, red = resistance
• Built-in dotted RSI levels (30/70 default)
• Alert conditions for RSI trendline breakout signals
• Ideal for spotting divergence, compression, and early SMC confluence
This is not your average RSI — it’s a fully reactive momentum edge overlay designed to give you clarity, structure, and timing from within the oscillator itself. Perfect for traders using Smart Money Concepts, divergence setups, or algorithmic trend tracking.
⚔️ Built for precision. Built for edge. Built for Apex.

Briese CoT Movement IndexThis Briese CoT (Commitments of Traders) Movement Index histogram indicator was built based on the formula by Stephen Briese in his book "The Commitments of Traders Bible":
"...difference between the COT Index and its reading of one or several weeks prior. I use six." —Chapter 7, page 75.
The code is a bit of a remix of the "ICT Commitment of Traders°" indicator by toodegrees and is meant for use in a new pane below a Weekly Chart .
The upper and lower thresholds are +40/-40. Some context: "A ± 40 point surge in the COT Index within a six-week period frequently marks the end of a counter-trend price reaction"
40 Point CoT Surge Rules (Commercials) from page 76
"During a correction from a prevailing uptrend, a +40 point movement in the CoT Index within a six-week period often marks the end of a corrective pullback, and the resumption of the major uptrend."
"During a reaction in a prevailing downtrend, a -40 point movement in the CoT Index within a six-week period frequently marks the end of a price reaction, and the resumption of the established downtrend."
"The failure of a ± point CoT Movement Index signal to restart the prevailing trend is a tip-off to a major trend change"
I'd recommend reading Briese's book for examples on how to properly interpret this indictor.
This indicator can be used in conjunction with another one I've published called the "Williams x Briese Hybrid CoT Index" which can be found on my scripts page.

Momentum ScopeOverview
Momentum Scope is a Pine Script™ v6 study that renders a –1 to +1 momentum heatmap across up to 32 lookback periods in its own pane. Using an Augmented Relative Momentum Index (ARMI) and color shading, it highlights where momentum strengthens, weakens, or stays flat over time—across any asset and timeframe.
Key Features
Full-Spectrum Momentum Map : Computes ARMI for 1–32 lookbacks, indexed from –1 (strong bearish) to +1 (strong bullish).
Flexible Scale Gradation : Choose Linear or Exponential spacing, with adjustable expansion ratio and maximum depth.
Trending Bias Control : Apply a contrast-style curve transform to emphasize trending vs. mean-reverting behavior.
Duotone & Tritone Palettes : Select between two vivid color styles, with user-definable hues for bearish, bullish, and neutral momentum.
Compact, Overlay-Free Display : Renders solely in its own pane—keeping your price chart clean.
Inputs & Customization
Scale Gradation : Linear or Exponential spacing of intervals
Scale Expansion : Ratio governing step-size between successive lookbacks
Scale Maximum : Maximum lookback period (and highest interval)
Trending Bias : Curve-transform bias to tilt the –1 … +1 grid
Color Style : Duotone or Tritone rendering modes
Reducing / Increasing / Neutral Colors : Pick your own hues for bearish, bullish, and flat zones
How to Use
Add to Chart : Apply “Momentum Scope” as a separate indicator.
Adjust Scale : For exponential spacing, switch your indicator Y-axis to Logarithmic .
Set Bias & Colors : Tweak Trending Bias and choose a palette that stands out on your layout.
Interpret the Heatmap :
Red tones = weakening/bearish momentum
Green tones = strengthening/bullish momentum
Neutral hues = indecision or flat momentum
Copyright © 2025 MVPMC. Licensed under MIT. For full license see opensource.org

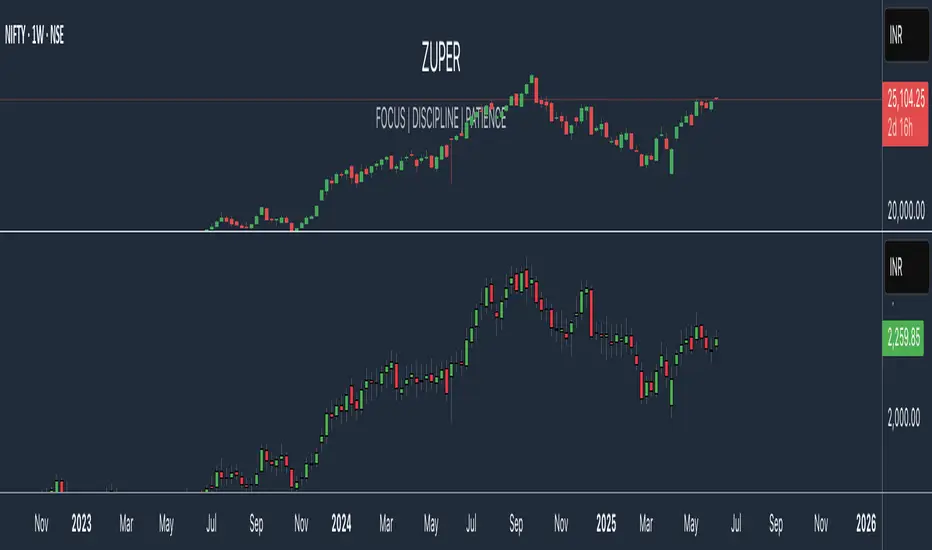
Zuper Custom Index (Up to 40 Stocks)Description:
This indicator empowers you to create your own custom index from up to 40 stocks, with full control over the weight of each component. Whether you want to track a sector, a basket of favourites, or build your own benchmark, this tool gives you the flexibility and visualisation you need—all directly on your TradingView chart.
Key Features:
Supports Up to 40 Stocks:
Combine up to 40 different symbols into a single, custom index.
Flexible Weighting:
Assign a custom percentage weight to each stock. The script automatically normalizes your weights to ensure the index always sums to 100%.
Candlestick or Line Chart Display:
Choose between a candlestick chart (showing open, high, low, close of the index) or a simple line chart (close only) for your custom index.
Dynamic Rebalancing:
Change weights or symbols at any time; the index recalculates instantly.
Easy Symbol Input:
Add or remove stocks with simple input fields—no code editing required.
Perfect for Sector Analysis & Custom Baskets:
Track sectors, strategies, or any group of assets you care about.
How to Use:
Add the Indicator to Your Chart.
Enter Up to 40 Stock Symbols in the input fields.
Assign Weights (as percentages) to each symbol.
If all weights are left at zero, the index will use equal weighting.
If you enter custom weights, they will be automatically normalized.
Choose Your Display Type:
Select between a candlestick or line chart for your index.
Analyze Your Custom Index!
Use Cases:
Build your own sector or thematic index.
Track a custom ETF or fund composition.
Compare your portfolio’s performance as a single chart.
Visualize the impact of different weightings on a basket of stocks.
Notes:
The indicator uses TradingView’s latest Pine Script version for maximum performance and flexibility.
You can use any valid TradingView symbol (stocks, ETFs, indices, etc.).
For best results, ensure all symbols are available on your selected timeframe and exchange.
Create, visualize, and analyze your own custom indices—right on your TradingView chart!
COT Commitment of Traders IndexOVERVIEW
Commitment of Traders (COT) Indicator is a trading tool which designed to visualise net positions/commitment of traders that is reported weekly basis to the commissions.
CONCEPTS
The Indicator help you understand the position of long or short trades by market participants relative to their historical positioning. The change in position will help you in analysing the medium-to-long term market trend.
The commercial traders represents producers or consumers of the commodity that usually positions as hedgers in the market, protecting their asset over market fluctuation risk. The non-commercial traders represents fund or money managers that the goal is speculate and take profit from the market fluctuations. Non-reportable represents small or retail traders.
Understand the relative of those all traders will give better insight of how to positions ourselves in the market.
DETAILS & EXAMPLE OF HOW TO USE
An example of Gold Future chart (GC1!) to demonstrate the indicator in real market scenario.
Blue graph indicate the Commercial Index, showing on the extreme low under 20 level. Commercial traders as a hedgers indicate the turning point over an asset in extreme value. This showing the potential change in market direction the upside.
On the same time, Orange graph indicate the Non-Commercial Index, showing an extreme high level above 80. Non-Commercial traders will most of the time trade with the trend. This showing the potential continuation of market direction to the upside.
Base on those information, combine with other technical strategy on the same timeframe or even lower timeframe. For example using Supply & Demand to find the entry.
The result is a massive push to the upside in the long term direction.
FEATURES
3 Index in 1 indicator
Customisable historical period and threshold
LIMITATIONS
The Indicator is best applied on weekly, due to the weekly release of COT data.
Not intended as a stand-alone signal, but should be as part of long-term strategy analysis.
Should be combined with other lower-timeframe technical tools like supply and demand.

Symbol vs Benchmark Performance & Volatility TableThis tool puts the current symbol’s performance and volatility side-by-side with any benchmark —NASDAQ, S&P 500, NIFTY or a custom index of your choice.
A quick glance shows whether the stock is outperforming, lagging, or just moving with the market.
⸻
Features
• ✅ Returns over 1W, 1M, 3M, 6M, 12M
• 🔄 Benchmark comparison with optional difference row
• ⚡ Volatility snapshot (20D, 60D, or 252D)
• 🎛️ Fully customizable:
• Show/hide rows and timeframes
• Switch between default or custom benchmarks
• Pick position, size, and colors
Built to answer a simple, everyday question — “How’s this really doing compared to the broader market?”
Thanks to @BeeHolder, whose performance table originally inspired this.
Hope it makes your analysis a little easier and quicker.

Fibo Normalized RSI & RSI RibbonPlots both standard and Z-score normalized RSI ribbons using Fibonacci-based periods. Supports adjustable normalization, optional 0–100 scaling, and multi-line visualizations for momentum and deviation analysis.
This tool is designed for traders who want to go beyond standard RSI by adding:
Statistical normalization (Z-score)
Multi-period analysis (Fibonacci structure)
Advanced divergence and exhaustion detection
It gives you both classical momentum context and mathematically rigorous deviation insight, making it ideal for:
Swing traders
Quant-inclined discretionary traders
Multi-timeframe analysts
Trend Confirmation
When both RSI and normalized RSI across short and long periods are stacked in the same direction (e.g., above 50 or with high Z-scores), the trend is likely strong.
Disagreement between the two ribbons (e.g., RSI high but normalized RSI flat) may indicate late-stage trend or false strength.
Mean Reversion Trades
Look for normalized RSI values > +2 or < -2 (i.e., ~2 standard deviations).
Cross-check with standard RSI to see if the move aligns with a traditional overbought/oversold level.
Great for fade/reversal setups when Z-score RSI is extreme but classic RSI is just beginning to turn.
Divergence Detection
Compare the slope of RSI vs. normalized RSI over same period:
If RSI is rising but normalized RSI is falling → momentum is fading despite apparent strength.
Excellent for early warnings before reversals.
Multi-Timeframe Confluence
Use short-period ribbons (e.g., 3–13) for tactical entries/exits.
Use long-period ribbons (e.g., 55–233) for macro trend bias.
Alignment across both = high-confidence zone.

RSI Hybrid ProfileThis is a Hybrid Script designed on the basis of a well know Indicator RSI - Relative strength Index, ATR, Standard Deviations and Medians. Effort is being made to present RSI in a Profile based concept to leverage and elevate trading signals and identify potential trade while effectively managing the RISK.
Trend Colour Coding :-
Green = Bullish
Red = Bearish
Gray = Mean Reversion/ Rangebound Markets
The script includes the following Elements
1) Candlestick chart of RSI of current time frame in lower pane :-
It helps to effectively compare the price action with that of RSI to clearly identify early breakouts or breakdowns in RSI as compared to price chart and identify early trade opportunities as well as Divergences
2) Higher Time Frame RSI :-
The orange line in the lower pane to help take analysis of Higher Timeframe, to evaluate and assess trend in more refined manner.
3) Point of Control Zone :-
The middle horizontal band with colour coding to highlight the Point of Control of the price action based on its relative strength.
4) Black Circles - POC Change Markers - RSI profile Value area Shifts :-
All the Black Circles plotted on chart are RSI Point of Controls, which signal upcoming Trend and should be closely watched as it can help identify wonderful Entry/Exit Opportunities.
5) Value Area :-
The horizontal lines above and below the POC Zones are the Value areas, they are extremely useful to identify the potential support/resistance zones during the trending markets and potential target zones during the mean reverting markets. The width also helps assess the underlying volatility and risk and can help in determining the position size based on it. The setting can be adjusted based on Value area Range Multiplier. 1 is the ideal setting as it represents 1 Standard Deviation of Data.
6) Trailing Stops :-
The Green Trailing line helps as trailing stoploss in buying positions and Red Trailing Line helps as trailing SL in Selling Positions. These are especially useful when price is far away from the value area zones or when volatility is very high. The setting can be adjusted based on trail multiplier in the settings.
Here are the few examples of how to use the script on different asset classes
1) Gold Futures - Exhibiting the use of trend and SL and how to change positions based on retracement and RSI Interpretation.
2)Nifty 50 - Exhibiting the importance of POC , RSI Divergence and Breakout and SL Trail and POC Change Markers
3) Bitcoin/US Dollar - Showing the use of Value areas as support zones and using RSI overbought and oversold regions to manage pullbacks and retracement confirmations.
4) JSW Energy Limited - Stock - Showing the combined use of the scripts elements in trading environment.
Feel Free to use it on Charts and leverage the power of this wonderful Indicator.

COT3 - Flip Strength Index - Invincible3This indicator uses the TradingView COT library to visualize institutional positioning and potential sentiment or trend shifts. It compares the long% vs short% of commercial and non-commercial traders for both Pair A and Pair B, helping traders identify trend strength, market overextension, and early reversal signals.
🔷 COT RSI
The COT RSI normalizes the net positioning difference between non-commercial and commercial traders over (N=13, 26, and 52)-week periods. It ranges from 0 to 100, highlighting when sentiment is at bullish or bearish extremes.
COT RSI (N)= ((NC - C)−min)/(max-min) x100
🟡 COT Index
The COT Index tracks where the current non-commercial net position lies within its 1-year and 3-year historical range. It reflects institutional accumulation or distribution phases.
Strength represents the magnitude of that positioning bias, visualized through normalized RSI-style metrics.
COT Index (N)= (NC net)/(max-min) x100
🔁 Flip Detection
Flip refers to the crossovers between long% and short%, indicating a change in directional bias among trader groups. When long positions exceed shorts (or vice versa), it signals a possible market flip in sentiment or trend.
For example, Pair B commercial flip is calculated as:
Long% = (Long/Open Interest)×100
Short% = (Short/Open Interest)×100
Flip = Long%−Short%
A bullish flip occurs when long% overtakes short%, and vice versa for a bearish flip. These flips often precede price trend changes or confirm sentiment breakouts.
Flip captures how far current positioning deviates from historical norms — highlighting periods of institutional overconfidence or exhaustion, often leading to significant market turns.
This combination offers a multi-layered edge for identifying when smart money is flipping direction, and whether that flip has strong conviction or is likely to fade.
..........................................................................................................................................................

Volume Signal RSIVolume Signal RSI (VSR) Indicator
Overview:
The Volume Signal RSI (VSR) indicator combines traditional RSI analysis with statistically significant volume detection to identify potential reversal points and exhaustion signals in crypto markets. By applying statistical methods to volume analysis, VSR filters out normal market noise and highlights only the most meaningful volume spikes.
Key Features:
- Standard RSI overbought/oversold signals (70/30)
- Statistical volume significance detection using z-scores and p-values
- Exhaustion signals for potential market reversals
- Enhanced alert system with actionable trading context
How to Use This Indicator
Basic Signals:
- RSI Line: The blue line shows the standard RSI value (default period: 14)
- Overbought/Oversold Levels: Standard levels at 70/30 with additional extreme levels at 80/20
- Volume Detection: Small circles appear on the RSI line when statistically significant volume is detected
Trading Signals
1. Oversold Alert (🔴): When RSI crosses below 30
- Indicates potential support area
- Consider for long entries when price shows signs of stabilizing
2. Overbought Alert (🟢): When RSI crosses above 70
- Indicates potential resistance area
- Consider for short entries when price shows signs of topping
3. Bear Exhaustion Signal (⚠️): When bearish volume appears in oversold territory
- Indicates a potential selling climax
- Strong reversal signal when accompanied by positive price action
- Best used for counter-trend entries during downtrends
4. Bull Exhaustion Signal (⚠️): When bullish volume appears in overbought territory
- Indicates a potential buying climax
- Strong reversal signal when accompanied by negative price action
- Best used for counter-trend entries during uptrends
Alert Messages:
Alert messages contain critical information formatted for quick analysis:
- Symbol and timeframe
- Current price and RSI value with direction indicator
- Volume metrics: z-score, deviation percentage, and statistical confidence
- Trading context suggestion
Statistical Methodology:
- Z-Score: Measures how many standard deviations the current volume is from the mean
- P-Value: Statistical measure of significance (lower values = more significant)
- Confidence: Displayed as a percentage (higher = more confidence in the signal)
- Volume Deviation: Percentage above/below the average volume
Best Practices
1. Confirm signals with price action or other indicators
2. Higher timeframes typically produce more reliable signals
3. Use the statistical confidence percentage to gauge signal strength
4. Most powerful signals occur when exhaustion signals coincide with key support/resistance levels and there a quarter or more wick size at top of candle(buying exhaustion) or at bottom of candle (selling exhaustion)

RSI Full Forecast [Titans_Invest]RSI Full Forecast
Get ready to experience the ultimate evolution of RSI-based indicators – the RSI Full Forecast, a boosted and even smarter version of the already powerful: RSI Forecast
Now featuring over 40 additional entry conditions (forecasts), this indicator redefines the way you view the market.
AI-Powered RSI Forecasting:
Using advanced linear regression with the least squares method – a solid foundation for machine learning - the RSI Full Forecast enables you to predict future RSI behavior with impressive accuracy.
But that’s not all: this new version also lets you monitor future crossovers between the RSI and the MA RSI, delivering early and strategic signals that go far beyond traditional analysis.
You’ll be able to monitor future crossovers up to 20 bars ahead, giving you an even broader and more precise view of market movements.
See the Future, Now:
• Track upcoming RSI & RSI MA crossovers in advance.
• Identify potential reversal zones before price reacts.
• Uncover statistical behavior patterns that would normally go unnoticed.
40+ Intelligent Conditions:
The new layer of conditions is designed to detect multiple high-probability scenarios based on historical patterns and predictive modeling. Each additional forecast is a window into the price's future, powered by robust mathematics and advanced algorithmic logic.
Full Customization:
All parameters can be tailored to fit your strategy – from smoothing periods to prediction sensitivity. You have complete control to turn raw data into smart decisions.
Innovative, Accurate, Unique:
This isn’t just an upgrade. It’s a quantum leap in technical analysis.
RSI Full Forecast is the first of its kind: an indicator that blends statistical analysis, machine learning, and visual design to create a true real-time predictive system.
⯁ SCIENTIFIC BASIS LINEAR REGRESSION
Linear Regression is a fundamental method of statistics and machine learning, used to model the relationship between a dependent variable y and one or more independent variables 𝑥.
The general formula for a simple linear regression is given by:
y = β₀ + β₁x + ε
β₁ = Σ((xᵢ - x̄)(yᵢ - ȳ)) / Σ((xᵢ - x̄)²)
β₀ = ȳ - β₁x̄
Where:
y = is the predicted variable (e.g. future value of RSI)
x = is the explanatory variable (e.g. time or bar index)
β0 = is the intercept (value of 𝑦 when 𝑥 = 0)
𝛽1 = is the slope of the line (rate of change)
ε = is the random error term
The goal is to estimate the coefficients 𝛽0 and 𝛽1 so as to minimize the sum of the squared errors — the so-called Random Error Method Least Squares.
⯁ LEAST SQUARES ESTIMATION
To minimize the error between predicted and observed values, we use the following formulas:
β₁ = /
β₀ = ȳ - β₁x̄
Where:
∑ = sum
x̄ = mean of x
ȳ = mean of y
x_i, y_i = individual values of the variables.
Where:
x_i and y_i are the means of the independent and dependent variables, respectively.
i ranges from 1 to n, the number of observations.
These equations guarantee the best linear unbiased estimator, according to the Gauss-Markov theorem, assuming homoscedasticity and linearity.
⯁ LINEAR REGRESSION IN MACHINE LEARNING
Linear regression is one of the cornerstones of supervised learning. Its simplicity and ability to generate accurate quantitative predictions make it essential in AI systems, predictive algorithms, time series analysis, and automated trading strategies.
By applying this model to the RSI, you are literally putting artificial intelligence at the heart of a classic indicator, bringing a new dimension to technical analysis.
⯁ VISUAL INTERPRETATION
Imagine an RSI time series like this:
Time →
RSI →
The regression line will smooth these values and extend them n periods into the future, creating a predicted trajectory based on the historical moment. This line becomes the predicted RSI, which can be crossed with the actual RSI to generate more intelligent signals.
⯁ SUMMARY OF SCIENTIFIC CONCEPTS USED
Linear Regression Models the relationship between variables using a straight line.
Least Squares Minimizes the sum of squared errors between prediction and reality.
Time Series Forecasting Estimates future values based on historical data.
Supervised Learning Trains models to predict outputs from known inputs.
Statistical Smoothing Reduces noise and reveals underlying trends.
⯁ WHY THIS INDICATOR IS REVOLUTIONARY
Scientifically-based: Based on statistical theory and mathematical inference.
Unprecedented: First public RSI with least squares predictive modeling.
Intelligent: Built with machine learning logic.
Practical: Generates forward-thinking signals.
Customizable: Flexible for any trading strategy.
⯁ CONCLUSION
By combining RSI with linear regression, this indicator allows a trader to predict market momentum, not just follow it.
RSI Full Forecast is not just an indicator — it is a scientific breakthrough in technical analysis technology.
⯁ Example of simple linear regression, which has one independent variable:
⯁ In linear regression, observations ( red ) are considered to be the result of random deviations ( green ) from an underlying relationship ( blue ) between a dependent variable ( y ) and an independent variable ( x ).
⯁ Visualizing heteroscedasticity in a scatterplot against 100 random fitted values using Matlab:
⯁ The data sets in the Anscombe's quartet are designed to have approximately the same linear regression line (as well as nearly identical means, standard deviations, and correlations) but are graphically very different. This illustrates the pitfalls of relying solely on a fitted model to understand the relationship between variables.
⯁ The result of fitting a set of data points with a quadratic function:
_________________________________________________
🔮 Linear Regression: PineScript Technical Parameters 🔮
_________________________________________________
Forecast Types:
• Flat: Assumes prices will remain the same.
• Linreg: Makes a 'Linear Regression' forecast for n periods.
Technical Information:
ta.linreg (built-in function)
Linear regression curve. A line that best fits the specified prices over a user-defined time period. It is calculated using the least squares method. The result of this function is calculated using the formula: linreg = intercept + slope * (length - 1 - offset), where intercept and slope are the values calculated using the least squares method on the source series.
Syntax:
• Function: ta.linreg()
Parameters:
• source: Source price series.
• length: Number of bars (period).
• offset: Offset.
• return: Linear regression curve.
This function has been cleverly applied to the RSI, making it capable of projecting future values based on past statistical trends.
______________________________________________________
______________________________________________________
⯁ WHAT IS THE RSI❓
The Relative Strength Index (RSI) is a technical analysis indicator developed by J. Welles Wilder. It measures the magnitude of recent price movements to evaluate overbought or oversold conditions in a market. The RSI is an oscillator that ranges from 0 to 100 and is commonly used to identify potential reversal points, as well as the strength of a trend.
⯁ HOW TO USE THE RSI❓
The RSI is calculated based on average gains and losses over a specified period (usually 14 periods). It is plotted on a scale from 0 to 100 and includes three main zones:
• Overbought: When the RSI is above 70, indicating that the asset may be overbought.
• Oversold: When the RSI is below 30, indicating that the asset may be oversold.
• Neutral Zone: Between 30 and 70, where there is no clear signal of overbought or oversold conditions.
______________________________________________________
______________________________________________________
⯁ ENTRY CONDITIONS
The conditions below are fully flexible and allow for complete customization of the signal.
______________________________________________________
______________________________________________________
🔹 CONDITIONS TO BUY 📈
______________________________________________________
• Signal Validity: The signal will remain valid for X bars .
• Signal Sequence: Configurable as AND or OR .
📈 RSI Conditions:
🔹 RSI > Upper
🔹 RSI < Upper
🔹 RSI > Lower
🔹 RSI < Lower
🔹 RSI > Middle
🔹 RSI < Middle
🔹 RSI > MA
🔹 RSI < MA
📈 MA Conditions:
🔹 MA > Upper
🔹 MA < Upper
🔹 MA > Lower
🔹 MA < Lower
📈 Crossovers:
🔹 RSI (Crossover) Upper
🔹 RSI (Crossunder) Upper
🔹 RSI (Crossover) Lower
🔹 RSI (Crossunder) Lower
🔹 RSI (Crossover) Middle
🔹 RSI (Crossunder) Middle
🔹 RSI (Crossover) MA
🔹 RSI (Crossunder) MA
🔹 MA (Crossover) Upper
🔹 MA (Crossunder) Upper
🔹 MA (Crossover) Lower
🔹 MA (Crossunder) Lower
📈 RSI Divergences:
🔹 RSI Divergence Bull
🔹 RSI Divergence Bear
📈 RSI Forecast:
🔹 RSI (Crossover) MA Forecast
🔹 RSI (Crossunder) MA Forecast
🔹 RSI Forecast 1 > MA Forecast 1
🔹 RSI Forecast 1 < MA Forecast 1
🔹 RSI Forecast 2 > MA Forecast 2
🔹 RSI Forecast 2 < MA Forecast 2
🔹 RSI Forecast 3 > MA Forecast 3
🔹 RSI Forecast 3 < MA Forecast 3
🔹 RSI Forecast 4 > MA Forecast 4
🔹 RSI Forecast 4 < MA Forecast 4
🔹 RSI Forecast 5 > MA Forecast 5
🔹 RSI Forecast 5 < MA Forecast 5
🔹 RSI Forecast 6 > MA Forecast 6
🔹 RSI Forecast 6 < MA Forecast 6
🔹 RSI Forecast 7 > MA Forecast 7
🔹 RSI Forecast 7 < MA Forecast 7
🔹 RSI Forecast 8 > MA Forecast 8
🔹 RSI Forecast 8 < MA Forecast 8
🔹 RSI Forecast 9 > MA Forecast 9
🔹 RSI Forecast 9 < MA Forecast 9
🔹 RSI Forecast 10 > MA Forecast 10
🔹 RSI Forecast 10 < MA Forecast 10
🔹 RSI Forecast 11 > MA Forecast 11
🔹 RSI Forecast 11 < MA Forecast 11
🔹 RSI Forecast 12 > MA Forecast 12
🔹 RSI Forecast 12 < MA Forecast 12
🔹 RSI Forecast 13 > MA Forecast 13
🔹 RSI Forecast 13 < MA Forecast 13
🔹 RSI Forecast 14 > MA Forecast 14
🔹 RSI Forecast 14 < MA Forecast 14
🔹 RSI Forecast 15 > MA Forecast 15
🔹 RSI Forecast 15 < MA Forecast 15
🔹 RSI Forecast 16 > MA Forecast 16
🔹 RSI Forecast 16 < MA Forecast 16
🔹 RSI Forecast 17 > MA Forecast 17
🔹 RSI Forecast 17 < MA Forecast 17
🔹 RSI Forecast 18 > MA Forecast 18
🔹 RSI Forecast 18 < MA Forecast 18
🔹 RSI Forecast 19 > MA Forecast 19
🔹 RSI Forecast 19 < MA Forecast 19
🔹 RSI Forecast 20 > MA Forecast 20
🔹 RSI Forecast 20 < MA Forecast 20
______________________________________________________
______________________________________________________
🔸 CONDITIONS TO SELL 📉
______________________________________________________
• Signal Validity: The signal will remain valid for X bars .
• Signal Sequence: Configurable as AND or OR .
📉 RSI Conditions:
🔸 RSI > Upper
🔸 RSI < Upper
🔸 RSI > Lower
🔸 RSI < Lower
🔸 RSI > Middle
🔸 RSI < Middle
🔸 RSI > MA
🔸 RSI < MA
📉 MA Conditions:
🔸 MA > Upper
🔸 MA < Upper
🔸 MA > Lower
🔸 MA < Lower
📉 Crossovers:
🔸 RSI (Crossover) Upper
🔸 RSI (Crossunder) Upper
🔸 RSI (Crossover) Lower
🔸 RSI (Crossunder) Lower
🔸 RSI (Crossover) Middle
🔸 RSI (Crossunder) Middle
🔸 RSI (Crossover) MA
🔸 RSI (Crossunder) MA
🔸 MA (Crossover) Upper
🔸 MA (Crossunder) Upper
🔸 MA (Crossover) Lower
🔸 MA (Crossunder) Lower
📉 RSI Divergences:
🔸 RSI Divergence Bull
🔸 RSI Divergence Bear
📉 RSI Forecast:
🔸 RSI (Crossover) MA Forecast
🔸 RSI (Crossunder) MA Forecast
🔸 RSI Forecast 1 > MA Forecast 1
🔸 RSI Forecast 1 < MA Forecast 1
🔸 RSI Forecast 2 > MA Forecast 2
🔸 RSI Forecast 2 < MA Forecast 2
🔸 RSI Forecast 3 > MA Forecast 3
🔸 RSI Forecast 3 < MA Forecast 3
🔸 RSI Forecast 4 > MA Forecast 4
🔸 RSI Forecast 4 < MA Forecast 4
🔸 RSI Forecast 5 > MA Forecast 5
🔸 RSI Forecast 5 < MA Forecast 5
🔸 RSI Forecast 6 > MA Forecast 6
🔸 RSI Forecast 6 < MA Forecast 6
🔸 RSI Forecast 7 > MA Forecast 7
🔸 RSI Forecast 7 < MA Forecast 7
🔸 RSI Forecast 8 > MA Forecast 8
🔸 RSI Forecast 8 < MA Forecast 8
🔸 RSI Forecast 9 > MA Forecast 9
🔸 RSI Forecast 9 < MA Forecast 9
🔸 RSI Forecast 10 > MA Forecast 10
🔸 RSI Forecast 10 < MA Forecast 10
🔸 RSI Forecast 11 > MA Forecast 11
🔸 RSI Forecast 11 < MA Forecast 11
🔸 RSI Forecast 12 > MA Forecast 12
🔸 RSI Forecast 12 < MA Forecast 12
🔸 RSI Forecast 13 > MA Forecast 13
🔸 RSI Forecast 13 < MA Forecast 13
🔸 RSI Forecast 14 > MA Forecast 14
🔸 RSI Forecast 14 < MA Forecast 14
🔸 RSI Forecast 15 > MA Forecast 15
🔸 RSI Forecast 15 < MA Forecast 15
🔸 RSI Forecast 16 > MA Forecast 16
🔸 RSI Forecast 16 < MA Forecast 16
🔸 RSI Forecast 17 > MA Forecast 17
🔸 RSI Forecast 17 < MA Forecast 17
🔸 RSI Forecast 18 > MA Forecast 18
🔸 RSI Forecast 18 < MA Forecast 18
🔸 RSI Forecast 19 > MA Forecast 19
🔸 RSI Forecast 19 < MA Forecast 19
🔸 RSI Forecast 20 > MA Forecast 20
🔸 RSI Forecast 20 < MA Forecast 20
______________________________________________________
______________________________________________________
🤖 AUTOMATION 🤖
• You can automate the BUY and SELL signals of this indicator.
______________________________________________________
______________________________________________________
⯁ UNIQUE FEATURES
______________________________________________________
Linear Regression: (Forecast)
Signal Validity: The signal will remain valid for X bars
Signal Sequence: Configurable as AND/OR
Condition Table: BUY/SELL
Condition Labels: BUY/SELL
Plot Labels in the Graph Above: BUY/SELL
Automate and Monitor Signals/Alerts: BUY/SELL
Linear Regression (Forecast)
Signal Validity: The signal will remain valid for X bars
Signal Sequence: Configurable as AND/OR
Condition Table: BUY/SELL
Condition Labels: BUY/SELL
Plot Labels in the Graph Above: BUY/SELL
Automate and Monitor Signals/Alerts: BUY/SELL
______________________________________________________
📜 SCRIPT : RSI Full Forecast
🎴 Art by : @Titans_Invest & @DiFlip
👨💻 Dev by : @Titans_Invest & @DiFlip
🎑 Titans Invest — The Wizards Without Gloves 🧤
✨ Enjoy!
______________________________________________________
o Mission 🗺
• Inspire Traders to manifest Magic in the Market.
o Vision 𐓏
• To elevate collective Energy 𐓷𐓏

Kalman Filtered RSI | [DeV]The Kalman Filtered RSI indicator is an advanced tool designed for traders who want precise, noise-free market insights. By enhancing the classic Relative Strength Index (RSI) with a Kalman filter, this indicator delivers a smoother, more reliable view of market momentum, helping you identify trends, reversals, and overbought/oversold conditions with greater accuracy. It’s an ideal choice for traders seeking clear signals amidst market volatility, giving you a competitive edge across any trading environment.
The RSI measures momentum by analyzing price movements over a set period, typically 14 bars. It calculates the average of price gains on up days and the average of price losses on down days, then compares these to produce a value between 0 and 100. An RSI above 70 often indicates an overbought market that may reverse downward, while below 30 suggests an oversold market that could reverse upward. RSI is great for spotting momentum shifts, potential reversals, and trend strength, but it can be noisy in choppy markets, leading to misleading signals.
That's where the Kalman filter comes in; it enhances the RSI by applying a sophisticated smoothing process that predicts the RSI’s next value based on its historical trend, then updates this prediction with the actual RSI reading. It operates in two phases: prediction and correction. In the prediction phase, it uses the previous filtered RSI and adds uncertainty from process noise (Q), which is derived from the historical variance of RSI changes, reflecting how much the RSI might unexpectedly shift. In the correction phase, it calculates a Kalman gain based on the ratio of prediction uncertainty to measurement noise (R), which is determined from the variance between raw RSI and a smoothed version, indicating the raw data’s noisiness. This gain weights how much the filter trusts the new RSI versus the prediction, blending them to produce a smoothed RSI that reduces noise while staying responsive to real trends, outperforming simpler methods like moving averages that often lag or oversmooth.
With the Kalman Filtered RSI, you get a refined view of momentum, making it easier to spot trends and reversals with clarity. This indicator’s ability to dynamically adapt to market changes delivers timely, reliable signals, making it a powerful addition to your trading strategy for any market or timeframe.

RSI Full [Titans_Invest]RSI Full
One of the most complete RSI indicators on the market.
While maintaining the classic RSI foundation, our indicator integrates multiple entry conditions to generate more accurate buy and sell signals.
All conditions are fully configurable, allowing complete customization to fit your trading strategy.
⯁ WHAT IS THE RSI❓
The Relative Strength Index (RSI) is a technical analysis indicator developed by J. Welles Wilder. It measures the magnitude of recent price movements to evaluate overbought or oversold conditions in a market. The RSI is an oscillator that ranges from 0 to 100 and is commonly used to identify potential reversal points, as well as the strength of a trend.
⯁ HOW TO USE THE RSI❓
The RSI is calculated based on average gains and losses over a specified period (usually 14 periods). It is plotted on a scale from 0 to 100 and includes three main zones:
Overbought: When the RSI is above 70, indicating that the asset may be overbought.
Oversold: When the RSI is below 30, indicating that the asset may be oversold.
Neutral Zone: Between 30 and 70, where there is no clear signal of overbought or oversold conditions.
⯁ ENTRY CONDITIONS
The conditions below are fully flexible and allow for complete customization of the signal.
______________________________________________________
🔹 CONDITIONS TO BUY 📈
______________________________________________________
• Signal Validity: The signal will remain valid for X bars .
• Signal Sequence: Configurable as AND/OR .
📈 RSI Conditions:
🔹 RSI > Upper
🔹 RSI < Upper
🔹 RSI > Lower
🔹 RSI < Lower
🔹 RSI > Middle
🔹 RSI < Middle
🔹 RSI > MA
🔹 RSI < MA
📈 MA Conditions:
🔹 MA > Upper
🔹 MA < Upper
🔹 MA > Lower
🔹 MA < Lower
📈 Crossovers:
🔹 RSI (Crossover) Upper
🔹 RSI (Crossunder) Upper
🔹 RSI (Crossover) Lower
🔹 RSI (Crossunder) Lower
🔹 RSI (Crossover) Middle
🔹 RSI (Crossunder) Middle
🔹 RSI (Crossover) MA
🔹 RSI (Crossunder) MA
🔹 MA (Crossover) Upper
🔹 MA (Crossunder) Upper
🔹 MA (Crossover) Lower
🔹 MA (Crossunder) Lower
📈 RSI Divergences:
🔹 RSI Divergence Bull
🔹 RSI Divergence Bear
______________________________________________________
______________________________________________________
🔸 CONDITIONS TO SELL 📉
______________________________________________________
• Signal Validity: The signal will remain valid for X bars .
• Signal Sequence: Configurable as AND/OR .
📉 RSI Conditions:
🔸 RSI > Upper
🔸 RSI < Upper
🔸 RSI > Lower
🔸 RSI < Lower
🔸 RSI > Middle
🔸 RSI < Middle
🔸 RSI > MA
🔸 RSI < MA
📉 MA Conditions:
🔸 MA > Upper
🔸 MA < Upper
🔸 MA > Lower
🔸 MA < Lower
📉 Crossovers:
🔸 RSI (Crossover) Upper
🔸 RSI (Crossunder) Upper
🔸 RSI (Crossover) Lower
🔸 RSI (Crossunder) Lower
🔸 RSI (Crossover) Middle
🔸 RSI (Crossunder) Middle
🔸 RSI (Crossover) MA
🔸 RSI (Crossunder) MA
🔸 MA (Crossover) Upper
🔸 MA (Crossunder) Upper
🔸 MA (Crossover) Lower
🔸 MA (Crossunder) Lower
📉 RSI Divergences:
🔸 RSI Divergence Bull
🔸 RSI Divergence Bear
______________________________________________________
______________________________________________________
🤖 AUTOMATION 🤖
• You can automate the BUY and SELL signals of this indicator.
______________________________________________________
______________________________________________________
⯁ UNIQUE FEATURES
______________________________________________________
Signal Validity: The signal will remain valid for X bars
Signal Sequence: Configurable as AND/OR
Condition Table: BUY/SELL
Condition Labels: BUY/SELL
Plot Labels in the Graph Above: BUY/SELL
Automate and Monitor Signals/Alerts: BUY/SELL
Signal Validity: The signal will remain valid for X bars
Signal Sequence: Configurable as AND/OR
Condition Table: BUY/SELL
Condition Labels: BUY/SELL
Plot Labels in the Graph Above: BUY/SELL
Automate and Monitor Signals/Alerts: BUY/SELL
______________________________________________________
📜 SCRIPT : RSI Full
🎴 Art by : @Titans_Invest & @DiFlip
👨💻 Dev by : @Titans_Invest & @DiFlip
🎑 Titans Invest — The Wizards Without Gloves 🧤
✨ Enjoy the Spell!
______________________________________________________
o Mission 🗺
• Inspire Traders to manifest Magic in the Market.
o Vision 𐓏
• To elevate collective Energy 𐓷𐓏

TICK+ [Pt]█ TICK+ – Advanced US Market Internals & TICK Distribution Tool
TICK+ is a comprehensive indicator that decodes US market internals by leveraging the TICK index—the net difference between stocks ticking up and those ticking down. Unlike many standard TICK tools that only plot raw values, TICK+ provides multiple visualization modes, dynamic moving averages, an independent MA Ribbon, a detailed distribution profile, divergence and pivot analysis, and real-time data tables. This integrated approach offers both visual and quantitative insights into intraday market breadth, trend sustainability, and potential reversals—making it an indispensable tool for trading US indices, futures, and blue‑chip stocks.
Market internals enthusiasts often consider the TICK index indispensable for trading these markets. By offering an immediate snapshot of sentiment and confirming trends through additional analytics, TICK+ gives traders a decisive edge—helping to determine whether a rally is truly supported by broad participation or if caution is warranted.
--------------------------------------------------------------------------------------------------------
█ Key Features:
► Market Internal – Multiple Display Modes:
Line Mode: Plots the TICK index as a continuous line for a clear view of real‑time values and trend direction.
Bar Mode: Uses traditional bar charts to represent the TICK index, emphasizing the magnitude of changes.
Heikin Ashi Mode: Applies the Heikin Ashi technique to smooth out fluctuations, making the underlying trend easier to discern.
Iceberg TICK Mode: Fills the area between zero and the highs in green, and between zero and the lows in red—highlighting how long the market remains in positive versus negative territory.
How It Works & Usage:
These display modes enable traders to select the visualization that best fits their analysis style. For instance, Iceberg TICK Mode highlights the duration of market strength or weakness, a critical factor for intraday directional assessment.
Comparison of Display Modes
► Dual Moving Average – Fast & Slow:
Computes two moving averages on the TICK index:
• Fast MA – reacts quickly to recent changes.
• Slow MA – confirms the overall trend.
Crossovers provide clear signals:
• Fast MA crossing above the slow MA indicates rising bullish momentum.
• Fast MA crossing below the slow MA indicates increasing bearish pressure.
How It Works & Usage:
These dual moving averages assist in detecting momentum shifts. Crossover signals can be used to time entries and exits to align with prevailing market sentiment.
Dual MA Crossover Example
► Moving Average / Smoothed MA – Smoothed & Base Moving Averages:
Calculates a Base MA and a Smoothed MA on the TICK index to reduce short‑term volatility.
Helps clarify the prevailing trend, providing additional confirmation alongside the dual moving averages.
How It Works & Usage:
These averages filter out noise and offer extra validation of the current trend, enhancing the reliability of trading signals.
Base and Smoothed MA Example
► Moving Average Ribbon – MA Ribbon:
Independently plots several moving averages together as a “ribbon,” each line customizable in length and type.
Visually reflects overall market directional strength:
• Consistent green color indicate sustained bullish conditions.
• Uniform red color indicate prevailing bearish sentiment.
How It Works & Usage:
The MA Ribbon provides a layered perspective on market internals. It enables traders to quickly gauge the robustness of a trend or identify early signs of a potential reversal.
MA Ribbon Trend and Shading
► Divergence - Pivot based – Divergence & Pivot Analysis:
Integrates divergence detection with pivot-based trendline analysis.
Identifies instances when the TICK index and price action diverge, serving as an early warning of a weakening trend.
How It Works & Usage:
Divergence signals help refine trade entries and exits by indicating potential trend reversals or adjustments in market sentiment.
Divergence Analysis
► TICK Distribution Profile – TICK Distribution Profile:
Divides the TICK index range into multiple bins to create a profile of how TICK values are distributed.
Identifies the point of control—the level where most TICK readings concentrate—relative to zero.
Allows adjustment of the lookback period to detect shifts in market bias, such as a move from a neutral zone toward extreme levels.
How It Works & Usage:
By visualizing the distribution of TICK readings, traders can monitor changes in market internals that may precede significant trend changes.
TICK Distribution Profile
► ZigZag – ZigZag:
Applies a zigzag algorithm to filter out minor fluctuations and identify significant swing highs and lows.
Highlights trend extremities and potential reversal points.
Offers an optional extension to the last bar for dynamic trend tracking.
How It Works & Usage:
The ZigZag feature helps traders focus on the major price swings that define market structure, eliminating the noise of insignificant movements.
ZigZag Example
► Pivot Trendline – Pivot Trendline:
Draws trendlines connecting pivot highs and pivot lows.
Provides settings to display only the most recent trendline or extend the last trendline.
Assists in identifying evolving support and resistance levels.
How It Works & Usage:
Pivot trendlines offer clear visual cues for key price levels and potential reversal zones, aiding in the timing of trades.
Pivot Trendline Example
► TICK Levels – TICK Levels:
Defines key thresholds for the TICK index, including neutral levels, trend zones, and overbought/oversold (OB/OS) extremes.
Highlights these levels to assist in identifying conditions that may trigger caution or present opportunities.
How It Works & Usage:
Marking these levels provides an immediate reference for assessing when the TICK index enters critical zones, guiding risk management and trade planning.
TICK Levels
► Background Color – Background Color:
Optionally changes the chart background based on TICK or moving average thresholds.
Provides additional visual cues regarding shifts in market sentiment.
How It Works & Usage:
Background color changes help reinforce key signals by immediately indicating shifts in market internals, enhancing overall situational awareness.
Background Color Example
► Data Tables – Data Table:
Displays essential market data in a single, easy-to-read table, including the TICK index source, market sentiment (e.g. Bullish, Bearish, or Neutral), trend status (such as Accelerating ⇗ or Retracing ⇘), and the current TICK value with color-coded strength.
Consolidates numerical data for a quick and precise assessment of market internals.
How It Works & Usage:
The data tables provide live, numerical feedback that complements the visual analysis, making it easy to monitor market sentiment and trend changes at a glance.
Data Table Display with Metrics
--------------------------------------------------------------------------------------------------------
█ Customization & Input Flexibility:
TICK+ offers extensive input options organized into feature‑specific groups, enabling traders to tailor the tool to various strategies:
► Market Internals Group:
Selects the primary TICK index source (with an optional custom override).
Provides a choice of display modes (Line, Bar, Heikin Ashi, Iceberg TICK) with configurable color schemes.
Includes options for iceberg overlays and highlighting.
► Moving Averages Groups (Dual, Smoothed/Base, MA Ribbon):
Dual MA group: Settings for fast and slow moving averages, including type, length, color, and crossover alerts.
Smoothed/Base MA group: Additional methods to filter out short‑term noise and confirm trends.
MA Ribbon group: Independently plots multiple moving averages as a ribbon, with full customization for each line.
► Divergence & Profile Groups:
Includes inputs for divergence detection (source, pivot lookback) and customization of the TICK Distribution Profile (lookback period, color thresholds, layout details).
► ZigZag & Pivot Trendline Groups:
Allows customization of zigzag parameters to highlight trend extremities.
Provides settings for pivot trendline appearance and behavior.
► TICK Levels & Background Colors:
Defines thresholds for neutral, trend, and extreme levels.
Offers color selections for level markers and optional background shading.
► Data Table Configuration:
Enables setting of table location, lookback intervals, and font size to present essential TICK metrics in a user‑friendly format.
--------------------------------------------------------------------------------------------------------
█ Additional Insights:
► TICK Index Fundamentals:
Monitors the net difference between stocks ticking up and down.
A positive reading indicates broader market participation, while a negative reading suggests increased selling pressure.
Understanding how long the TICK stays above or below zero is crucial for gauging intraday momentum.
► Role of Moving Averages:
Smooth out short‑term fluctuations, helping to highlight the prevailing trend.
Crossovers between fast and slow MAs can serve as clear signals for market momentum shifts.
► Interpreting the MA Ribbon:
Provides a layered perspective on market direction.
Consistent color and alignment confirm a strong trend, while variations may hint at reversals.
► Utility of the Distribution Profile:
Breaks down the TICK index into bins, identifying the point of control.
Changes in this control zone—particularly over different lookback periods—can signal potential trend changes.
► Precision of Data Tables:
Supplies live numerical feedback on key market internals, ensuring trading decisions are based on precise, real‑time measurements.
► Comparative Advantage:
Unlike many TICK tools that simply plot raw values, TICK+ provides an integrated, multidimensional analysis of market internals.
Its advanced features—ranging from unique display modes to sophisticated analytical components—make it indispensable for trading US indices, futures, and blue‑chip stocks.
--------------------------------------------------------------------------------------------------------
Disclaimer
This indicator is provided for educational and research purposes only and does not constitute financial advice. Trading involves risk, and thorough testing on historical data is recommended before applying any strategy using TICK+ in live markets.

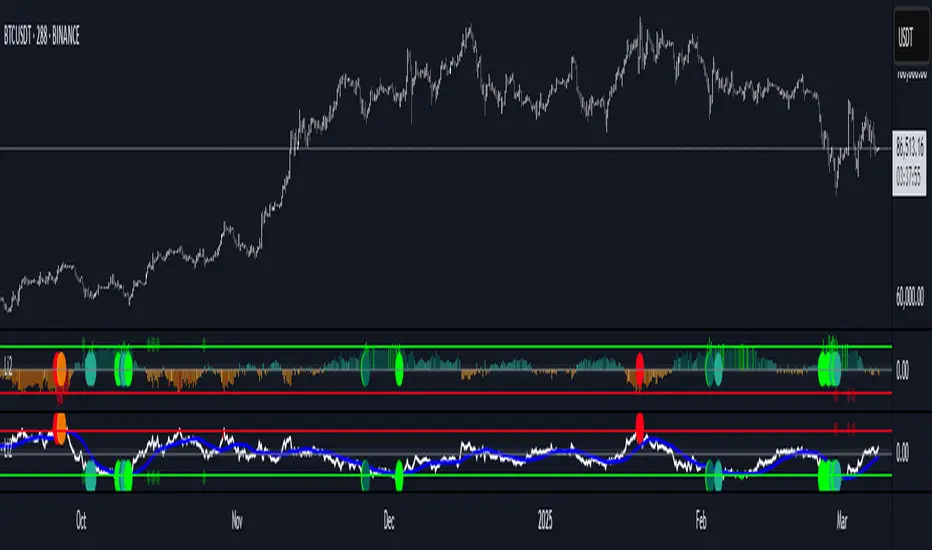
Liquidity Imbalance Index (Li2)How to Use the Liquidity Imbalance Index (Li2)
The Liquidity Imbalance Index (Li2) is designed to track market liquidity and identify significant imbalances between buyers and sellers. Here's how to effectively use this indicator in your trading:
Understanding the Main Components
1. Liquidity Delta Histogram/Line:
- Shows the difference between buy and sell liquidity
- Green bars/line: Buying pressure dominates
- Red bars/line: Selling pressure dominates
- The intensity of color shows the strength of the imbalance
2. Threshold Lines:
- Upper (green) threshold: Marks significant buy pressure
- Lower (red) threshold: Marks significant sell pressure
- Neutral zone: Area between the dotted lines where neither buyers nor sellers dominate
3. Liquidity Zones (circles shown on top/bottom):
- Green circles on upper threshold: Historical bull zones (significant buying interest)
- Red circles on lower threshold: Historical bear zones (significant selling interest)
- These zones require multiple hits, consecutive signals, and optionally volume confirmation
Trading Strategies
For Trend Trading
1. Look for when the Liquidity Delta crosses above the upper threshold for bullish signals
2. Look for when the Liquidity Delta crosses below the lower threshold for bearish signals
3. Especially powerful when crossing occurs with acceleration (darker histogram colors)
For Support and Resistance
1. Identify where the significant bull/bear zones appear (green/red circles)
2. These often align with important price levels where orders cluster
3. Use these zones as potential reversal or confirmation points
For Divergence
1. Watch for price making new highs/lows while liquidity shows the opposite
2. Divergence between price and liquidity can signal potential reversals
Volume Confirmation
1. Pay attention to volume-confirmed signals (small circles at zero line)
2. These indicate stronger conviction behind the liquidity imbalance
Optimal Settings
- For day trading or volatile markets, consider reducing lookback periods and increasing thresholds
- For swing trading, the default settings work well to capture significant zones
- In ranging markets, focus on the zones as they often mark the range boundaries
- In trending markets, follow the overall direction of the liquidity delta
Reading Acceleration Signals
The indicator shows color intensity variations to highlight acceleration in liquidity flows:
- Dark green/red: Strong acceleration (rapid shift in order flow)
- Medium green/red: Medium acceleration
- Light green/red: Weak acceleration
These acceleration signals often precede significant price movements.