Institutional Supply/Demand (Unmitigated)Title: Institutional Supply/Demand (Unmitigated)
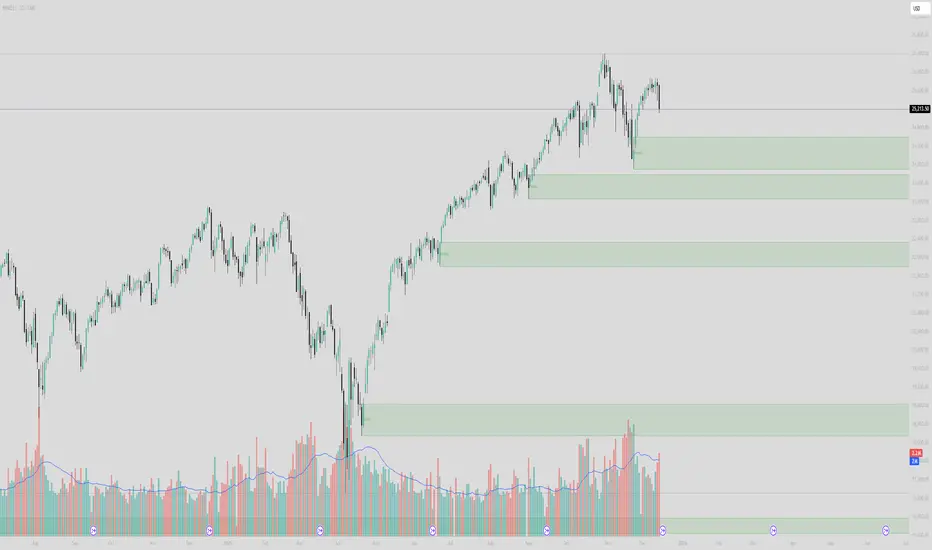
What it does: This indicator automatically detects and highlights Fresh Institutional Supply and Demand Zones based on market structure (Swing Highs and Swing Lows). It is designed to keep your chart clean by only showing levels that have not yet been tested.
Key Features:
Auto-Detection:
Red Boxes (Supply): Appear at major Swing Highs. These represent potential Sell Limit orders from institutions.
Green Boxes (Demand): Appear at major Swing Lows. These represent potential Buy Limit orders.
Mitigation Logic (The "Clean-Up"):
The script actively monitors price action.
If price touches a box, the box is instantly deleted.
This ensures you are never looking at "old" or "used" levels. If a box is visible on your chart, it means price has never returned to that level since it was created.
Customizable Structure:
Structure Lookback: Adjusts how sensitive the detection is.
Setting 5 (Default): Finds major, significant structure points.
Setting 3: Finds smaller, internal structure points (more zones).
How to Trade:
Wait for Price to Return: Watch for price to approach a visible Red or Green box.
Reaction: Since these are "Fresh" levels, look for a rejection (wick) or a reversal pattern as soon as price taps the zone.
No Clutter: You don't need to manually delete old lines; the script does it for you.
Institution
Coinbase/Binance Premium Histogram PCPR1NCIPALSummary of the "Coinbase/Binance Premium Histogram" Indicator:
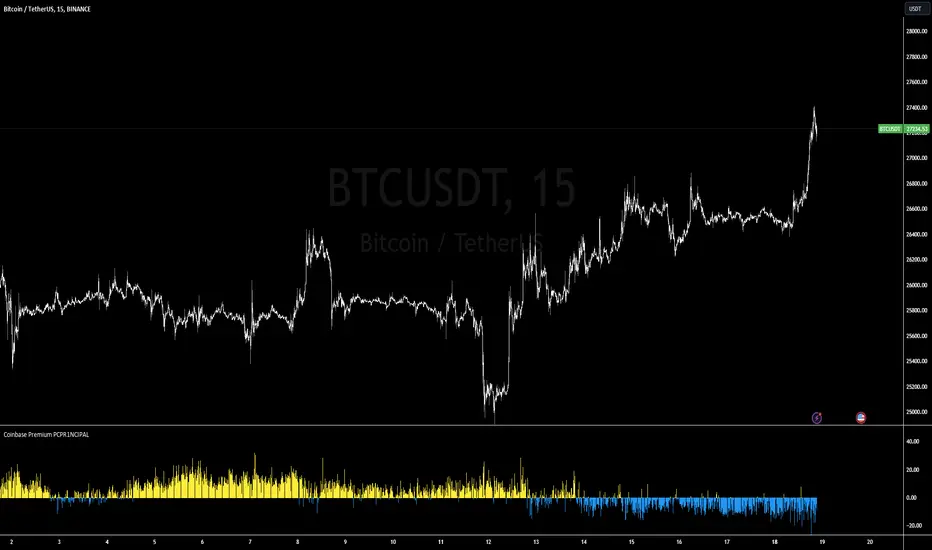
The "Coinbase/Binance Premium Histogram" is a custom indicator developed for trading platforms that support the Pine Script language, primarily TradingView. Its primary function is to visualize the price differential or "premium" between Bitcoin's (BTC) price on two major exchanges: Coinbase and Binance.
Key Features:
Data Sources: The indicator pulls the closing prices of Bitcoin (BTC) from both the Coinbase (BTCUSD) and Binance (BTCUSDT) exchanges.
Premium Calculation: The indicator computes the premium by subtracting the Coinbase price from the Binance price.
If the result is positive, this means the BTC price on Binance is higher than on Coinbase.
Conversely, if the result is negative, this indicates that the BTC price on Coinbase is higher than on Binance.
Histogram Visualization: The price differential or "premium" is then plotted as a histogram.
Bars above the zero line (in blue) represent instances where the Binance price is higher than the Coinbase price.
Bars below the zero line (in red) represent instances where the Coinbase price is higher than the Binance price.
Color Coding: The histogram uses color coding to easily differentiate between positive and negative premiums:
Blue Bars: Indicate a positive premium, meaning BTC on Binance is priced higher than on Coinbase.
Red Bars: Indicate a negative premium, implying BTC on Coinbase is priced higher than on Binance.
Purpose: Traders and investors can use this indicator to spot potential arbitrage opportunities between the two exchanges or for signs of institutional buying. A significant difference in prices could mean a chance to buy BTC cheaper on one platform and sell at a higher price on the other, thereby capitalizing on the price disparity. However, it's essential to consider transaction fees, potential transfer delays, and other associated risks before pursuing any arbitrage strategy.
Institutional BiasShows what we at TRI call the institutional bias, i.e. a bull bias when 9 ema is above 18 ema and a bear bias when the 9 ema is below the 18 ema.
Plots the 9 and 18 ema, and fills the background green when the institutional bias is bullish and red when it is bearish.

Commitment of Traders (COT) NonCom with Average (by Lowphat)Commitment of Traders Non Commercial with Trailing Average
