Kernels©2024, GoemonYae; copied from @jdehorty's "KernelFunctions" on 2024-03-09 to ensure future dependency compatibility. Will also add more functions to this script.
Library "KernelFunctions"
This library provides non-repainting kernel functions for Nadaraya-Watson estimator implementations. This allows for easy substition/comparison of different kernel functions for one another in indicators. Furthermore, kernels can easily be combined with other kernels to create newer, more customized kernels.
rationalQuadratic(_src, _lookback, _relativeWeight, startAtBar)
Rational Quadratic Kernel - An infinite sum of Gaussian Kernels of different length scales.
Parameters:
_src (float) : The source series.
_lookback (simple int) : The number of bars used for the estimation. This is a sliding value that represents the most recent historical bars.
_relativeWeight (simple float) : Relative weighting of time frames. Smaller values resut in a more stretched out curve and larger values will result in a more wiggly curve. As this value approaches zero, the longer time frames will exert more influence on the estimation. As this value approaches infinity, the behavior of the Rational Quadratic Kernel will become identical to the Gaussian kernel.
startAtBar (simple int)
Returns: yhat The estimated values according to the Rational Quadratic Kernel.
gaussian(_src, _lookback, startAtBar)
Gaussian Kernel - A weighted average of the source series. The weights are determined by the Radial Basis Function (RBF).
Parameters:
_src (float) : The source series.
_lookback (simple int) : The number of bars used for the estimation. This is a sliding value that represents the most recent historical bars.
startAtBar (simple int)
Returns: yhat The estimated values according to the Gaussian Kernel.
periodic(_src, _lookback, _period, startAtBar)
Periodic Kernel - The periodic kernel (derived by David Mackay) allows one to model functions which repeat themselves exactly.
Parameters:
_src (float) : The source series.
_lookback (simple int) : The number of bars used for the estimation. This is a sliding value that represents the most recent historical bars.
_period (simple int) : The distance between repititions of the function.
startAtBar (simple int)
Returns: yhat The estimated values according to the Periodic Kernel.
locallyPeriodic(_src, _lookback, _period, startAtBar)
Locally Periodic Kernel - The locally periodic kernel is a periodic function that slowly varies with time. It is the product of the Periodic Kernel and the Gaussian Kernel.
Parameters:
_src (float) : The source series.
_lookback (simple int) : The number of bars used for the estimation. This is a sliding value that represents the most recent historical bars.
_period (simple int) : The distance between repititions of the function.
startAtBar (simple int)
Returns: yhat The estimated values according to the Locally Periodic Kernel.
Kernel

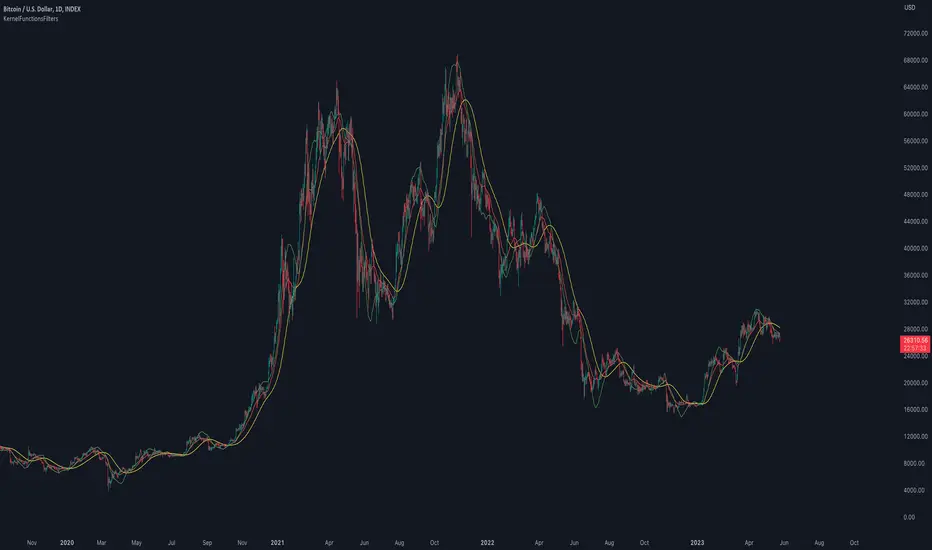
KernelFunctionsFiltersLibrary "KernelFunctionsFilters"
This library provides filters for non-repainting kernel functions for Nadaraya-Watson estimator implementations made by @jdehorty. Filters include a smoothing formula and zero lag formula. You can find examples in the code. For more information check out the original library KernelFunctions.
rationalQuadratic(_src, _lookback, _relativeWeight, startAtBar, _filter)
Parameters:
_src (float)
_lookback (simple int)
_relativeWeight (simple float)
startAtBar (simple int)
_filter (simple string)
gaussian(_src, _lookback, startAtBar, _filter)
Parameters:
_src (float)
_lookback (simple int)
startAtBar (simple int)
_filter (simple string)
periodic(_src, _lookback, _period, startAtBar, _filter)
Parameters:
_src (float)
_lookback (simple int)
_period (simple int)
startAtBar (simple int)
_filter (simple string)
locallyPeriodic(_src, _lookback, _period, startAtBar, _filter)
Parameters:
_src (float)
_lookback (simple int)
_period (simple int)
startAtBar (simple int)
_filter (simple string)
j(line1, line2)
Parameters:
line1 (float)
line2 (float)
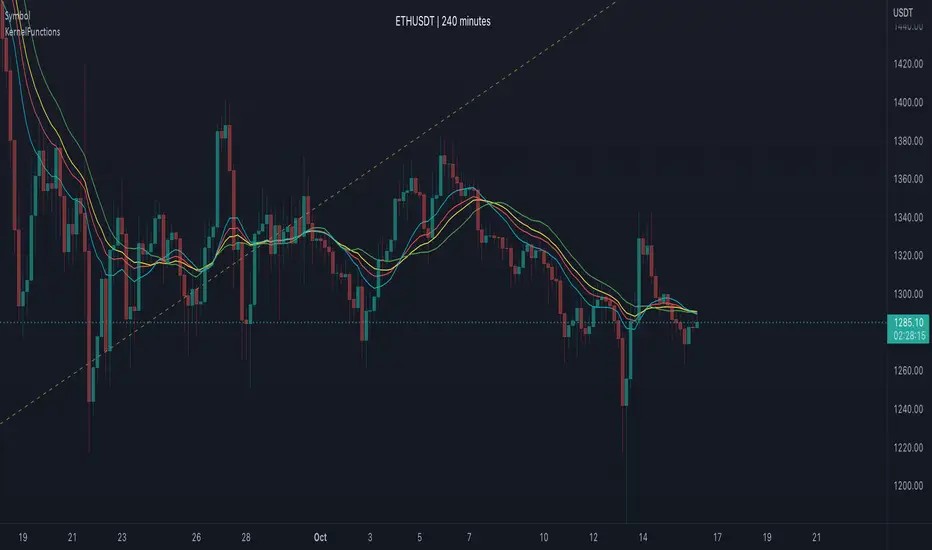
KernelFunctionsLibrary "KernelFunctions"
This library provides non-repainting kernel functions for Nadaraya-Watson estimator implementations. This allows for easy substitution/comparison of different kernel functions for one another in indicators. Furthermore, kernels can easily be combined with other kernels to create newer, more customized kernels. Compared to Moving Averages (which are really just simple kernels themselves), these kernel functions are more adaptive and afford the user an unprecedented degree of customization and flexibility.
rationalQuadratic(_src, _lookback, _relativeWeight, _startAtBar)
Rational Quadratic Kernel - An infinite sum of Gaussian Kernels of different length scales.
Parameters:
_src : The source series.
_lookback : The number of bars used for the estimation. This is a sliding value that represents the most recent historical bars.
_relativeWeight : Relative weighting of time frames. Smaller values result in a more stretched-out curve, and larger values will result in a more wiggly curve. As this value approaches zero, the longer time frames will exert more influence on the estimation. As this value approaches infinity, the behavior of the Rational Quadratic Kernel will become identical to the Gaussian kernel.
_startAtBar : Bar index on which to start regression. The first bars of a chart are often highly volatile, and omitting these initial bars often leads to a better overall fit.
Returns: yhat The estimated values according to the Rational Quadratic Kernel.
gaussian(_src, _lookback, _startAtBar)
Gaussian Kernel - A weighted average of the source series. The weights are determined by the Radial Basis Function (RBF).
Parameters:
_src : The source series.
_lookback : The number of bars used for the estimation. This is a sliding value that represents the most recent historical bars.
_startAtBar : Bar index on which to start regression. The first bars of a chart are often highly volatile, and omitting these initial bars often leads to a better overall fit.
Returns: yhat The estimated values according to the Gaussian Kernel.
periodic(_src, _lookback, _period, _startAtBar)
Periodic Kernel - The periodic kernel (derived by David Mackay) allows one to model functions that repeat themselves exactly.
Parameters:
_src : The source series.
_lookback : The number of bars used for the estimation. This is a sliding value that represents the most recent historical bars.
_period : The distance between repititions of the function.
_startAtBar : Bar index on which to start regression. The first bars of a chart are often highly volatile, and omitting these initial bars often leads to a better overall fit.
Returns: yhat The estimated values according to the Periodic Kernel.
locallyPeriodic(_src, _lookback, _period, _startAtBar)
Locally Periodic Kernel - The locally periodic kernel is a periodic function that slowly varies with time. It is the product of the Periodic Kernel and the Gaussian Kernel.
Parameters:
_src : The source series.
_lookback : The number of bars used for the estimation. This is a sliding value that represents the most recent historical bars.
_period : The distance between repititions of the function.
_startAtBar : Bar index on which to start regression. The first bars of a chart are often highly volatile, and omitting these initial bars often leads to a better overall fit.
Returns: yhat The estimated values according to the Locally Periodic Kernel.
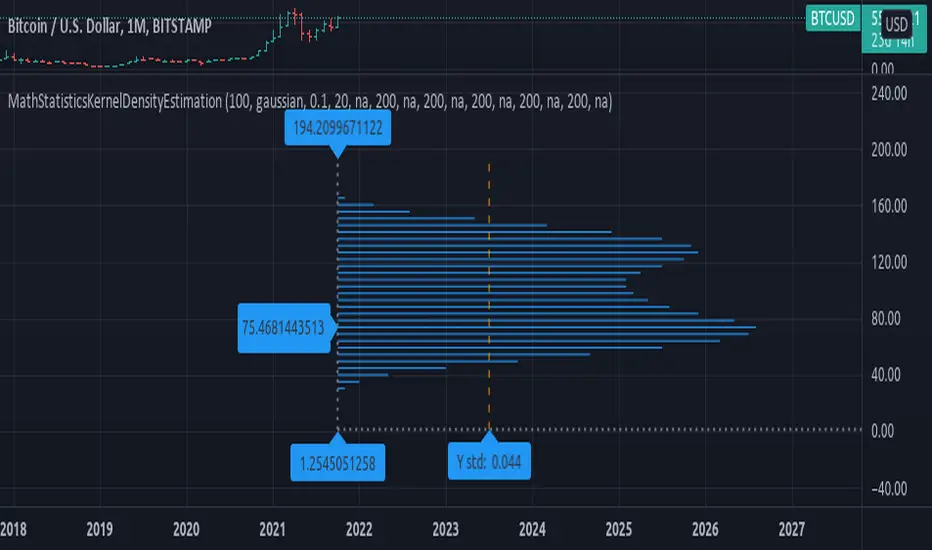
MathStatisticsKernelDensityEstimationLibrary "MathStatisticsKernelDensityEstimation"
(KDE) Method for Kernel Density Estimation
kde(observations, kernel, bandwidth, nsteps)
Parameters:
observations : float array, sample data.
kernel : string, the kernel to use, default='gaussian', options='uniform', 'triangle', 'epanechnikov', 'quartic', 'triweight', 'gaussian', 'cosine', 'logistic', 'sigmoid'.
bandwidth : float, bandwidth to use in kernel, default=0.5, range=(0, +inf), less will smooth the data.
nsteps : int, number of steps in range of distribution, default=20, this value is connected to how many line objects you can display per script.
Returns: tuple with signature: (float array, float array)
draw_horizontal(distribution_x, distribution_y, distribution_lines, graph_lines, graph_labels) Draw a horizontal distribution at current location on chart.
Parameters:
distribution_x : float array, distribution points x value.
distribution_y : float array, distribution points y value.
distribution_lines : line array, array to append the distribution curve lines.
graph_lines : line array, array to append the graph lines.
graph_labels : label array, array to append the graph labels.
Returns: void, updates arrays: distribution_lines, graph_lines, graph_labels.
draw_vertical(distribution_x, distribution_y, distribution_lines, graph_lines, graph_labels) Draw a vertical distribution at current location on chart.
Parameters:
distribution_x : float array, distribution points x value.
distribution_y : float array, distribution points y value.
distribution_lines : line array, array to append the distribution curve lines.
graph_lines : line array, array to append the graph lines.
graph_labels : label array, array to append the graph labels.
Returns: void, updates arrays: distribution_lines, graph_lines, graph_labels.
style_distribution(lines, horizontal, to_histogram, line_color, line_style, linewidth) Style the distribution lines.
Parameters:
lines : line array, distribution lines to style.
horizontal : bool, default=true, if the display is horizontal(true) or vertical(false).
to_histogram : bool, default=false, if graph style should be switched to histogram.
line_color : color, default=na, if defined will change the color of the lines.
line_style : string, defaul=na, if defined will change the line style, options=('na', line.style_solid, line.style_dotted, line.style_dashed, line.style_arrow_right, line.style_arrow_left, line.style_arrow_both)
linewidth : int, default=na, if defined will change the line width.
Returns: void.
style_graph(lines, lines, horizontal, line_color, line_style, linewidth) Style the graph lines and labels
Parameters:
lines : line array, graph lines to style.
lines : labels array, graph labels to style.
horizontal : bool, default=true, if the display is horizontal(true) or vertical(false).
line_color : color, default=na, if defined will change the color of the lines.
line_style : string, defaul=na, if defined will change the line style, options=('na', line.style_solid, line.style_dotted, line.style_dashed, line.style_arrow_right, line.style_arrow_left, line.style_arrow_both)
linewidth : int, default=na, if defined will change the line width.
Returns: void.