ZynIQ Order Block Master Pro v2 - (Pro Plus Pack)Overview
ZynIQ Order Block Master Pro v2 identifies areas where price showed strong displacement and left behind significant zones of interest. It highlights potential reaction areas, continuation blocks and mitigation zones based on structural behaviour and directional flow.
Key Features
• Automatic detection of bullish and bearish order block zones
• Optional refinement filters for higher-quality zones
• Displacement-aware logic to reduce weak signals
• Optional mitigation markers when price revisits a zone
• Configurable sensitivity for different markets and timeframes
• Clean labels and minimal chart clutter
• Complements structure, liquidity and FVG tools
Use Cases
• Highlighting key reaction areas based on previous strong moves
• Tracking potential continuation or reversal zones
• Combining order blocks with BOS/CHOCH and liquidity mapping
• Building confluence with breakout or volume tools
Notes
This tool provides contextual price zones based on displacement and structural movement. It is not a standalone trading system. Use with your own confirmation and risk management.
Mitigation

cd_VWAP_mtg_CxCd_VWAP_mtg_Cx
Overview
The most important condition for being successful and profitable in the market is to consistently follow the same rules without compromise, while the price constantly moves in countless different ways.
Regardless of the concept or trading school, those who have rules win.
In this indicator, we will define and use three main sections to set and apply our rules.
The indicator uses the VWAP (Volume Weighted Average Price) — price weighted by volume.
Two VWAPs can be displayed either by manually entering date and time, or by selecting from the menu.
From the menu, you can select the following reference levels:
• HTF Open: Opening candle of the higher timeframe
• ATH / ATL: All-Time High / All-Time Low candles
• PMH / PML, PWH / PWL, PDH / PDL, PH4H / PH4L: Previous Month, Week, Day, or H4 Highs/Lows
• MH / ML, WH / WL, DH / DL, H4H / H4L: Current Month, Week, Day, or H4 Highs/Lows
Additionally, it includes:
• Mitigation / Order Block zones (local buyer-seller balance) across two timeframes.
• Buy/Sell Side Liquidity levels (BSL / SSL) from the aligned higher timeframe (target levels).
________________________________________
Components and Usage
1 – VWAP
Calculated using the classical method:
• High + Volume for the upper value
• Close + Volume for the middle value
• Low + Volume for the lower value
The VWAP is displayed as a colored band, where the coloring represents the bias.
Let’s call this band FVB (Fair Value Band) for ease of explanation.
The FVB represents the final line of defense, the buyer/seller boundary, and in technical terms, it can be viewed as premium/discount zones or support/resistance levels.
Within this critical area, the strong side continues its move, while the weaker side is forced to retreat.
But does the side that breaks beyond the band always keep going?
We all know that’s not always the case — in different pairs and timeframes, price often violates both the upper and lower edges multiple times.
To achieve more consistent analysis, we’ll define a new set of rules.
________________________________________
2 – Mitigation / Order Blocks
In trading literature, there are dozens of different definitions and uses of mitigation or order blocks.
Here, we will interpret the candlesticks to create our own definition, and we’ll use the zones defined by candles that fit this pattern.
For simplicity, let’s abbreviate mitigation as “mtg.”
For a candle to be selected as an mtg, it must clearly show strength from one side (buyers or sellers) — which can also be observed visually on the chart.
________________________________________
Bullish mtg criteria:
1. The first candle must be bullish (close > open) → buyers are strong.
2. The next candle makes a new high (buyers push higher) but fails to close above and pulls back to close inside the previous range → sellers react.
It also must not break the previous low → buyers defend.
3. In the following candle(s), as long as the first candle’s low is protected and the second candle’s high is broken, it indicates buyer strength → a bullish mtg is confirmed.
When price returns to this zone later (gets mitigated), the expectation is that the zone holds and price pushes upward again.
If the low is violated, the mtg becomes invalid.
In technical terms:
If the previous candle’s high is broken but no close occurs above it, the expectation is a reversal move that will retest its low.
Question:
What if the low is protected and in the next candle(s) a new high forms?
Answer: → Bullish mtg.
Bearish mtg (opposite)
3 – Buy/Sell Side Liquidity Levels
With the help of the aligned higher timeframe (swing points), we will define our market structure framework and set our liquidity targets accordingly.
Let’s put the pieces together.
If we continue explaining from a trade-focused perspective, our first priority should be our bias — our projection or expectation of the market’s potential movement.
We will determine this bias using the FVB.
Since we know the band often gets violated on both sides, we want the price action to convince us of its strength.
To do that, we’ll use the first candle that closes beyond the band.
The distance from that candle’s high to low will be our threshold range
Bullish level = high + (candle length × coefficient)
Bearish level = low - (candle length × coefficient)
When the price closes beyond this threshold, it demonstrates strength, and our bias will now align in that direction.
How long will this bias remain valid?
→ Until a closing candle appears on the opposite side of the band.
If a close occurs on the opposite side, then a new bias will only be confirmed once the new threshold level is broken.
During the period in between, we have no bias.
Let’s continue on the chart:
Now that our bias has been established, where and how do we look for trade opportunities?
There are two possible entry approaches:
• Aggressive entry: Enter immediately with the breakout.
• Conservative entry: Wait for a pullback and enter once a suitable structure forms.
(The choice depends on the user’s preference.)
At this stage, the user can apply their own entry model. Let’s give an example:
Let’s assume we’re looking for setups using HTF sweep + LTF CISD confirmation.
Once our bias turns bearish, we look for an HTF sweep forming on or near an FVB or mtg block, and then confirm the entry with a CISD signal.
In summary:
• FVB defines the bias, the entry zone, and the target zone.
• Mtg blocks represent entry zones.
• BSL / SSL levels suggest target zones.
Overlapping FVB and mtg blocks are expected to be more effective.
The indicator also provides an option for a second FVB.
A band attached to a lower timeframe can be used as confirmation.
• Main band: Bias + FVB
• Extra band: Entry trigger confirmed by a close beyond it.
Mtg blocks can provide trade entry opportunities, especially when the price is moving strongly in one direction (flow).
Consecutive or complementary mtg blocks indicate that the price is decisive in one direction, while sometimes also showing areas where we should wait before entering.
Mtg blocks that contain an FVG (Fair Value Gap) within their body are expected to be more effective.
Settings:
The default values are set to 1-3-5m, optimized for scalping trades.
VWAP settings:
Main VWAP (FVB):
• Can be set by selecting a start time, manually entering date and time, or choosing a predefined level.
Extra VWAP (FVB):
• Set from the menu. If not needed, select “none.”
• Visibility, color, and fill settings for VWAP are located here.
• Threshold levels visibility and color options are also in this section.
• The multiplier is used for calculating the threshold level.
Important:
• If the Extra VWAP is selected but not displayed, you need to increase the chart timeframe.
o Example: If the chart is on 3m and you select WH from the extra options, it will not display correctly.
• Upper limits for VWAP:
o 1m and 3m charts: daily High/Low
o 5m chart: weekly High/Low
________________________________________
Mtg Settings:
• Visibility and color settings for blocks are configured here.
• To display on a second timeframe, the box must be checked and the timeframe specified.
• Optional display modes: “only active blocks,” “only last violated mtg,” or “all.”
• For confirmation and removal criteria, choosing high/low or close determines the source used for mtg block formation and deletion conditions.
BSL/SSL Settings:
• Visibility, color, font size, and line style can be configured in this section.
When “Auto” is selected, the aligned timeframe is determined automatically by the indicator, while in manual mode, the user defines the timeframe.
Final Words:
Simply opening trades every time the price touches the VWAP or mtg blocks will not make you a profitable trader. Searching for setups with similar structures while maintaining proper risk management will yield better results in the long run.
I would be happy to hear your feedback and suggestions.
Happy trading!

FvgCalculations█ OVERVIEW
This library provides the core calculation engine for identifying Fair Value Gaps (FVGs) across different timeframes and for processing their interaction with price. It includes functions to detect FVGs on both the current chart and higher timeframes, as well as to check for their full or partial mitigation.
█ CONCEPTS
The library's primary functions revolve around the concept of Fair Value Gaps and their lifecycle.
Fair Value Gap (FVG) Identification
An FVG, or imbalance, represents a price range where buying or selling pressure was significant enough to cause a rapid price movement, leaving an "inefficiency" in the market. This library identifies FVGs based on three-bar patterns:
Bullish FVG: Forms when the low of the current bar (bar 3) is higher than the high of the bar two periods prior (bar 1). The FVG is the space between the high of bar 1 and the low of bar 3.
Bearish FVG: Forms when the high of the current bar (bar 3) is lower than the low of the bar two periods prior (bar 1). The FVG is the space between the low of bar 1 and the high of bar 3.
The library provides distinct functions for detecting FVGs on the current (Low Timeframe - LTF) and specified higher timeframes (Medium Timeframe - MTF / High Timeframe - HTF).
FVG Mitigation
Mitigation refers to price revisiting an FVG.
Full Mitigation: An FVG is considered fully mitigated when price completely closes the gap. For a bullish FVG, this occurs if the current low price moves below or touches the FVG's bottom. For a bearish FVG, it occurs if the current high price moves above or touches the FVG's top.
Partial Mitigation (Entry/Fill): An FVG is partially mitigated when price enters the FVG's range but does not fully close it. The library tracks the extent of this fill. For a bullish FVG, if the current low price enters the FVG from above, that low becomes the new effective top of the remaining FVG. For a bearish FVG, if the current high price enters the FVG from below, that high becomes the new effective bottom of the remaining FVG.
FVG Interaction
This refers to any instance where the current bar's price range (high to low) touches or crosses into the currently unfilled portion of an active (visible and not fully mitigated) FVG.
Multi-Timeframe Data Acquisition
To detect FVGs on higher timeframes, specific historical bar data (high, low, and time of bars at indices and relative to the higher timeframe's last completed bar) is required. The requestMultiTFBarData function is designed to fetch this data efficiently.
█ CALCULATIONS AND USE
The functions in this library are typically used in a sequence to manage FVGs:
1. Data Retrieval (for MTF/HTF FVGs):
Call requestMultiTFBarData() with the desired higher timeframe string (e.g., "60", "D").
This returns a tuple of htfHigh1, htfLow1, htfTime1, htfHigh3, htfLow3, htfTime3.
2. FVG Detection:
For LTF FVGs: Call detectFvg() on each confirmed bar. It uses high , low, low , and high along with barstate.isconfirmed.
For MTF/HTF FVGs: Call detectMultiTFFvg() using the data obtained from requestMultiTFBarData().
Both detection functions return an fvgObject (defined in FvgTypes) if an FVG is found, otherwise na. They also can classify FVGs as "Large Volume" (LV) if classifyLV is true and the FVG size (top - bottom) relative to the tfAtr (Average True Range of the respective timeframe) meets the lvAtrMultiplier.
3. FVG State Updates (on each new bar for existing FVGs):
First, check for overall price interaction using fvgInteractionCheck(). This function determines if the current bar's high/low has touched or entered the FVG's currentTop or currentBottom.
If interaction occurs and the FVG is not already mitigated:
Call checkMitigation() to determine if the FVG has been fully mitigated by the current bar's currentHigh and currentLow. If true, the FVG's isMitigated status is updated.
If not fully mitigated, call checkPartialMitigation() to see if the price has further entered the FVG. This function returns the newLevel to which the FVG has been filled (e.g., currentLow for a bullish FVG, currentHigh for bearish). This newLevel is then used to update the FVG's currentTop or currentBottom.
The calling script (e.g., fvgMain.c) is responsible for storing and managing the array of fvgObject instances and passing them to these update functions.
█ NOTES
Bar State for LTF Detection: The detectFvg() function relies on barstate.isconfirmed to ensure FVG detection is based on closed bars, preventing FVGs from being detected prematurely on the currently forming bar.
Higher Timeframe Data (lookahead): The requestMultiTFBarData() function uses lookahead = barmerge.lookahead_on. This means it can access historical data from the higher timeframe that corresponds to the current bar on the chart, even if the higher timeframe bar has not officially closed. This is standard for multi-timeframe analysis aiming to plot historical HTF data accurately on a lower timeframe chart.
Parameter Typing: Functions like detectMultiTFFvg and detectFvg infer the type for boolean (classifyLV) and numeric (lvAtrMultiplier) parameters passed from the main script, while explicitly typed series parameters (like htfHigh1, currentAtr) expect series data.
fvgObject Dependency: The FVG detection functions return fvgObject instances, and fvgInteractionCheck takes an fvgObject as a parameter. This UDT is defined in the FvgTypes library, making it a dependency for using FvgCalculations.
ATR for LV Classification: The tfAtr (for MTF/HTF) and currentAtr (for LTF) parameters are expected to be the Average True Range values for the respective timeframes. These are used, if classifyLV is enabled, to determine if an FVG's size qualifies it as a "Large Volume" FVG based on the lvAtrMultiplier.
MTF/HTF FVG Appearance Timing: When displaying FVGs from a higher timeframe (MTF/HTF) on a lower timeframe (LTF) chart, users might observe that the most recent MTF/HTF FVG appears one LTF bar later compared to its appearance on a native MTF/HTF chart. This is an expected behavior due to the detection mechanism in `detectMultiTFFvg`. This function uses historical bar data from the MTF/HTF (specifically, data equivalent to `HTF_bar ` and `HTF_bar `) to identify an FVG. Therefore, all three bars forming the FVG on the MTF/HTF must be fully closed and have shifted into these historical index positions relative to the `request.security` call from the LTF chart before the FVG can be detected and displayed on the LTF. This ensures that the MTF/HTF FVG is identified based on confirmed, closed bars from the higher timeframe.
█ EXPORTED FUNCTIONS
requestMultiTFBarData(timeframe)
Requests historical bar data for specific previous bars from a specified higher timeframe.
It fetches H , L , T (for the bar before last) and H , L , T (for the bar three periods prior)
from the requested timeframe.
This is typically used to identify FVG patterns on MTF/HTF.
Parameters:
timeframe (simple string) : The higher timeframe to request data from (e.g., "60" for 1-hour, "D" for Daily).
Returns: A tuple containing: .
- htfHigh1 (series float): High of the bar at index 1 (one bar before the last completed bar on timeframe).
- htfLow1 (series float): Low of the bar at index 1.
- htfTime1 (series int) : Time of the bar at index 1.
- htfHigh3 (series float): High of the bar at index 3 (three bars before the last completed bar on timeframe).
- htfLow3 (series float): Low of the bar at index 3.
- htfTime3 (series int) : Time of the bar at index 3.
detectMultiTFFvg(htfHigh1, htfLow1, htfTime1, htfHigh3, htfLow3, htfTime3, tfAtr, classifyLV, lvAtrMultiplier, tfType)
Detects a Fair Value Gap (FVG) on a higher timeframe (MTF/HTF) using pre-fetched bar data.
Parameters:
htfHigh1 (float) : High of the first relevant bar (typically high ) from the higher timeframe.
htfLow1 (float) : Low of the first relevant bar (typically low ) from the higher timeframe.
htfTime1 (int) : Time of the first relevant bar (typically time ) from the higher timeframe.
htfHigh3 (float) : High of the third relevant bar (typically high ) from the higher timeframe.
htfLow3 (float) : Low of the third relevant bar (typically low ) from the higher timeframe.
htfTime3 (int) : Time of the third relevant bar (typically time ) from the higher timeframe.
tfAtr (float) : ATR value for the higher timeframe, used for Large Volume (LV) FVG classification.
classifyLV (bool) : If true, FVGs will be assessed to see if they qualify as Large Volume.
lvAtrMultiplier (float) : The ATR multiplier used to define if an FVG is Large Volume.
tfType (series tfType enum from no1x/FvgTypes/1) : The timeframe type (e.g., types.tfType.MTF, types.tfType.HTF) of the FVG being detected.
Returns: An fvgObject instance if an FVG is detected, otherwise na.
detectFvg(classifyLV, lvAtrMultiplier, currentAtr)
Detects a Fair Value Gap (FVG) on the current (LTF - Low Timeframe) chart.
Parameters:
classifyLV (bool) : If true, FVGs will be assessed to see if they qualify as Large Volume.
lvAtrMultiplier (float) : The ATR multiplier used to define if an FVG is Large Volume.
currentAtr (float) : ATR value for the current timeframe, used for LV FVG classification.
Returns: An fvgObject instance if an FVG is detected, otherwise na.
checkMitigation(isBullish, fvgTop, fvgBottom, currentHigh, currentLow)
Checks if an FVG has been fully mitigated by the current bar's price action.
Parameters:
isBullish (bool) : True if the FVG being checked is bullish, false if bearish.
fvgTop (float) : The top price level of the FVG.
fvgBottom (float) : The bottom price level of the FVG.
currentHigh (float) : The high price of the current bar.
currentLow (float) : The low price of the current bar.
Returns: True if the FVG is considered fully mitigated, false otherwise.
checkPartialMitigation(isBullish, currentBoxTop, currentBoxBottom, currentHigh, currentLow)
Checks for partial mitigation of an FVG by the current bar's price action.
It determines if the price has entered the FVG and returns the new fill level.
Parameters:
isBullish (bool) : True if the FVG being checked is bullish, false if bearish.
currentBoxTop (float) : The current top of the FVG box (this might have been adjusted by previous partial fills).
currentBoxBottom (float) : The current bottom of the FVG box (similarly, might be adjusted).
currentHigh (float) : The high price of the current bar.
currentLow (float) : The low price of the current bar.
Returns: The new price level to which the FVG has been filled (e.g., currentLow for a bullish FVG).
Returns na if no new partial fill occurred on this bar.
fvgInteractionCheck(fvg, highVal, lowVal)
Checks if the current bar's price interacts with the given FVG.
Interaction means the price touches or crosses into the FVG's
current (possibly partially filled) range.
Parameters:
fvg (fvgObject type from no1x/FvgTypes/1) : The FVG object to check.
Its isMitigated, isVisible, isBullish, currentTop, and currentBottom fields are used.
highVal (float) : The high price of the current bar.
lowVal (float) : The low price of the current bar.
Returns: True if price interacts with the FVG, false otherwise.

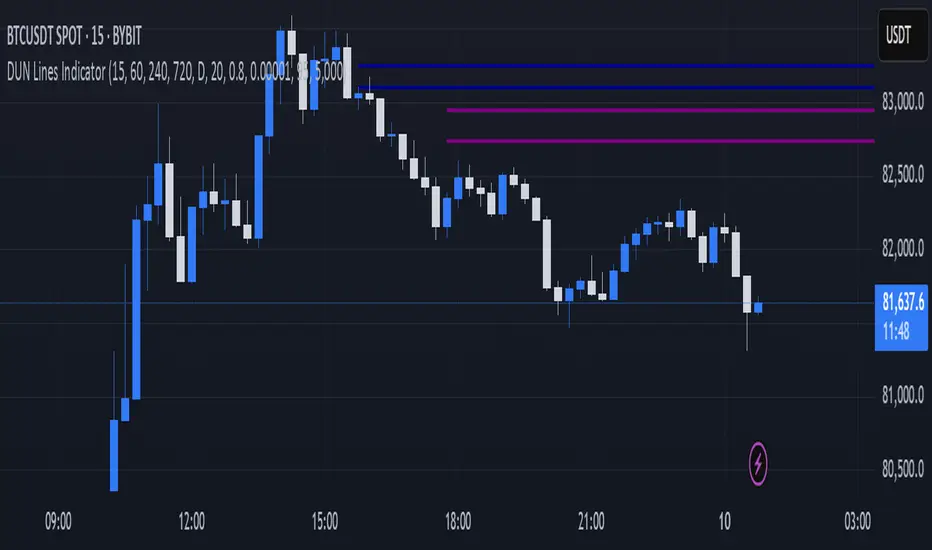
DUN Lines IndicatorThe DUN Lines indicator detects, filters and plots price imbalances (aka fair value gaps or fvgs/ifvgs). It is unique in the fact that it uses five timeframes and filters out overlapping, lower timeframe imbalances and fvgs below a user-definable size threshold.
Simply set your detection timeframes, colors and thresholds then set your chart to your preferred entry timeframe. When imbalances are mitigated, the FVG/IFVG is removed from the chart.
The indicator's default colors are my preferred ones for differentiating between timeframes, but these are easily changed. A single color with various levels of transparency to indicate timeframe strength is another approach that works nicely.
Price Action Volumetric Order Blocks [UAlgo]"Price Action Volumetric Order Blocks" indicator aims to identify significant price zones in the market based on a combination of price action and volume analysis. It utilizes the concept of "Order Blocks," which are areas on the chart where large orders are believed to have been placed, influencing price behavior. By analyzing price swings and volume activity, the indicator attempts to highlight potential support and resistance levels.
🔶 Key Features
Swing Length: This input allows you to adjust the timeframe used to identify price swings for order block detection. A longer swing length will focus on larger timeframes and potentially capture stronger order blocks.
Show Last X Order Blocks: This controls the number of order blocks displayed on the chart. You can choose to visualize a specific number of the most recent order blocks.
Violation Check: This setting determines how the indicator identifies potential order block violations. You can choose between "Wick" or "Close" violations. A "Wick" violation occurs when the price (wick) extends beyond the order block boundaries, while a "Close" violation signifies that the closing price breaches the order block.
Hide Overlap: This option allows you to manage the display of overlapping order blocks. If set to "True," only non-overlapping order blocks will be shown, potentially offering a clearer visualization.
Colors: You can customize the color scheme for bullish (upward) and bearish (downward) order blocks to enhance visual clarity on the chart.
🔶 Interpreting the Indicator
Order Blocks: The teal-colored boxes represent bullish order blocks, indicating areas of demand where buying pressure is likely to be strong. Red-colored boxes represent bearish order blocks, indicating areas of supply where selling pressure is likely to be dominant. These zones often signal potential reversal points or consolidation areas.
Strength Calculations: The indicator calculates the relative strength of bullish and bearish blocks based on volume. A higher bullish strength indicates stronger buying pressure, while higher bearish strength suggests more selling pressure. Traders can use this information to gauge the strength of a price level and predict future price movements.
Market Structure Lines: The indicator displays horizontal lines to depict the current market structure, labeled as "MSB" (Market Sell Balance) or "BOS" (Break of Structure). These lines can help visualize the prevailing trend direction.
Order Block Violations: When a price wick or close breaches an order block (depending on the chosen violation type), the corresponding order block visualization is removed from the chart. This can signify a potential weakening of the identified support or resistance zone.
🔶 Disclaimer
Use with Caution: This indicator is provided for educational and informational purposes only and should not be considered as financial advice. Users should exercise caution and perform their own analysis before making trading decisions based on the indicator's signals.
Not Financial Advice: The information provided by this indicator does not constitute financial advice, and the creator (UAlgo) shall not be held responsible for any trading losses incurred as a result of using this indicator.
Backtesting Recommended: Traders are encouraged to backtest the indicator thoroughly on historical data before using it in live trading to assess its performance and suitability for their trading strategies.
Risk Management: Trading involves inherent risks, and users should implement proper risk management strategies, including but not limited to stop-loss orders and position sizing, to mitigate potential losses.
No Guarantees: The accuracy and reliability of the indicator's signals cannot be guaranteed, as they are based on historical price data and past performance may not be indicative of future results.

Fair Value Gaps Setup 01 [TradingFinder] FVG Absorption + CHoCH🔵 Introduction
🟣 Market Structures
Market structures exhibit a fractal and nested nature, which leads us to classify them into internal (minor) and external (major) categories. Definitions of market structure vary, with different methodologies such as Smart Money and ICT offering distinct interpretations.
To identify market structure, the initial step involves examining key highs and lows. An uptrend is characterized by successive highs and lows that are higher than their predecessors. Conversely, a downtrend is marked by successive lows and highs that are lower than their previous counterparts.
🟣 Market Trends and Movements
Market trends consist of two primary types of movements :
Impulsive Movements : These movements align with the main trend and are characterized by high strength and momentum.
Corrective Movements : These movements counter the main trend and are marked by lower strength and momentum.
🟣 Break of Structure (BOS)
In a downtrend, a Break of Structure (BOS) occurs when the price falls below the previous low and establishes a new low (LL). In an uptrend, a BOS, also known as a Market Structure Break (MSB), happens when the price rises above the last high.
To confirm a trend, at least one BOS is necessary, which requires the price to close at least one candle beyond the previous high or low.
🟣 Change of Character (CHOCH)
Change of Character (CHOCH) is a crucial concept in market structure analysis, indicating a shift in trend. A trend concludes with a CHOCH, also referred to as a Market Structure Shift (MSS).
For example, in a downtrend, the price continues to drop with BOS, showcasing the trend's strength. However, when the price rises and exceeds the last high, a CHOCH occurs, signaling a potential transition from a downtrend to an uptrend.
It is essential to note that a CHOCH does not immediately indicate a buy trade. Instead, it is prudent to wait for a BOS in the upward direction to confirm the uptrend. Unlike BOS, a CHOCH confirmation does not require a candle to close; merely breaking the previous high or low with the candle's wick is sufficient.
🟣 Spike | Inefficiency | Imbalance
All these terms mean fast price movement in the shortest possible time.
🟣 Fair Value Gap (FVG)
To pinpoint the "Fair Value Gap" (FVG) on a chart, a detailed candle-by-candle analysis is necessary. This process involves focusing on candles with substantial bodies and evaluating them in relation to the candles immediately before and after them.
Here are the steps :
Identify the Central Candle : Look for a candle with a large body.
Examine Adjacent Candles : The candles before and after this central candle should have long shadows, and their bodies must not overlap with the body of the central candle.
Determine the FVG Range : The distance between the shadows of the first and third candles defines the FVG range.
This method helps in accurately identifying the Fair Value Gap, which is crucial for understanding market inefficiencies and potential price movements.
🟣 Setup
This setup is based on Market Structure and FVG. After a change of character and the formation of FVG in the last lag of the price movement, we are looking for trading positions in the price pullback.
Bullish Setup :
Bearish Setup :
🔵 How to Use
After forming the setup, you can enter the trade using a pending order or after receiving confirmation. To increase the probability of success, you can adjust the pivot period market structure settings or modify the market movement coefficient in the formation leg of the FVG.
Bullish Setup :
Bearish Setup :
🔵 Setting
Pivot Period of Market Structure Detector :
This parameter allows you to configure the zigzag period based on pivots. Adjusting this helps in accurately detecting order blocks.
Show major Bullish ChoCh Lines :
You can toggle the visibility of the Demand Main Zone and "ChoCh" Origin, and customize their color as needed.
Show major Bearish ChoCh Lines :
Similar to the Demand Main Zone, you can control the visibility and color of the Supply Main Zone and "ChoCh" Origin.
FVG Detector Multiplier Factor :
This feature lets you adjust the size of the moves forming the Fair Value Gaps (FVGs) using the Average True Range (ATR). The default value is 1, suitable for identifying most setups. Adjust this value based on the specific symbol and market for optimal results.
FVG Validity Period :
This parameter defines the validity period of an FVG in terms of the number of candles. By default, an FVG remains valid for up to 15 candles, but you can adjust this period as needed.
Mitigation Level FVG :
This setting establishes the basic level of an FVG. When the price reaches this level, the FVG is considered mitigated.
Level in Low-Risk Zone :
This feature aims to reduce risk by dividing the FVG into two equal areas: "Premium" (upper area) and "Discount" (lower area). For lower risk, ensure that "Demand FVG" is in the "Discount" area and "Supply FVG" in the "Premium" area. This feature is off by default.
Show or Hide :
Given the potential abundance of setups, displaying all on the chart can be overwhelming. By default, only the last setup is shown, but you can enable the option to view all setups.
Alert Settings :
On / Off : Toggle alerts on or off.
Message Frequency : Determine how often alerts are triggered.
Options include :
"All" (alerts every time the function is called)
"Once Per Bar" (alerts only on the first call within the bar)
"Once Per Bar Close" (alerts only at the last script execution of the real-time bar upon closing)
The default setting is "Once Per Bar".
Show Alert Time by Time Zone : Set the alert time based on your preferred time zone, such as "UTC-4" for New York time. The default is "UTC".
Display More Info : Optionally show additional details like the price range of the order blocks and the date, hour, and minute in the alert message. Set this to "Off" if you prefer not to receive this information.

Auto Anchored Volume ProfileAuto Anchored Volume profile indicator to identify potential support and resistance zones, along with weak and strong Point of Control (POC) levels.
Understanding the Concepts:
Volume Profile: This chart depicts trading activity at various price levels over a chosen timeframe. Higher volume areas represent price levels where most buying and selling happened.
Point of Control (POC): The price level with the highest volume traded within the timeframe. It represents the price where most agreement existed between buyers and sellers.
High Volume Nodes (HVN): Areas on the volume profile with significantly higher volume compared to surrounding areas. These can indicate potential support or resistance.
Delta (Sentimental): This volume profile type shows the difference between buying and selling volume at each price level. Positive delta indicates buying dominance, while negative delta suggests selling pressure.
Strategy Breakdown:
Identify Volume Shelves:
Look for areas with concentrated volume on the profile. These areas, called shelves, can act as support (high volume at lower prices) or resistance (high volume at higher prices).
Analyze POC Strength (POC Volume Percentage):
Calculate the Volume Percentage: (Volume at Price Level / Maximum HVN Volume over the Period) * 100
This ratio indicates the significance of the POC relative to the strongest volume area.
A high percentage suggests a strong POC, potentially indicating a more reliable support or resistance level.
A low percentage suggests a weak POC, with a higher chance of price breaking through that level.
Leverage Previous Session Data:
The strategy incorporates data from the previous session's POC and Highest Delta Node. These are displayed on the right side of the chart, extending the volume profile for reference.
Identify if the current price is trading above or below the previous session's POC. This can provide context for potential price direction.
The Highest Delta Node from the previous session indicates areas of strong buying or selling sentiment that might carry over to the current session.
Additional Anchor Point Types:
Pivot Points and Fixed Range Volume Profile can be added for further confirmation of support and resistance zones.
Pivot points are calculated automatically based on the price changes direction
Fixed Range Volume Profile focuses on a specific price range, allowing detailed analysis within that zone.
Timeframe Considerations(AUTO):
The resolution for calculating pivot points is determined automatically:
- For intraday resolutions up to and including 15 minutes, the daily (1D) timeframe is used.
- For intraday resolutions more than 15 minutes, the weekly (1W) timeframe is used.
- For daily resolutions, the monthly (1M) timeframe is used.
- For weekly and monthly resolutions, the 12-month (12M) timeframe is used.
Trading with the Strategy:
Look for price approaching a volume shelf identified on the profile.
Analyze the POC Volume Percentage to gauge the strength of the POC as potential support or resistance.
Consider the previous session's POC and Highest Delta Node for additional context.
Combine volume profile insights with other technical indicators and price action confirmation for entry and exit signals.
Remember, strong POCs with high volume shelves suggest more reliable support/resistance, while weak POCs indicate a higher chance of price movement beyond that level.
Important Notes:
Volume profile is a tool to identify potential trading zones, not a guaranteed predictor of future price movements.
Always practice proper risk management techniques, including stop-loss orders.
Backtest this strategy on historical data to understand its effectiveness before risking real capital.
By understanding volume distribution and POC strength, this strategy can help you make informed trading decisions based on where most buying and selling activity has occurred. Remember, a comprehensive trading approach that considers multiple factors is crucial for success.

Fair Value Gaps Mitigation Oscillator [LuxAlgo]The Fair Value Gaps Mitigation Oscillator is an oscillator based on the traditional Fair Value Gaps (FVGs) imbalances. The oscillator displays the current total un-mitigated values for the number of FVGs chosen by the user.
The indicator also displays each New FVG as a bar representing the current ratio of the New FVG in relation to the current un-mitigated total for its direction.
🔶 USAGE
When an FVG forms, it is often interpreted as strong market sentiment in the direction of the gap. For example, an upward FVG during an uptrend is typically seen as a confirmation of the strength and continuation of the trend, as it indicates that buyers are willing to purchase at higher prices without much resistance, suggesting strong demand and positive sentiment.
By analyzing the mitigation (or lack thereof), we can visualize the increase of directional strength in a trend. This is where the proposed oscillator is useful.
🔶 DETAILS
The oscillator's values are expressed as Percentages (%). Each FVG is allocated 100% of the total of its width with a max potential value of 100 and minimum potential value of 0.
Based on the "FVG Lookback" Input, the FVGs are scaled to fit within the range of +1 to -1. Using a higher "FVG Lookback" value will allow you to get indications of longer-term trends.
A higher value of the normalized bullish FVG areas suggest a stronger and cleaner uptrend, while lower values of the bearish the normalized bullish FVG areas suggest a stronger and cleaner downtrend.
+1 or -1 indicates that there is a Full Lookback of FVGs, and each one is fully un-mitigated, and the opposite direction of FVGs is entirely Mitigated.
When the price closes over/under or within an FVG it begins to get mitigated, when this happens the % of mitigation is subtracted from the total.
When a New FVG is formed, a Histogram bar is created representing the ratio of the current FVG's width to the total width off all un-mitigated FVGs.
The entire bar represents 100% of total un-mitigated FVG Width.
The filled area represents the current FVG's width relative to the whole.
A 50% hash mark is also displayed for reference.
🔶 SETTINGS
FVG Lookback - Determines the number of FVGs (Bullish and Bearish Pairs) to keep in memory for analysis.

Adaptive Squeeze Momentum (Zeiierman)█ Overview
Adaptive Squeeze Momentum (Zeiierman) is a hybrid oscillator that models the market’s transition between trend-efficient and inefficient (choppy or reversal-prone) regimes. It fuses a price efficiency framework, volatility-adaptive responsiveness, and a bounded directional trend score, then intelligently blends them through a dynamic transition band to emphasize either smooth, directional structure or spiky inefficiency.
Unlike traditional momentum tools, it does not simply measure speed or volatility. It measures how efficiently the price is moving. This multidimensional approach allows it to identify when markets are compressed and ready to expand, or stretched and ready to revert.
In essence, Adaptive Squeeze Momentum (Zeiierman) gives traders a deep structural perspective of efficiency, momentum, and compression energy, helping to expose hidden squeezes, early reversals, and trend continuations with remarkable accuracy.
⚪ Why This One Is Unique
Adaptive Squeeze Momentum (Zeiierman) stands out because it doesn’t rely on static momentum or volatility measures alone. It merges price efficiency, volatility adaptivity, and trend structure into one cohesive system capable of detecting:
Early squeeze build-ups and directional releases
Reversals emerging from inefficiency spikes
Shifts between clean trends and noisy, unstable ranges
Adaptive behavior across changing volatility conditions
In essence, it acts as a self-adjusting market intelligence tool, revealing when the price is efficient, exhausted, or preparing for significant expansion.
█ Main Features
⚪ Adaptive Squeeze Momentum Oscillator
The Adaptive Squeeze Momentum (Zeiierman) captures how price structure transitions between compression, expansion, and inefficiency. It merges a volatility-adaptive momentum engine with an efficiency-aware structure filter, creating a responsive oscillator that reflects not just how fast the market moves, but how efficiently it moves.
Adaptive Momentum: Reacts dynamically to changing volatility regimes
Efficiency Awareness: Distinguishes stable, directional flow from unstable or noisy price action
Volatility Squeeze Detection: Identifies buildup (compression) and breakout (release) conditions
Directional Context: Shows momentum alignment, exhaustion, or imbalance through color-coded histograms
This hybrid model provides a multidimensional view of trend quality, squeeze pressure, and inefficiency, ideal for precision-based trend following and structural reversal recognition.
⚪ Understanding the Squeeze
A squeeze occurs when volatility contracts, prices compress, and market energy builds, much like a coiled spring preparing to release. Once volatility expands, that stored energy transforms into directional movement, often marking the beginning of a significant breakout or new trend phase.
Traditional squeeze indicators focus only on volatility contraction. Adaptive Squeeze Momentum (Zeiierman) goes further by incorporating efficiency analysis to evaluate how organized or chaotic the buildup is. This reveals not only when a squeeze may fire but also whether the ensuing release is likely to be sustainable or structurally weak.
Visual Interpretation:
Lighter Dots: Represent low-volatility compression, energy building within an efficient or balanced structure.
Yellow Dots: Mark volatility release, the expansion phase where momentum accelerates.
⚪ Inefficiency Columns
Efficient Price Action
Efficient moves are clean, directional, and purposeful. Price advances with minimal back-and-forth noise, revealing strong conviction and structural alignment. In the indicator, these appear as smooth, non-blue histogram columns. Such periods indicate organized, high-probability momentum where breakouts, trends, and continuations are supported by efficient order flow.
Inefficient Price Action
Inefficient moves are noisy, erratic, and spiky, showing that price is fighting its own structure. Liquidity is thin, reactions are emotional, and momentum lacks balance. In the oscillator, inefficiency is displayed through blue columns, path-break spikes, or OB/OS inefficiency crosses (green/red). These elements act as early warnings of structural instability, suggesting the market may be overextended, losing organization, or entering a mean-reversion or reversal phase.
█ How to Use
⚪ Trend Following
When oscillator bars are above or below zero and growing in color intensity, momentum is expanding, confirming active, efficient trends. When colors fade, momentum is decelerating, signaling potential exhaustion or consolidation.
Interpretation:
Sustained smooth growth above zero indicates strong, efficient bullish momentum.
Sustained smooth growth below zero indicates efficient bearish continuation.
Color fading or a zero-line cross suggests trend fatigue or rotation.
Tip: Confirm trend continuation when yellow squeeze-release dots appear in the same direction. They often precede sustained breakouts following compression.
⚪ Inefficiency Reversals or Breakouts
Adaptive Squeeze Momentum (Zeiierman) excels at detecting instability within active trends, highlighting when moves lose internal efficiency and become unsustainable. When bars change color, outbreak columns appear, or Overbought/Oversold Inefficiency Crosses (green/red) appear, the structure is shifting toward potential reversal or exhaustion.
Blue Inefficiency Columns:
Above Zero: Indicates inefficient buying pressure where markets push higher impulsively or emotionally. Often signals an overstretched or unstable rally prone to short-term corrections or FOMO-driven peaks.
Below Zero: Reflects inefficient selling pressure where panic-driven or disorderly sell-offs often precede exhaustion and recovery phases.
Main Oscillator Inefficiency:
Spiky Column Above Zero
When the main oscillator suddenly surges upward and prints a tall, spiky column above the zero line without turning blue, it signals an inefficient and overextended push to the upside. This type of move breaks the oscillator’s usual smooth rhythm, showing that buyers are becoming overaggressive or emotional, often driven by FOMO or reactive momentum chasing.
Even though the column remains green, the abrupt path break reveals that the move is losing internal structure and may be unsustainable. Such inefficient upward bursts often indicate upside exhaustion or an overshoot, where the market temporarily loses control.
From here, two scenarios can unfold:
A sustained breakout if structure confirms (for example, a valid squeeze release or strong volume support).
A snapback or reversal if follow-through fails on the next bars and the oscillator begins to fade (growth → fall).
Spiky Column Below Zero
When the oscillator sharply dives and prints a tall, spiky column below the zero line without turning blue, it reflects an inefficient and emotional push to the downside. This behavior typically emerges during panic-driven selling, where traders aggressively dump positions, breaking the oscillator’s normal rhythm.
Even though the color remains red, this kind of path-break spike shows that the market has become disordered or overstretched. These inefficient downward thrusts often suggest bear exhaustion, capitulation, or a temporary overshoot below fair structure.
From this point, two potential outcomes can occur:
A sustained breakdown if the move is supported by strong volume or new structural lows.
A rebound or mean reversion occurs when momentum fails to extend, indicating that selling pressure has burned out.
Setting Tip: To focus purely on the oscillator’s structural peaks, set Inefficiency Detection and Inefficiency Duration to identical values, then adjust Inefficiency Price Peaks to control sensitivity. Use lower values for crisp detection and higher values for smoother blending.
Overbought and Oversold Inefficiency Signals
Green Overbought Cross: Signals that buyers are driving the market too aggressively, often from emotional extension or FOMO. This imbalance typically leads to short-term pauses, pullbacks, or corrections.
Red Oversold Cross: Signals panic-driven or emotionally imbalanced selling, marking structural exhaustion. Often precedes rebounds or base formations as volatility normalizes.
Interpretation: Both crosses identify where momentum is inefficient rather than simply overbought or oversold, helping detect exhaustion before conventional oscillators do.
⚪ Squeeze Builds and Releases (Volatility Expansion)
The squeeze system highlights volatility cycles when the market compresses, builds energy, and releases it through expansion.
Lighter Dots: Compression, where volatility contracts, structure tightens, and energy builds.
Yellow Dots: Release, where volatility expands, triggering directional movement.
Interpretation: Light dots signal potential breakout setups. When followed by a yellow dot and an aligned oscillator direction, they confirm momentum ignition —the moment the market transitions from equilibrium to expansion.
█ How It Works
⚪ Inefficiency Logic
The indicator evaluates how efficiently the price progresses relative to internal volatility. When market flow loses directional clarity, it transitions into an inefficiency state, represented by blue columns or sudden outbreaks within the oscillator. These moments reveal when the underlying structure becomes unstable or overly reactive, often preceding reversals or false momentum bursts.
Calculation: Applies an adaptive efficiency model that compares directional movement to internal dispersion and classifies it within a controlled stability band. A dual-threshold hysteresis with smooth interpolation ensures stable transitions between efficient (trend) and inefficient (spike) phases.
⚪ Directional Tendency Core
The directional tendency component models the underlying slope of market intent, expressing the balance between structured progression and reactive drift. It transforms directional bias into a bounded, volatility-normalized range that remains consistent across instruments and timeframes.
Calculation: Constructs a normalized directional field derived from trend displacement over an adaptive window, filtered through a nonlinear bounding transform and dynamic smoothing to control lag and oscillation.
⚪ Squeeze Engine
The squeeze system isolates compression and release cycles, the rhythmic build-up and discharge of volatility. Compression phases represent equilibrium and contraction, while release phases signify volatility expansion and directional acceleration.
Calculation: Integrates a volatility-adjusted energy model with directional gating. Compression forms during sustained contraction, while release occurs as volatility and momentum expand.
⚪ OB/OS Inefficiency Extremes
The OB/OS inefficiency system detects imbalanced extremes in order flow, when price pushes too far in one direction without structural support. These regions often precede exhaustion or rapid mean reversion.
Calculation: Generates an efficiency-weighted propagation field that identifies directional overextension. Threshold analysis and adaptive state classification determine overbought (green) and oversold (red) inefficiency zones.
⚪ Final Oscillator Composition
The final oscillator is an adaptive blend of inefficiency, directional tendency, and volatility state. It continuously morphs between spike-dominant and trend-dominant behavior based on the evolving efficiency environment. This produces a responsive structural map that visualizes the interplay between market stability, momentum, and compression energy.
Calculation: Combines the signed inefficiency signal and the bounded trend vector through a soft-weighted blending function governed by the efficiency band.
-----------------
Disclaimer
The content provided in my scripts, indicators, ideas, algorithms, and systems is for educational and informational purposes only. It does not constitute financial advice, investment recommendations, or a solicitation to buy or sell any financial instruments. I will not accept liability for any loss or damage, including without limitation any loss of profit, which may arise directly or indirectly from the use of or reliance on such information.
All investments involve risk, and the past performance of a security, industry, sector, market, financial product, trading strategy, backtest, or individual's trading does not guarantee future results or returns. Investors are fully responsible for any investment decisions they make. Such decisions should be based solely on an evaluation of their financial circumstances, investment objectives, risk tolerance, and liquidity needs.
有料スクリプト

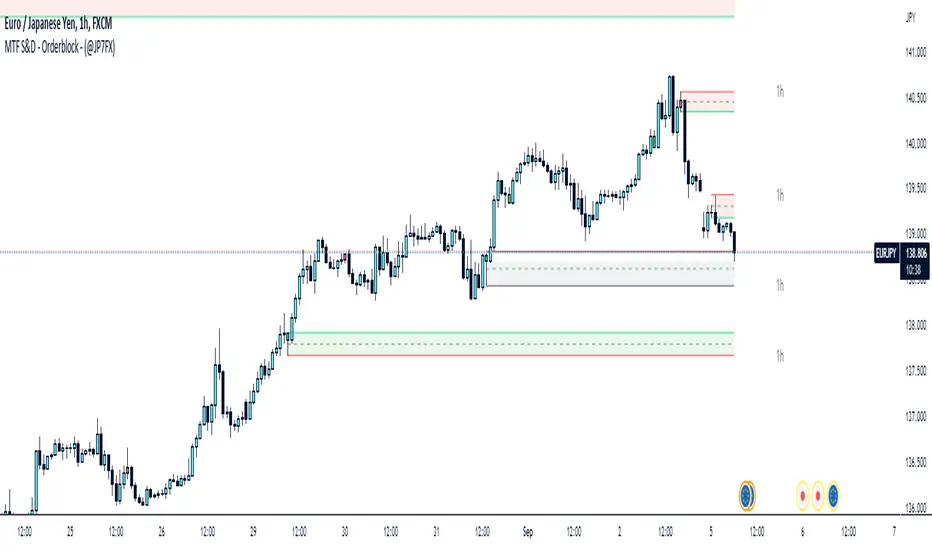
Supply & Demand / Orderblocks - Multi TimeFrame (@JP7FX)This should easily find the clear BUY to SELL / SELL to BUY candles with imbalance created.
There are options to change the Supply and Demand / OrderBlock CREATION based off the OPEN or WICK imbalance and also the option to DRAW the zones from the OPEN or the WICK.
Will also draw HTF zones with options to change the colour of zones when price has mitigated these areas, zones will be deleted once price has passed through.
Each Zone has the 50% line drawn and will delete when Price has reached - maybe useful for traders who look for 50% mitigation of areas.
When using HTF zones (max of 2) a Timeframe display will show for that zone.
There are many options to change colours and lines etc to suit the layout you prefer.
The zones that are created are not to trade from without additional analysis its simply to help draw strong zones.
Hope this provide some help and Trade Safe :)