SuperTrend AI Oscillator StrategySuperTrend AI Oscillator Strategy
Overview
This strategy is a trend-following approach that combines the SuperTrend indicator with oscillator-based filtering.
By identifying market trends while utilizing oscillator-based momentum analysis, it aims to improve entry precision.
Additionally, it incorporates a trailing stop to strengthen risk management while maximizing profits.
This strategy can be applied to various markets, including Forex, Crypto, and Stocks, as well as different timeframes. However, its effectiveness varies depending on market conditions, so thorough testing is required.
Features
1️⃣ Trend Identification Using SuperTrend
The SuperTrend indicator (a volatility-adjusted trend indicator based on ATR) is used to determine trend direction.
A long entry is considered when SuperTrend turns bullish.
A short entry is considered when SuperTrend turns bearish.
The goal is to capture clear trend reversals and avoid unnecessary trades in ranging markets.
2️⃣ Entry Filtering with an Oscillator
The Super Oscillator is used to filter entry signals.
If the oscillator exceeds 50, it strengthens long entries (indicating strong bullish momentum).
If the oscillator drops below 50, it strengthens short entries (indicating strong bearish momentum).
This filter helps reduce trades in uncertain market conditions and improves entry accuracy.
3️⃣ Risk Management with a Trailing Stop
Instead of a fixed stop loss, a SuperTrend-based trailing stop is implemented.
The stop level adjusts automatically based on market volatility.
This allows profits to run while managing downside risk effectively.
4️⃣ Adjustable Risk-Reward Ratio
The default risk-reward ratio is set at 1:2.
Example: A 1% stop loss corresponds to a 2% take profit target.
The ratio can be customized according to the trader’s risk tolerance.
5️⃣ Clear Trade Signals & Visual Support
Green "BUY" labels indicate long entry signals.
Red "SELL" labels indicate short entry signals.
The Super Oscillator is plotted in a separate subwindow to visually assess trend strength.
A real-time trailing stop is displayed to support exit strategies.
These visual aids make it easier to identify entry and exit points.
Trading Parameters & Considerations
Initial Account Balance: Default is $7,000 (adjustable).
Base Currency: USD
Order Size: 10,000 USD
Pyramiding: 1
Trading Fees: $0.94 per trade
Long Position Margin: 50%
Short Position Margin: 50%
Total Trades (M5 Timeframe): 1,032
Visual Aids for Clarity
This strategy includes clear visual trade signals to enhance decision-making:
Green "BUY" labels for long entries
Red "SELL" labels for short entries
Super Oscillator plotted in a subwindow with a 50 midline
Dynamic trailing stop displayed for real-time trend tracking
These visual aids allow traders to quickly identify trade setups and manage positions with greater confidence.
Summary
The SuperTrend AI Oscillator Strategy is developed based on indicators from Black Cat and LuxAlgo.
By integrating high-precision trend analysis with AI-based oscillator filtering, it provides a strong risk-managed trading approach.
Important Notes
This strategy does not guarantee profits—performance varies based on market conditions.
Past performance does not guarantee future results. Markets are constantly changing.
Always test extensively with backtesting and demo trading before using it in live markets.
Risk management, position sizing, and market conditions should always be considered when trading.
Conclusion
This strategy combines trend analysis with momentum filtering, enhancing risk management in trading.
By following market trends carefully, making precise entries, and using trailing stops, it seeks to reduce risk while maximizing potential profits.
Before using this strategy, be sure to test it thoroughly via backtesting and demo trading, and adjust the settings to match your trading style.
モメンタム・オシレーター

DRM StrategyOne of the ways I go when I develop strategies is by reducing the number of parameters and removing fixed parameters and levels.
In this strategy, I'm trying to create an RSI indicator with a dynamic length.
Length is computed based on the correlation between Price and its momentum.
You can set min and max values for the RSI, and if the correlation is close to 1, we'll be at a min RSI value. When it's -1, we'll be at the max level.
I got this idea from Sofien Kaabar's book.
The strategy is super simple, and there might be much room for improvement.
Performance on the deep backtesting is not excellent, so I think the strategy needs some filters for regimes, etc.
Thanks to @MUQWISHI for helping me code it.
Disclaimer
Please remember that past performance may not indicate future results.
Due to various factors, including changing market conditions, the strategy may no longer perform as well as in historical backtesting.
This post and the script don’t provide any financial advice.

Price change scalping short and long strategyPrice change scalping Short and Long strategy uses a rate of change momentum oscillator to calculate the percent change in price between a period of time. Rate of change calculation takes the current price and compares it to a price of "n" periods while the period of time can be defined by a user. The calculated rate of change value is then compared to the upper threshold and the lower threshold values to determine if a position should be opened. If the threshold is crossed and filtering conditions are met a strategy position will be triggered. Entry, take profit, and stop loss prices are calculated and displayed on the chart as well as positions directions. Once the entry price is crossed, a long or short position is created and once the take profit price is crossed, the stop loss price will begin to trail behind the price action using the close of the previous bar. Once the trailing stop price is crossed, the position is closed. If the entry price is not crossed and the price action crosses the stop level, the trade setup is cancelled. The strategy is enhanced by DCA algorithm which allows to average entry price with safety orders. The script also allows to use Martingale coefficient to increase averaging power
Advantages of this script:
Strategy has high net profit of 293% at backtests
Backtests show high accuracy around 71%
High frequency and low duration of trades
Can be used with short-term timeframes ranging from 5 to 60 minutes
Strategy is sustainable to market slumps due to DCA implementation
Can be used for short and long positions (can be adjusted to long only, short only or both)
Can be applied to any market and quote currency
Easy to configure user interface settings
Built in detailed statistic menu
How to use?
1. Apply the strategy to a trading pair your are interested in using 5 to 60 minutes timeframe chart
2. Configure the strategy: change layer values, order size multiple and take profit/stop loss values according to current market cycle stage
3. Set up a TradingView alert to trigger when strategy conditions are met
4. Strategy will send alerts when to enter and when to exit positions which can be applied to your portfolio using external trading platforms
5. Update settings once market conditions are changed using backtests on a monthly period

All in One Strategy no RSI Label - For higher dollar cryptoThis is the All in One Strategy without the RSI suggestion label that will work well for any of the crypto currencies trading above $500 so the overlay shows up better. I am using ETH as an example on this.
Based on some comments on my previously published script that has been replaced I have added Alert Conditions to this version that can be used in other bots. You can also copy and paste these alert conditions into the other All in One script I published for the lower priced cryptocurrencies.
To use the alert conditions I have in here, you will need to convert this strategy into a study to do so. Delete the entry and exit logic at the end (lines 299 through 351), delete line 18 and paste the following in place of line 18:
study(shorttitle='Ain1 No Label',title='All in One Strategy no RSI Label', overlay=true, scale=scale.left)
Here are the settings to mimic what you see here in the back test strategy I am publishing. Remember that previous results do not guarantee future results.
Chart Time = 30 Minutes (if you didn't read my original All in One post, read it. Shorter isn't better. You lose your money faster in a shorter amount of time and I learned that the hard way)
Start Time = 1 April 2021 00:00
End Time = 31 December 2021 00:00
Trade Type = Long/Short
Stop Loss % = 20.1
Take Profit % = 14.57
RSI Length = 20
Overbought = 44
Oversold = 45
EMA Fast Length = 5
EMA Slow Length = 15
Overbought Lookback Minimum Value = 62
Overbought Lookback Bars = 3
Oversold Minimum Value = 43
Oversold Lookback Bars = 5
Source = Close
Max Lookback Period = 5
Use EMA Only = True (check the box)
K = 9
D = 17
K Mode = SMA
High Source = ohlc4
Low Source = ohlc4
Properties - Starting Amount is $3500, everything else is the same.
Any questions, feel free to ask. I will answer as soon as I can.

inwCoin Elder's Force Index Risk% Strategy=========================
English
=========================
Just Elder's Force Index Strategy with smooth entry and exit
Buy = EFI (green line) above zero and EMA of EFI cross zero up
Sell = EFI under zero and EMA of EFI cross zero down
==========================
Thai
==========================
ตัวปรับปรุงจาก EFI เดิม โดยเปลี่ยนวิธีเข้าไม้ ให้มองเป็นการคุมความเสี่ยงแทน
อยากเสี่ยงกี่ % ก็เลือกเอา แต่ถ้าแนะนำ ก็ควรเสี่ยง 1%
แต่ถ้าเป็นกราฟวีค ผมว่า เสี่ยงมากหน่อยก็ได้เหมือนกัน เพราะนานๆ มันโผล่ที
option High/Low candle อะไรนั่น คือจะเป็นการหาจุด stoploss ย้อนหลังว่าจะดูย้อนกลับไปกี่แท่ง
และจะเอาจุด stop นี้ไปคำนวณ position size อีกที
ดังนั้น ถ้า stop ต่ำ เราก็จะเข้าได้เยอะขึ้นนั่นเอง

Cyber Momentum StrategyStrategy base on the PRISM Oscillators Set as it foundation, with stop-loss algorithm integrated.
~ * ~ * ~ * ~ * ~ * ~ * ~ * ~ * ~ * ~ * ~ * ~ * ~ * ~ * ~ * ~ * ~ * ~ * ~ * ~ * ~
Note:
In no way is this intended as a financial/investment/trading advice. You are responsible for your own investment decisions and trades.
Please exercise your own judgement for your own trades base on your own risk-aversion level and goals as an investor or a trader. The use of OTHER indicators and analysis in conjunction (tailored to your own style of investing/trading) will help improve confidence of your analysis, for you to determine your own trade decisions.
~ * ~ * ~ * ~ * ~ * ~ * ~ * ~ * ~ * ~ * ~ * ~ * ~ * ~ * ~ * ~ * ~ * ~ * ~ * ~ * ~
Please check out my other indicators sets and series, e.g.
LIVIDITIUM (dynamic levels),
AEONDRIFT (multi-levels standard deviation bands),
FUSIONGAPS (MA based oscillators),
MAJESTIC (Momentum/Acceleration/Jerk Oscillators),
PRISM (pSAR based oscillator, with RSI/StochRSI as well as Momentum/Acceleration/Jerk indicators),
PDF (parabolic SAR /w HighLow Trends Indicator/Bar-color-marking + Dynamic Fib Retrace and Extension Level)
and more to come.
Constructive feedback and suggestions are welcome.
To continue to keep this strategy free to use, especially if it has benefited your trades, please consider tipping a little of any gains you've made to my HRT fund. =D
cybernetwork @ EOS
37DzRVwodp5UZBYjCKvVoZ5bDdDqhr7798 @ BTC
MPr8Zhmpsx2uh3F5R4WD98MRJJpwuLBhA3 @ LTC
1Je6c1vvSCW7V2vA6RYDt6CEvqGYgT44F4 @ BCH
AS259bXGthuj4VZ1QPzD39W3ut4fQV5giC @ NEO
rDonew8fRDkZFv7dZYe5w3L1vJSE51zFAx @ Ripple XRP
0xc0161d27201914FC0bAe5e350a193c8658fc4742 @ ETH
GAX6UDAJ52OGZW4FVVG3WLGIOJLGG2C7CTO5ZDUK2P6M6QMYBJMSJTDL @ Stellar XLM
xrb_16s8cj8eoangfa96shsnkir3wctdzy76ajui4zexek6xmqssweu85rdjxrt4 @ Nano
~ JuniAiko
(=^~^=)v~

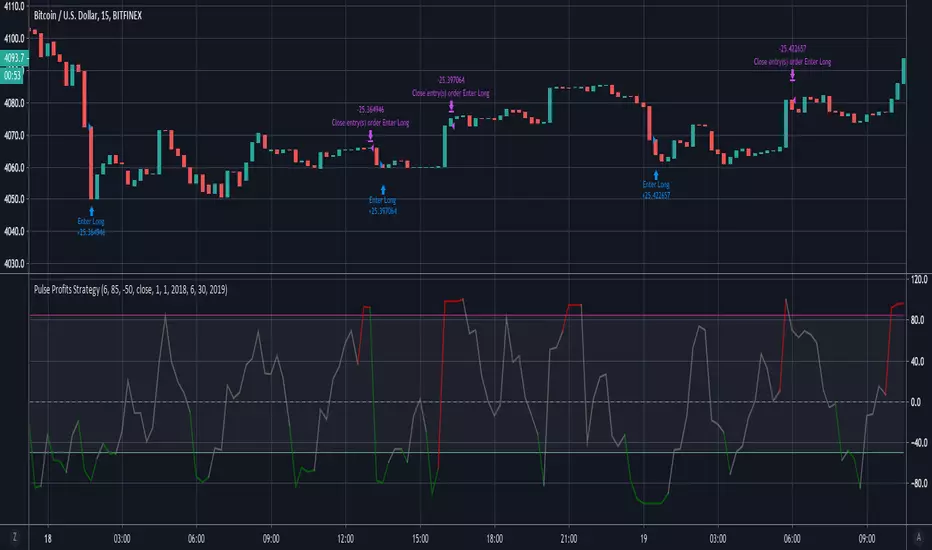
Pulse Profits Strategy v2.0This is the strategy version that is included with the Pulse Profits+ study. This strategy is based on the Chande Momentum Oscillator and Elder's Force Index(EFI).
The strategy includes options to add a stop loss and adjust all input options based on specific usage.

Pulse Profits+ StrategyStrategy Version of the Pulse Profits+ Indicator based on Elder's Force Index and Chande Momentum Oscillator.
SB_Elder Impulse SystemThe strategy is based on LazyBear's Elder Impulse System
Strategy(in layman terms):
Long: When the green bar in the Elder Impulse System's indicator shows up
Short: When the red bar in the Elder Impulse System's indicator shows up
Close trade/Profit booking: When the blue bar in the Elder Impulse System's indicator shows up
Original Idea:
Message in the script if you think of any modifications/ enhancements.
Donations/Tips... :) -
BTC: 1BjswGcRR6c23pka7qh5t5k56j46cuyyy2
ETH: 0x64fed71c9d6c931639c7ba4671aeb6b05e6b3781
LTC: LKT2ykQ8QSzzfTDB6Tnsf12xwYPjgq95h4
