KC-BB Squeeze Trend Trader█ OVERVIEW
The KC-BB Squeeze Trend Trader identifies volatility compression and expansion by detecting when Bollinger Bands contract inside Keltner Channels and then release with confirmed momentum. It highlights potential trend-starting breakouts by combining squeeze detection, directional momentum, trend bias, and optional volume filters.
During periods of low volatility, price consolidates and energy builds. When volatility expands again, strong directional moves often follow. This tool helps traders spot those opportunities early with clear visual cues and optional performance tracking.
█ KEY FEATURES
Squeeze detection using Bollinger Bands inside Keltner Channels
Automatic identification of volatility expansion after the squeeze ends
Optional filters for momentum, trend direction, volume, and signal cooldown
Dynamic color fills for squeeze, bullish expansion, bearish expansion, and neutral states
Dashboard showing squeeze duration, tightness, momentum, trend, and volume context
Optional win-rate analytics using ATR-based target and stop evaluation
Multi-timeframe confirmation for higher-quality breakouts
█ HOW IT WORKS
A squeeze occurs when both Bollinger Bands sit inside the Keltner Channels.
A breakout begins when the Bollinger Bands expand outside the KCs.
Long signals appear when squeeze release aligns with bullish momentum and trend strength.
Short signals appear when bearish momentum and trend conditions agree.
Volume and cooldown filters help reduce noise and avoid low-quality entries.
█ HOW TO USE
Wait for a squeeze period (yellow fill).
Monitor duration and tightness: longer/tighter squeezes often lead to stronger moves.
When a long or short signal appears, use the plotted ATR-based target and stop as reference levels.
Watch for contraction or exit hints when momentum fades or volatility narrows again.
Higher timeframes generally provide cleaner and more reliable signals.
█ TIMEFRAME GUIDANCE
Crypto: 4H or 1D; consider increasing KC multiplier for high volatility.
Forex: 1H–4H; longer squeeze duration can improve selectivity.
Stocks: 1D–1W; consider slightly higher BB multiplier on slow-moving markets.
█ SETTINGS SUMMARY
Adjustable Bollinger Band and Keltner Channel lengths and multipliers
Three momentum modes: Linear Regression, Price–SMA, or ROC
Trend and volume filters (optional)
Configurable minimum squeeze duration and signal cooldown
ATR-based target and stop multipliers
Optional historically tight squeeze filter (percentile-based)
█ ALERTS
Squeeze Detected
Squeeze Released
Long Entry
Short Entry
Exit Hint
Historically Tight Squeeze
█ NOTES
ATR-based win-rate calculations provide simplified performance estimates.
Past behavior does not guarantee future movement.
Use position sizing and risk management appropriate for the instrument and timeframe.
█ CREDITS
Inspired by the Bollinger Band and Keltner Channel squeeze concept popularized by John Carter’s TTM Squeeze, with added enhancements for squeeze strength, filtering, and real-time performance metrics.
移動平均線

The Bear & Bull TieWhat it does:
Bear & Bull Tie is a moving average crossover indicator that identifies trend reversals and generates entry/exit signals based on the relationship between price and three simple moving averages (SMA 21, SMA 55, SMA 89). The indicator combines these three MAs into an Average Moving Average (AMA) to confirm directional bias, then uses ATR (Average True Range) volatility measurement for dynamic position sizing and stop-loss placement.
How it works:
The indicator operates on a simple but effective principle: it enters a bullish trend when price closes above all three moving averages simultaneously, and enters a bearish trend when price closes below all three MAs simultaneously. This "three MA alignment" approach filters out noise and confirms genuine trend changes. The indicator then plots:
Entry levels at the highest MA during uptrends or lowest MA during downtrends
Stop-loss zones calculated using 2x ATR distance from entry prices
Trend confirmation fill between price and the Average Moving Average, color-coded blue for bullish and red for bearish
The ATR-based stop-loss sizing adapts to market volatility, making it suitable for different market conditions and timeframes.
How to use it:
Monitor the filled zones to visually confirm your trend bias
Watch for alerts when new long or short setups form; entry prices and ATR-based stops are displayed on the chart
Trade the zones between your entry level and stop-loss zone, adjusting position size based on your risk tolerance
Exit when colors reverse to indicate trend termination
The indicator works best on higher timeframes (1H and above) where trend clarity is stronger and false signals are reduced.
Alerts: FOR AUTOMATION / NOTIFICATION's (create an alert for B/B tie (2, 4) that uses Any Alert / Function Call )
Long Positions:
entries ---> "Bull Tie on NVDA | Entry : 100.5 | ATR Stop : 99.5"
exits ------> "Bull Tie on NVDA | Exit : 110.1"
Short Positions:
entries ---> "Bear Tie on NVDA | Entry : 120.05 | ATR Stop : 85.05"
exits -----> "Bear Tie on NVDA | Exit : 100"
Credits:
This script incorporates concepts and code portions from @LOKEN94 with his explicit permission. Special thanks for the foundational logic that inspired this development.
Disclaimer:
This indicator is for educational and analytical purposes. It is not financial advice. Past performance does not guarantee future results. Always manage risk properly and use stops. Test thoroughly on historical data before live trading.

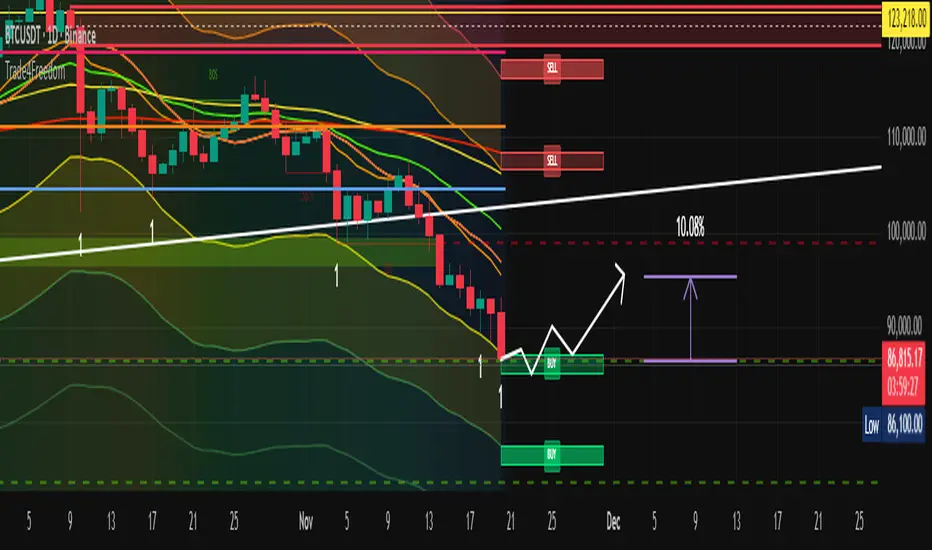
Trade4Freedom## 🔷 Trade4Freedom – Market Logic Framework
**Not a group of indicators. One continuous system of reading market behaviour.**
The script is designed to follow the same decision flow I use in trading.
Every tool here supports the others — there are no standalone modules.
The market is analysed layer by layer, but always as one sequence:
---
### 🔄 **How the logic works (continuous process)**
1. **Structure first** – BOS/ChoCH levels show where the market changed behaviour.
The projected dotted line is not a signal — it is a place where I wait and observe.
I do not enter until price interacts with structure.
2. **Liquidity next** – if the structure level aligns with a liquidity bag (retest),
the zone becomes important. Active liquidity lines are potential targets or
reasons to avoid trading against the area.
3. **Context filter** – I use CCI only when structure + liquidity are already active.
Example of long bias:
−200 level is broken → candle closes above the MA → CCI rises from the channel.
From this point I begin to trail stops and start building position if structure supports it.
4. **Confirmation & positioning**
Stochastic heatmap is not for entries – it confirms pressure.
Divergences on CCI or price are additional evidence when forming or adjusting a position.
5. **Execution zones** – only after structure → liquidity → context,
I use deviation levels (1–5) to define where to place orders.
On higher timeframes they work for accumulation models,
on intraday levels they work for tactical entry zones.
Dev1/Dev2 boxes exist only to make limit-order planning faster.
---
### 📌 **Purpose of the script**
This tool does not predict price or generate signals.
It creates the same structured environment on any chart:
**Structure → Liquidity → Context → Deviation → Decision**
This helps avoid random trading and replaces guessing with logic and observation.


NeuraEdge Pro v1- Auto-OptimizedNeuraEdge Pro is an advanced, self-optimizing trading system that combines Smart Money Concepts (SMC), ICT principles, and adaptive neural networks to identify high-probability trade setups. The indicator automatically learns from its signal history and optimizes parameters in real-time to maintain your target win rate.
Key Features:
✅ Auto-optimization based on historical performance
✅ Neural adaptive system that learns market conditions
✅ ICT session filtering (London, New York, Asian)
✅ Smart Money Concepts integration
✅ Multi-timeframe support (Scalping to Swing trading)
✅ Built-in risk management system
📊 How It Works
NeuraEdge Pro identifies institutional order blocks, fair value gaps, and liquidity zones using advanced price action analysis. The system then filters these setups through multiple confluence factors including:
Market structure alignment
Volume confirmation
Neural network prediction
Session timing (ICT concepts)
Momentum indicators
RSI divergences
The higher you set the confluence number to (max 5) the more accurate but less signal quantity preferred on higher time frame from 1 HR and above.
The unique auto-optimization engine tracks signal performance and automatically adjusts internal parameters to improve accuracy over time.
⚙️ Recommended Settings by Trading Style
🔥 Scalping (1m - 5m charts)
Trading Mode:
✅ Scalp Mode
❌ Intraday Mode
❌ Swing Mode
✅ ICT Concepts
✅ Neural Adaptive
Risk Management:
Risk % per Trade: 0.5-1.0%
Risk:Reward Ratio: 2:1
ATR-Based Stop Loss: ON
ATR Multiplier: 1.3
Min SL Points: 15-20
Advanced Settings:
Analysis Lookback: 40
Order Block Strength: 4-5
Base FVG Size: 0.8-1.0
Base Volume Threshold: 1.8
Base Confluence Score: 4
📈 Intraday (15m - 1h charts)
Trading Mode:
❌ Scalp Mode
✅ Intraday Mode
❌ Swing Mode
✅ ICT Concepts
✅ Neural Adaptive
Risk Management:
Risk % per Trade: 1.0-1.5%
Risk:Reward Ratio: 2.5:1
ATR-Based Stop Loss: ON
ATR Multiplier: 1.5
Min SL Points: 25-30
Advanced Settings:
Analysis Lookback: 50
Order Block Strength: 4
Base FVG Size: 0.9
Base Volume Threshold: 1.6
Base Confluence Score: 4
📊 Swing Trading (4h - Daily charts)
Trading Mode:
❌ Scalp Mode
❌ Intraday Mode
✅ Swing Mode
✅ ICT Concepts
✅ Neural Adaptive
Risk Management:
Risk % per Trade: 1.5-2.0%
Risk:Reward Ratio: 3:1
ATR-Based Stop Loss: ON
ATR Multiplier: 1.8
Min SL Points: 40-50
Advanced Settings:
Analysis Lookback: 75
Order Block Strength: 3-4
Base FVG Size: 1.0-1.2
Base Volume Threshold: 1.5
Base Confluence Score: 3-4
🤖 Auto-Optimization Settings
Recommended for all timeframes:
Enable Auto-Optimization: ON
Optimization Lookback: 100 trades
Target Win Rate: 60%
💡 The system needs at least 10-15 signals to begin optimization. Initial signals use base settings, then the system adapts automatically.
🔮 Predictive Analysis
Keep these balanced for optimal results:
Enable Predictive Mode: ON
Price Action Weight: 0.4
Volume Weight: 0.3
Momentum Weight: 0.3
These weights determine how much each factor influences setup scoring.
📱 Signal Interpretation
BUY Signals (Green Labels)
Price has reached a bullish order block or FVG
Multiple confluence factors aligned
Neural network confirms bullish bias
Entry price shown on label
Green dashed line = Take Profit target
Red dashed line = Stop Loss
SELL Signals (Red Labels)
Price has reached a bearish order block or FVG
Multiple confluence factors aligned
Neural network confirms bearish bias
Entry price shown on label
Green dashed line = Take Profit target
Red dashed line = Stop Loss
📊 Dashboard Explained
Top Section:
Mode - Active trading mode and timeframe
Trend - Current market structure (Bullish/Bearish/Range)
Vol - Volume ratio (higher = stronger moves)
ATR - Current volatility measurement
Auto-Optimize Section:
Win Rate - Historical performance (updates after signals)
FVG/Vol/Conf - Current optimized parameters with arrows:
↑ = System increased selectivity (fewer signals)
↓ = System decreased selectivity (more signals)
= = No change from base settings
Ready OBs - Number of high-probability setups currently available
⚠️ Important Trading Rules
Wait for signal labels - Don't trade order blocks/FVGs without confirmation
Respect the stop loss - Always displayed as red dashed line
Use proper position sizing - Based on your Risk % setting
Trade during recommended sessions - When ICT Concepts enabled
Let auto-optimization work - Give it 15-20 signals before judging
One signal at a time - System prevents new signals for 5 bars after entry
🎯 Best Practices
✅ DO:
Use on liquid, trending markets (Forex majors, indices, crypto majors)
Enable only ONE trading mode matching your timeframe
Keep ICT Concepts enabled for session filtering
Trust the auto-optimization after 15+ signals
Set alerts for BUY/SELL signals
❌ DON'T:
Enable multiple trading modes simultaneously
Override stop losses manually
Trade during low liquidity hours without ICT filtering
Expect perfection - manage risk appropriately
Judge performance before 20+ signals
🔔 Alert Setup
The indicator includes 4 alert types:
Buy Signal - Long entry opportunity
Sell Signal - Short entry opportunity
Sell-Side Sweep - Liquidity grabbed above
Buy-Side Sweep - Liquidity grabbed below
Set up alerts via TradingView's alert menu for real-time notifications.
📈 Performance Tracking
The dashboard shows real-time performance metrics:
Win Rate % - Percentage of profitable signals
Parameter adjustments - How the system is adapting
Neural Score - AI confidence (0-1 scale)
ICT Session Status - Whether optimal trading hours are active
💡 Pro Tips
Start conservative - Use recommended settings for your timeframe
Give it time - Auto-optimization needs 20-30 signals for best results
Higher timeframes = higher quality - Fewer but better signals
Volume matters - Strongest signals occur on volume spikes
Structure alignment - Best trades align with overall trend
⚙️ Technical Requirements
Minimum Timeframe: 1 minute
Maximum Timeframe: Monthly
Best Timeframes: 5m, 15m, 1h, 4h
Asset Classes: Forex, Crypto, Indices, Stocks
Account Type: Any (works with all TradingView plans)
📞 Support & Updates
This indicator is actively maintained and updated based on user feedback. Future updates will include additional features and optimizations.
Disclaimer: Trading involves substantial risk. This indicator is a tool to assist analysis, not a guarantee of profits. Always use proper risk management and never risk more than you can afford to lose. Past performance does not guarantee future results.

Hyper MACDThe Hyper MACD is a customizable momentum indicator exclusively designed for Scalping that blends traditional MACD logic with dynamic signal coloring, overbought/oversold detection, and WaveTrend overlays. It supports multiple moving average types and highlights key momentum shifts with visual markers and alerts.
The settings/alerts are self explanatory and are optimized for quick scalping, works for any timeframe.
Suggested rules are.
The MACD line and Signal line must be above the zero line to scalp
The price begins do decay when the Signal turns from white to orange, however if both the lines are above zero line, then its still game to scalp but cautiously.
The colors are telling on both the lines, blue indicates a bullish surge on both and green on macd and white on signal suggests the bullish trend continuation
It also prints take profit arrows along the way, and also possible trend reversals.

Previous Period Close & Live VWAP @MaxMaserati 3.0 Previous Period Close & Live VWAP @MaxMaserati 3.0 ═════════════════════════════════════════════════════════════A professional-grade Volume Weighted Average Price (VWAP) indicator designed for dual-timeframe analysis, providing essential institutional-level insights for day, swing, and institutional traders. ═════════════════════════════════════════════════════════════VWAP ═════════════════════════════════════════════════════════════VWAP is the Volume Weighted Average Price—the average price adjusted for the volume traded at each price level. It gives higher importance to prices where more transactions occurred.
CALCULATION:
VWAP = Σ(Price × Volume) / Σ(Volume)
WHY IT'S CRITICAL:
It represents the true average price paid by all market participants.
Institutions use it as a benchmark for trade execution quality.
It functions as a dynamic support and resistance level driven by volume.
More reliable than simple moving averages for intraday trading.
═════════════════════════════════════════════════════════════
MMM PRO VWAP @MaxMaserati 3.0 Features
═════════════════════════════════════════════════════════════ This indicator displays the closed VWAP level from the previous period alongside a dynamic, live VWAP line for the current period. This setup allows for immediate comparison of current price action relative to the prior period's volume-weighted average.
PREVIOUS PERIOD PRESSURE-BASED COLORING
The color of the previous period's close instantly reveals the dominant pressure:
GREEN: If the VWAP closed HIGHER than it opened, indicating dominant buying volume (Bulls won).
RED: If the VWAP closed LOWER than it opened, indicating dominant selling volume (Bears won).
This provides instant, actionable insight into the market's recent sentiment.
═════════════════════════════════════════════════════════════
Trading Applications & Strategy Ideas
═════════════════════════════════════════════════════════════
INTRADAY TRADING (VWAP 1 - Daily)
Bullish Bias: Price trading above the Daily VWAP (look for long setups).
Bearish Bias: Price trading below the Daily VWAP (look for short setups).
The Previous Close VWAP acts as a key support/resistance level.
The previous close color provides immediate daily sentiment.
SWING TRADING (VWAP 2 - Weekly/Monthly)
Use the higher timeframe VWAP (Weekly/Monthly) to establish the major trend direction.
Combine both VWAPs for multi-timeframe confluence and stronger conviction trades.
INSTITUTIONAL INSIGHTS
VWAP is considered the fair value based on volume.
Previous period close levels are crucial institutional zones.
Price often exhibits mean reversion, tending to move back towards the VWAP.
CORE STRATEGY IDEAS:
Buy (Long) when price tests the Daily VWAP from above (support).
Sell (Short) when price tests the Daily VWAP from below (resistance).
Use the previous close color for quick sentiment analysis. ═════════════════════════════════════════════════════════════
Pro Tips for Enhanced Analysis
═════════════════════════════════════════════════════════════
Confluence: The strongest setups occur when price is above both Daily and Monthly VWAP (bullish) or below both (bearish).
Reversion: Extreme deviations from VWAP suggest an imminent return to the mean. Previous close levels act as price magnets.
Trend Confirmation: Consistent price movement above VWAP confirms a strong uptrend; consistent movement below confirms a strong downtrend.
Institutional Focus: The end-of-day VWAP close highlights whether bulls or bears controlled the period. This pressure can often carry over.
Risk Management: Do not trade against the established VWAP bias without strong, independent confirmation. Use previous close levels as stop-loss references. ═════════════════════════════════════════════════════════════
Important Notes
═════════════════════════════════════════════════════════════
Timeframe Consistency: The VWAP line is timeframe-independent. The Daily VWAP will appear the same on a 1-minute chart as it does on a 4-hour chart.
Previous Close Persistence: The previous period close level remains on the chart until the next period's reset, serving as a critical historical reference point.
Volume Dependency: VWAP's reliability is highest during liquid market hours. Use caution during low-volume periods.
Not a Complete Strategy: This is an indicator tool. Always use it with robust risk management and combine it with your existing analysis methods. ═══════════════════════════════════════════════════════════

VWAP-EMA Ribbon by BucksTRDR📊 VWAP-EMA Ribbon by BucksTRDR
A comprehensive trend and momentum indicator combining 5 Exponential Moving Averages with dual VWAP levels (Session & Weekly) for multi-timeframe analysis.
🎯 KEY FEATURES
Five Exponential Moving Averages: • EMA 5 (Aqua) - Fast-moving, immediate price action • EMA 9 (Lime) - Short-term trend • EMA 21 (Yellow) - Medium-term trend • EMA 50 (Orange) - Key support/resistance • EMA 200 (Red) - Long-term trend baseline
Dual VWAP Analysis: • Session VWAP (Blue) - Resets daily, tracks institutional intraday levels • Weekly VWAP (Fuchsia) - Resets weekly, identifies longer-term value areas
Visual Design: • Bold VWAP lines (4px width) for clear reference levels • Color-coded EMAs (2px width) for easy identification • Clean, professional chart layout
📈 HOW TO USE
Trend Identification: ✓ Price above all EMAs + above VWAP = Strong uptrend ✓ Price below all EMAs + below VWAP = Strong downtrend ✓ EMAs fanning out = Momentum increasing ✓ EMAs converging = Potential trend reversal
Support & Resistance: ✓ Watch for bounces off individual EMAs ✓ VWAP acts as magnetic institutional level ✓ 200 EMA frequently serves as major support/resistance
Entry Signals: ✓ Pullbacks to 21 EMA in trending markets ✓ Price reclaiming VWAP after being below ✓ Faster EMA crossing above slower EMA ✓ Confluence of multiple EMAs at same level
Exit Signals: ✓ Price breaking below key EMAs ✓ Loss of VWAP support/resistance ✓ Death cross (50 EMA crossing below 200 EMA)
⚙️ CUSTOMIZATION
Fully Adjustable Settings: • All EMA lengths can be changed • All colors are customizable (EMAs + VWAPs) • Line widths adjustable • Individual on/off toggles for each indicator • Organized input groups for easy navigation
💡 BEST PRACTICES
Recommended Timeframes: • 5-minute charts for day trading • 15-minute for scalping and day trading • 1-hour for swing trading • Daily for position trading
Market Conditions: • Excellent for trending markets • Use caution in choppy/sideways conditions • Works on stocks, forex, crypto, indices, futures
Complementary Tools: • Combine with volume analysis • Add RSI for overbought/oversold confirmation • Use with candlestick patterns • Check multiple timeframes for confluence
🔍 WHAT MAKES THIS DIFFERENT
Unlike standard single EMA or VWAP indicators, this ribbon approach provides:
Multi-layered analysis - See short, medium, and long-term trends simultaneously
Volume-weighted context - VWAP shows institutional positioning
Clean visualization - All key moving averages in one organized display
Maximum flexibility - Adapt to any trading style or timeframe
📊 TRADING EXAMPLES
Bullish Setup: Price crosses above 21 EMA → bounces off 50 EMA → all EMAs slope upward → VWAP acting as support = Strong buy signal
Bearish Setup: Price crosses below 21 EMA → rejects at 50 EMA → all EMAs slope downward → VWAP acting as resistance = Strong sell signal
Reversal Signal: Price below all EMAs → reclaims 21 EMA → then 50 EMA → crosses above VWAP = Potential trend reversal
⚠️ DISCLAIMER
This indicator is provided "as is" for educational purposes only. BucksTRDR is not responsible for trading decisions made using this tool. Always conduct your own research and consult a financial professional before making investment decisions. Past performance does not guarantee future results.

Crypto Schlingel - PVSRA POC EMA Suite v5.903The Chart Indicator Suite combines a wide range of powerful tools that help traders accurately analyze market structures, volatility, and key price zones. With indicators such as POC, pivot points, EMAs, VWAP, Bollinger Bands, and important market levels such as yesterday/weekly high & low, daily open, psy high/low, and ADR, the suite offers a comprehensive overview of trends and market behavior. Supplemented by pvsra candles, long candle detection, and the display of relevant stock market opening hours, it reliably supports traders in making informed trading decisions.
Indicators are configurable
All of the indicators mentioned are fully configurable and can be flexibly adapted to individual trading strategies. Users can freely adjust parameters, display types, and sensitivities to highlight exactly the market information that is relevant to their personal trading style.
The individual fields in the configuration are self-explanatory or are explained in a toolbar, so that the possible settings become clear.
POC
The Point of Control (POC) is a central concept in market profile and volume profile analysis and plays an important role in technical chart analysis. Here is a detailed description of its usefulness and significance:
Definition
The point of control (POC) is the price level at which the most trading volume has taken place within a certain period of time.
It therefore shows the price at which buyers and sellers were most active – the center of market interest.
📊 Use and significance in chart analysis
1. Central support and resistance zone
Since the largest volume was traded at the POC, this price is considered a “fair zone” or equilibrium price.
The market often reacts strongly to the POC:
Above the POC → potential resistance if the price is coming from below.
Below the POC → potential support if the price is falling from above.
Example: If the price returns to the POC, this can be an entry opportunity for traders betting on a market reaction.
2. Interpretation of market acceptance
A price range with high volume (including POC) shows where the market has accepted a fair value.
Low volume, on the other hand, indicates rejection or disinterest.
→ The POC therefore helps to distinguish between accepted price zones and transition areas.
PIVOT POINTS
Pivot points are predefined price levels calculated from the previous day's price data (or a previous time unit).
They help traders identify potential support and resistance zones for the current trading day (or period).
Benefits of pivot points in chart analysis
1. Determining support and resistance areas
The calculated pivot levels (P, S1, S2, R1, R2, etc.) show where the market is likely to react:
Supports (S1, S2, S3) → possible downward turning points.
Resistance (R1, R2, R3) → possible upward turning points.
These zones are often observed by many traders at the same time, making them self-fulfilling marks.
2. Trend determination and market sentiment
If the market opens above the pivot (P) and remains there → signals buying pressure.
If the market trades below the pivot (P) → signals selling pressure.
A break above R1 or below S1 may indicate a strong trend day.
EMA Exponential Moving Average
The EMA is the exponentially weighted moving average of a price.
It shows the average price of a security over a certain period of time, weighted according to recency – that is:
👉 more recent price data has more influence than older data.
This distinguishes it from the simple moving average (SMA), in which all values are weighted equally.
Benefits of the EMA in chart analysis -> Identifying trends
The EMA reacts more quickly to price changes than the SMA and is therefore ideal for:
Identifying trend reversals at an early stage
Confirming trend directions
👉 Rising EMA → Upward trend
👉 Falling EMA → Downward trend
Traders often use combinations such as:
EMA 50 / EMA 200 → Long-term trends
SIGNIFICANCE OF HIGHS AND LOWS
The daily high, daily low, weekly high, and weekly low are objective price zones that show:
Where the market bought (high) or sold (low) the most, and where supply and demand reached their extremes in the past period.
These levels often act as magnetic price zones in ongoing trading, where traders react (entry, profit-taking, or stop setting).
🎯 Use of yesterday's high and low (previous day high/low)
🔹Support and resistance levels
Yesterday's high often acts as resistance when the price comes from below.
Yesterday's low becomes support when the price falls from above.
➡️ Traders watch these levels closely to trade breakouts or reversals.
EMA 9 / EMA 20 → Short-term movements
🎯 Benefits of weekly highs and lows (Weekly High/Low)
Important structural markers in the higher time frame
Weekly highs and lows show medium to long-term market structure.
They are often considered stronger supports/resistances than daily levels.
➡️ For example, if the price breaks above the weekly high, this usually signals institutional interest and may indicate a continuation of the trend.
➡️ Conversely, failure to break above a weekly high may indicate market weakness or a reversal.
DAILY OPEN
The Daily Open is the price at which trading begins on a new day.
It marks the first price after the close of the previous trading session.
👉 In many markets (e.g., Forex, index futures, crypto), this is the starting point of daily price movement, where market direction and sentiment realign.
🎯 Benefits of the Daily Open in chart analysis
Direction indicator (daily bias)
The Daily Open serves as a neutral center line for the current trading day.
Traders use it to assess the market direction (bias):
Price above the Daily Open → bullish day (buyers dominate)
Price below the daily open → bearish day (sellers dominate)
📈 → If the daily open is broken and held above, this indicates upward momentum.
📉 → If it is broken below, this signals weakness.
This simple observation helps traders trade with the daily trend rather than against it.
STOCK MARKET OPENING HOURS
Every major stock exchange has defined trading hours during which institutional capital is active.
Examples (CET):
Asia (Tokyo/ Hong Kong) 1:00 a.m. – 9:00 a.m.
Europe (London/Frankfurt) 08:00 – 17:30
USA (New York) 15:30 – 22:00
Market dynamics change significantly during these time windows, as volume, liquidity, and volatility fluctuate depending on the session.
📈 Benefits in chart analysis
🔹Recognizing volatility and liquidity phases
At the start of a session (e.g., 9:00 a.m. in Frankfurt or 3:30 p.m. in New York), trading volume rises sharply.
This results in strong movements, often with changes in direction or breakouts.
👉 These phases are particularly suitable for:
Breakout strategies
Volume or momentum trades
Example:
If an index (e.g., DAX or S&P 500) reacts strongly at the US opening, this indicates institutional activity that may shape the rest of the day.
PSY HIGH AND PSY LOW
Psy High and Psy Low stand for:
Psychological High → the psychologically significant upper price level of a particular range
Psychological Low → the psychologically significant lower price level
These are often round numbers or striking price zones that market participants unconsciously use as a guide.
Examples:
For EUR/USD: 1.0500, 1.1000, 1.1500
For DAX: 17,000, 17,500, 18,000
For BTC/USD: 60,000, 65,000, 70,000
Traders also refer to such levels as “big figures” or “round numbers.”
📊 Why are psy levels so important?
Because they are based on human perception and market psychology:
👉 People think in round numbers, not in decimals such as 1.1037 or 17.264.
That's why:
Private investors often place their stop losses or take profits just above or below these levels, Institutional traders place large limit orders in these zones, and Algorithms react to the liquidity created there.
→ This results in increased volume, reaction patterns, and price movements at these levels.
ADR (Average Daily Range)
The ADR measures the average daily trading range of a market over a specific period of time – i.e., how many points, pips, or dollars the price typically moves per day.
Example:
If the DAX has moved an average of 180 points per day over the last 14 days, the ADR(14) = 180.
🎯 The benefits of ADR in chart analysis
🔹 Assessment of daily volatility
The ADR shows how much a market typically moves per day.
→ This allows you to see whether the current day is more volatile or calmer than normal.
Interpretation – Meaning
Current range < ADR
→ Market is still moving within normal limits → Potential for further movement
Current range ≈ ADR
→ Daily target largely achieved → lower probability of significant expansion
Current range > ADR
→ Market overextended → increased probability of correction or consolidation
👉 This helps you to plan entries, price targets, and stops realistically.
VWAP (Volume Weighted Average Price)
The VWAP is the volume-weighted average price of a security for a specific period of time – usually per day.
👉 Unlike a simple moving average (e.g., EMA), the VWAP takes into account how much was actually traded – not just where the price was.
It therefore reflects the fair market value, taking into account the trading volume.
🎯 Benefits of VWAP in chart analysis
🔹 Determining the fair average price
The VWAP shows where the majority of the trading volume took place – i.e., the price that the majority of market participants actually paid.
➡️ This is the “fair price of the day.”
Price above VWAP → buyers dominate (bullish)
Price below VWAP → sellers dominate (bearish)
This information is particularly valuable for determining the intraday bias (direction of the day).
BOLLINGER BANDS
Bollinger Bands consist of three lines based on a moving average (usually SMA 20):
Middle band:
→ usually the 20-period SMA (simple moving average)
Upper band:
→ SMA + (2 × standard deviation)
Lower band:
→ SMA − (2 × standard deviation)
👉 This means that the bands “breathe” with volatility – they widen when the market is volatile and contract when the market is calm.
🎯 The benefits of Bollinger Bands in chart analysis
🔹 Measuring market volatility
The main function of Bollinger Bands is to visualize the volatility of a market:
Wide bands → high volatility → strong movement/trend phase
Narrow bands → low volatility → calm market/consolidation
📈 When the bands contract sharply (“Bollinger squeeze”) → often a harbinger of an impending breakout.
KAMA
The KAMA was developed by Perry J. Kaufman.
Unlike normal moving averages such as SMA or EMA, it dynamically adjusts its smoothing to market conditions:
Low volatility / strong trend → reacts faster to price movements
High volatility / sideways movement → reacts slower, reduces false signals
The core idea: adaptability instead of rigid smoothing.
🎯 Benefits of KAMA in chart analysis
🔹 Filtering out market noise
KAMA smooths out unnecessary price fluctuations (noise) that many normal indicators mistakenly interpret as signals.
➡️ This minimizes false signals in sideways phases, while real trends remain visible.
EXTRA LARGE WICKS
A wick (or wick) is the thin line above or below the candle body:
Top → Highest price during the period
Bottom → Lowest price during the period
Long wick → Significant rejection of the price at this extreme zone
Example: A long upper wick means that the price rose high but was then pushed back sharply.
🎯 Benefits of long wicks in chart analysis
🔹 Recognizing rejections and resistance
Long upper wick: Sellers did not allow the higher price → possible downward reversal
Long lower wick: Buyers defended the lower price → possible upward reversal
💡 The market “speaks” through these wicks: It shows where buyers or sellers are not giving in any further.

Ata✨SMAThis Pine Script v6 indicator performs three main functions on a trading chart:
Multiple Moving Averages (MA)
Displays 7 moving averages with fixed lengths (5, 10, 20, 30, 50, 100, 200).
Allows the user to select the MA type: SMA, EMA, WMA, or HMA.
Each MA has a distinct color and line width for clear visual differentiation.
Support and Resistance (S/R) Levels
Identifies key price levels based on pivot points (local highs/lows) within a user‑defined lookback period.
Filters levels by:
Minimum strength (number of touches).
Maximum zone width (as a percentage of price range).
Timeframe (user‑selectable: 5m to monthly).
Visualizes levels as horizontal zones (boxes) colored by type:
Red (res_col) for resistance.
Green (sup_col) for support.
Blue (inch_col) for indecision zones.
Optionally shows a table with level prices, types, and strength percentages.
Includes alert triggers for breakouts (price closing above resistance or below support).
Volume Profile (Side Volumes)
Builds a horizontal volume histogram to the right of the last bar, showing buy/sell volume distribution across price levels.
Highlights the Point of Control (POC) — the price with the highest total volume.
Colors:
Light blue for buy volume.
Light red for sell volume.
Yellow for POC line.
Allows customization of:
Number of bars used for calculation.
Rightward shift of the volume profile.
POC line extension leftward.
Includes tooltips explaining POC and trading scenarios.
Summary:
The script combines trend-following MAs, dynamic S/R zones with alerts, and volume profile analysis into a single indicator for multi‑faceted market structure assessment.

EMA+SuperThis indicator integrates multiple trend-following components into a unified, clean, and easy-to-interpret chart overlay. Its purpose is to help traders observe short-term and long-term trend direction, momentum shifts, and potential areas of interest using established moving-average and volatility-based techniques.
🔹 Features
1. Multi-EMA Framework
Plots the 9, 21, 50, 100, and 200 EMAs to provide a structured view of short, medium, and long-term market trends.
2. Supertrend Overlay
Applies an ATR-based Supertrend to visualize potential directional shifts.
Both uptrend and downtrend zones are lightly shaded for improved clarity.
3. NovaWave-Style Trend Cloud
A dynamic cloud formed from:
Fast EMA
Slow EMA
Signal MA
The cloud automatically adapts its color based on the relationship between the fast and slow EMAs, offering a quick visual read of momentum bias.
4. Displaced Moving Averages (20 / 50 / 200 DMA)
Includes optional forward displacement to replicate commonly used DMA models in trend-following systems.
5. Crossover Buy/Sell Signals
Buy and sell markers appear when the fast EMA crosses above or below the slow EMA.
Users may create custom alerts via the TradingView alerts panel.
🔹 Alerts
This indicator supports built-in EMA crossover alerts:
Buy Alert – triggered when the fast EMA crosses above the slow EMA
Sell Alert – triggered when the fast EMA crosses below the slow EMA
Users can enable these alerts through the “Add Alert” panel and select the corresponding alert condition.
Alerts are evaluated on bar close for consistency and do not repaint.
🔹 How to Use
EMA structure helps define directional bias and market phase.
The Supertrend and Trend Cloud offer contextual confirmation.
EMA crossovers can help highlight momentum changes.
DMAs provide an additional perspective on smoothed trend levels.
This tool is intended for visual analysis and can complement other approaches such as volume studies, higher-timeframe trend analysis, or support/resistance mapping.
⚠️ Disclaimer
This script is for educational and informational purposes only. It does not constitute financial advice or guarantee any outcome. Always perform independent analysis and apply proper risk management.

Vortex Pro with Moving average [point algo]Vortex Pro with MA Dropdown is an enhanced version of the classic Vortex Indicator (VI), designed to help visualize directional strength by comparing positive and negative trend movement.
This version includes a smoothed “Vortex Pro” line, adjustable moving-average filtering, and dynamic zone coloring for improved readability.
How It Works:
The script calculates VI+ and VI− using directional movement and true range.
“Vortex Pro” is derived from the difference between VI+ and VI−, scaled for clarity.
A customizable moving average (EMA, SMA, HMA, WMA) is applied to help smooth volatility and highlight shifts in momentum.
Features :
• Vortex Pro Line
A scaled trend-strength line showing when positive movement is dominating or weakening.
• MA Type Dropdown
Choose between EMA, SMA, HMA, or WMA to smooth the Vortex Pro line.
• Zero-Line Structure
A plotted zero line is used to compare positive vs. negative strength visually.
• Dynamic Fill Zones
Green shading when the Vortex Pro line is above zero, red when below.
Usage:
This tool is designed for visual analysis of trend direction and momentum strength.
It does not generate buy/sell signals and should be used as part of a broader analysis approach.
Suitable for all timeframes and markets.

MadblockUser Instructions for the "Madblock" Indicator (Pine Script v6 – TradingView)
This script creates a daily "Madblock" zone based on the high and low of the 15:30–15:45 NY time period (previous day’s final 15 minutes of regular trading hours for US equities/indices). It then generates optional entry signals the following trading day when price breaks this zone while respecting additional filters (EMAs, time window, signal spacing, and daily limit).
1. How to Add the Script to Your Chart
1. Open TradingView (tradingview.com).
2. Open any chart (preferably ES, NQ, SPX, SPY, or another instrument with US trading hours).
3. Click Pine Editor at the bottom.
4. Delete any existing code and paste the entire script provided.
5. Click Add to Chart (or Save → Add to Chart).
6. The indicator will appear as “Madblock”.
2. Input Settings (customizable in the indicator’s settings panel)
| Input | Default | Description |
|-----------------------|---------|-------------------------------------------------------------------------------------------------|
| Show Madblock Boxes | true | Displays the purple Madblock zones on the chart. Uncheck to hide boxes but keep signals. |
| Box Color | Purple | Color of the Madblock rectangle and background. |
| Transparency | 80 | Background transparency of the box (0 = opaque, 100 = fully transparent). |
| Enable Madblock Signals | true | Turns the long/short entry signals on or off. |
| Show 50 EMA (15m & 30m) | true | Displays the 50-period EMA from the 15-minute and 30-minute timeframes (yellow & orange lines). |
3. What the Indicator Does – Core Functionality
**A. Madblock Zone Creation (Previous Day)**
- Every day at 15:30 NY time → a new box is started using the high/low of that 15:30 candle.
- At 15:45 NY time → the box is finalized by taking the maximum high and minimum low of both the 15:30 and 15:45 candles.
- The box is drawn from 15:30 that day until 17:00 the next trading day (skips weekend automatically).
- This finalized zone becomes the reference levels for the next trading day’s signals.
**B. Signal Generation (Current Trading Day)**
Signals can only appear between 09:45 and 15:59 NY time (no signals in the first 15 minutes after 09:30 open).
Long Signal (green triangle below bar, text “MB”)
- Price closes above yesterday’s Madblock high
- Price is above both the 15-min 50 EMA and 30-min 50 EMA
- At least 4 bars have passed since the previous signal
- Maximum 3 signals per day (long + short combined)
Short Signal (orange triangle above bar, text “MB”)
- Price closes below yesterday’s Madblock low
- Price is below both the 15-min 50 EMA and 30-min 50 EMA
- Same spacing and daily limit rules as long signals
4. Recommended Chart Settings
- Timeframe: 15-minute charts work best.
- Session: Use “Extended Hours” turned OFF (regular trading hours only) for most accurate appearance.
- Time zone: Ensure your chart is set to New York time (or Exchange time for US instruments).
5. Important Notes & Limitations
- The script requires at least two full trading days of history to display boxes and generate signals correctly.
- On Mondays the box is created from the previous Friday’s 15:30–15:45 period.
- Boxes are capped at 500 (TradingView limit); old boxes automatically disappear as new ones are created.
- Signals are purely mechanical and for educational/informational purposes only. No guarantee of profitability.
6. Quick Checklist for Daily Use
1. Confirm chart time zone is America/New_York.
2. Verify yesterday’s purple Madblock zone is visible (15:30–17:00 stretch).
3. Look for “MB” triangles only after 09:45 and before 16:00.
4. Maximum of three signals (combined long + short) per session.
That is all you need to start using the Madblock indicator effectively. Adjust the input settings to match your preferred visual style or to disable elements you do not need.

AVWAP - DatedThis indicator gives you AVWAP from two specific dates of your choice, like Expiry of Futures contract...

7/21 EMA ADX Pro After many months (actually years) of intense research, countless hours of testing different approaches, and rigorous backtesting, I’ve finally developed this indicator/strategy based on moving average crossovers enhanced with power-based filtering to significantly reduce false signals and whipsaws. This is not just another basic MA crossover system. The core idea revolves around applying mathematical powers (exponents) to the moving averages and combining them with additional confirmation filters, creating a much more robust and reliable signal generation mechanism. I’m sharing it with the community in the hope that it can be useful to someone else who, like me, has spent endless nights trying to find an edge in the markets. Feel free to test it, modify it, or improve it. Feedback, suggestions, and constructive criticism are always welcome. If you find it helpful, a simple like or comment would mean a lot — it’s the result of a huge amount of work and passion. Happy trading! (Full Pine Script code will be posted below or in the next update — stay tuned!

Trend-Adaptive 3-Band Reversal CloudThis indicator plots a trend-adaptive, volatility-based 3-band cloud on your chart to visually contextualize potential high-probability reversal, balance, and exhaustion price zones — all in strict alignment with TradingView’s house rules and best compliance practices.
How It Works
Trend Detection:
The script determines short-term trend direction using two adjustable EMAs (fast and slow). When the fast EMA is above the slow, the environment is classified as an uptrend; when below, as a downtrend.
Adaptive Bands and Clouds:
Around the dynamic trend baseline, three cloud “bands” are drawn using multiples of an ATR (Average True Range) volatility filter, automatically adjusting for evolving market conditions:
Middle Band (Fair Value Zone): Area around the baseline, where price is statistically balanced.
Upper Outer Band: In an uptrend, this shows a potential 'exhaustion/overextension' area; in a downtrend, it can act as a deep pullback or reversal area.
Lower Outer Band: In an uptrend, this highlights a possible 'deep pullback/reversal' area; in a downtrend, it becomes the potential exhaustion zone.
Contextual RSI Markers:
When price is in one of the outer bands and RSI is overbought (upper) or oversold (lower), a tiny diamond marker appears on that band as extra context — offering a visual cue for a possible high-momentum exhaustion or deep reversal zone, but never a trade signal or advice.
Visuals and Compliance:
All cloud regions use three different, semi-transparent colors for easy reading, and never block price action.
Labels indicate only “Possible Exhaustion,” “Deep Pullback Zone,” and “Balanced/Fair Value”—the language is strictly neutral and descriptive.
All calculations run only on confirmed, historical bars with zero repainting, no future bar lookahead, and no predictive overlays.
How to Use
Add to Chart:
Simply add the indicator to any chart and timeframe.
Configure:
Adjust the EMA, ATR, and RSI settings via the input panel to best fit your instrument and preferred sensitivity.
Choose band multipliers to widen or contract the cloud according to volatility or your system.
Toggle RSI marker/context highlighting as desired.
Interpretation:
Middle Cloud (“Balanced/Fair Value”): Price in this zone suggests mean reversion, equilibrium, or fair pricing for the session’s volatility/trend conditions.
Outer Clouds: If price reaches an outer cloud, pay attention for potential mean-reversion (if trend persists) or exhaustion zones (especially if a diamond appears).
Uptrend: Lower cloud is where larger pullbacks/reversals are often initiated; upper cloud indicates potential trend exhaustion.
Downtrend: Upper and lower clouds are reversed in interpretation.
Diamond Markers: A red diamond atop the upper band signifies RSI overbought; a lime diamond below the lower band shows RSI oversold. These do not recommend trading—only highlight increased likelihood that buyers/sellers may be overextended.
Best Practices:
Do not use the indicator in isolation or as a signal generator. Combine its context with price action confirmation, volume, or other non-repainting tools.
Use labels only for navigation/context, never as actionable advice.
Technical Details
Inputs/Customization: Fully adjustable (EMAs, ATR period, band multipliers, RSI thresholds, label/marker toggles).
Logic: All code processes only historical closed bars and overlays information in real time.
No repaint, strategy, or alerts: No signals, no script-driven trading, and no claims of prediction or guaranteed probability.
House-rule Clean: The script and its visuals are compliant with TradingView’s publishing requirements, both visually and textually.
Summary:
This tool is designed for traders who want to visually frame high-probability reversal, equilibrium, and exhaustion zones adaptively—while keeping price action primary and avoiding visual or conceptual clutter. Use it to better understand where price may statistically find resistance/support or revert, not to automate signals or guarantee outcomes

EMA Trend Alignment (10/20/50) with MTF & SignalsBullish Crossovers 10>20>50 and Bearish Crossover 10<20<50

Multi-Timeframe Trend MA&BB Suite: 6x Moving Averages by Jenn.ioMulti-Timeframe Trend MA & BB Suite: 6x Moving Averages + 5x MTF View by Jenn.io
Indicator Overview
This indicator is a comprehensive, all-in-one trend and volatility tool designed for traders who rely on Moving Averages (MAs) and Bollinger Bands (BBs). It stands out by allowing users to plot up to six fully customized MAs on the current chart, while simultaneously projecting the values of those same MAs from up to five higher timeframes (MTF).
It's the essential tool for top-down analysis and identifying high-probability confluence zones.
Key Features and Customization
1. The Core: 6x MAs and Bollinger Bands: six Independent MAs: Plot up to six separate Moving Averages on your current chart. Each MA is fully customizable in terms of:
Type: Choose from SMA, EMA, SMMA (RMA), WMA, or VWMA.
Source and Length: Set the calculation source (Close, Open, etc.) and the lookback period.
Style: Customize color, thickness, and line style (Solid, Dashed, Dotted).
Integrated Bollinger Bands (BB): Includes standard Bollinger Bands with customization for length, standard deviation, MA type, and the option to enable or disable the band fill color.
2. Advanced: Multi-Timeframe (MTF) Projection
a. 5x MTF Timeframes: The user can enable and fully customize up to five distinct higher timeframes (e.g., Daily, Weekly, Monthly, 4H, 15m).
b. Dynamic MTF Visualization: The indicator fetches the value of the 6 MAs from these higher timeframes and displays them on the current chart using one of three customizable modes:
Extended Mode: Projects the MTF MA value as a continuous line extending to the right, simulating where the MA is moving on the higher chart.
Floating Segment: Draws a short, visible line segment near the current price action, showing the MA value without cluttering the whole chart.
Floating Label: Displays the MA value as a text label anchored to the right of the current bar, providing clean, non-obtrusive data.
Recommended Usage
1. MTF Confluence: Look for instances where the MTF MA lines align closely with the MAs or BBs of your current timeframe. These areas represent strong support/resistance zones.
2. Trend Filter: Use the Extended Mode MTF lines to quickly determine the higher-timeframe trend without changing your chart. For example, if the Daily 200 EMA is above the current price, the bias is bearish.
3. Precision Entries: Use the Floating Label Mode to see the precise MA value from a higher timeframe. This is useful for placing limit orders near key structural levels.

ID Candle Body % Star Rating + SMC ToolkitThis tool combines strong-body candle detection, trend analysis, SMC-based setups, session levels, VWAP, Donchian Channels and live alerts. It’s built to help you read momentum, structure and volatility on any intraday chart.
1. Strong Body Candle Detection
The script highlights candles with exceptional bodies using three conditions:
• Body is larger than the previous five candles
• Body makes up more than 85% of the entire candle
• Both conditions happening at the same time
These signals help you spot strength or exhaustion in real time.
2. EMA Trend Layer
Three EMAs (50/100/200 by default) plot the overall trend.
When enabled, the area between the fast and slow EMAs fills with a soft color to show bullish or bearish bias at a glance.
3. Bullish and Bearish Setup (ICT-style patterns)
The indicator marks classic two-candle continuation setups:
• Bullish setup with a break above the previous high and an FVG
• Bearish setup with a break below the previous low and an FVG
You can also enable “low break” and “high break” variations to track liquidity sweeps.
Each setup has its own alert option.
4. Four Key Market Sessions
The script plots Asia Open, Midnight Open, London Open and New York Open.
Each session shows:
• A real-time box
• High, low and midpoint
• Optional extended lines projecting forward
These levels often act as reaction zones on lower timeframes.
5. VWAP With Optional Bands
You can anchor VWAP to the session, week, month, quarter or year.
Bands can be calculated using standard deviation or a percentage.
There’s also an option to hide VWAP on higher timeframes.
6. Donchian Channel
A classic 20-period DC is included to provide an additional structure reference for breakouts and trend ranges.
7. Real-Time Alerts
Alerts trigger only once per bar and cover:
• Bullish setup
• Bearish setup
• Liquidity sweep variations
• VWAP star-rating (if enabled in the code block)
Great for traders who monitor multiple pairs.

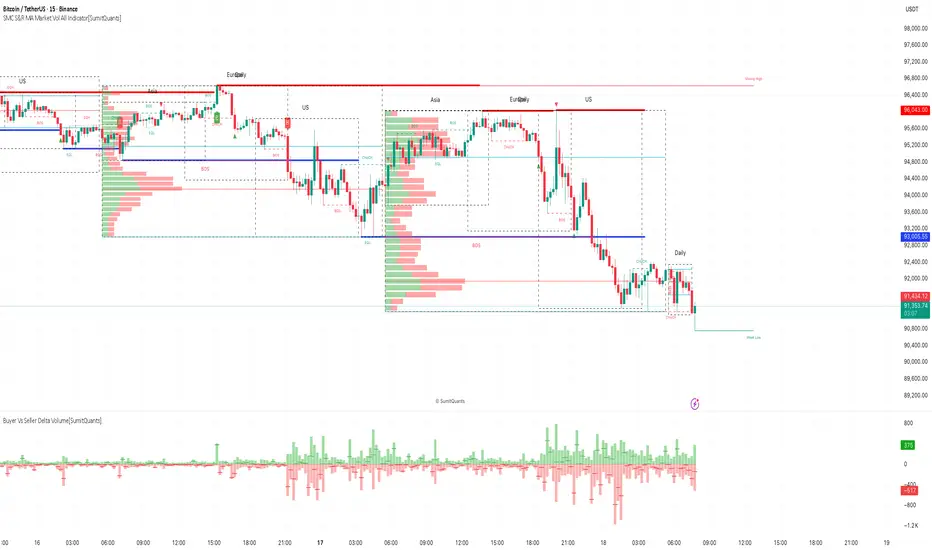
Nifty SMC S&R MA and All Indicator[SumitQuants]🇮🇳🔥 **Nifty SMC S&R + MA + VWAP + Order Flow Suite
**
Built for Indian Markets • Tuned for NIFTY, BANKNIFTY & NSE Stocks
A complete institutional-grade trading system crafted for Indian traders who want a serious edge using Smart Money Concepts, Market Structure, Support–Resistance Strength, VWAP, Breakout Logic & Trend Tools — all combined into ONE ultra-optimized indicator.
🧠 Why This Indicator Stands Out
Most indicators only show price.
This one shows intent — clear, confident, and easy to read.
It reveals:
➡ where institutions are active
➡ where liquidity is sitting
➡ where real strength is building
➡ and who is actually in control — buyers or sellers
This is how professional desks read the markets — and now you can too.
🔥 What’s Inside (Complete Feature Stack)
🟧 1. Support–Resistance Strength Engine (Buyer/Seller Strength %)
Your built-in market power meter:
🟦 Auto S/R zones
🟩 Buyer vs Seller Strength %
🟨 Strength boxes with clean visuals
🔁 Live reactions when price taps strong or weak zones
Perfect for timing entries, reversals, retests and trap-detections in NIFTY & BANKNIFTY.
🟩 2. Smart Money Concepts (Full SMC Suite)
A complete institutional SMC system:
✔ BOS / CHoCH (Internal + Swing)
✔ Market Structure in real time
✔ Internal & Swing Order Blocks
✔ Strong / Weak Highs & Lows
✔ Equal High / Equal Low (EQH/EQL)
✔ Fair Value Gaps (FVG)
✔ Trend Bias Coloring
✔ Premium / Discount Zones
Every element is built for clarity — high-quality visuals without chart clutter.
📈 3. Moving Average Suite (5 Fully Custom MAs)
Elegant MA system for trend confirmation:
✨ EMA
✨ SMA
✨ SMMA
✨ WMA
✨ VWMA
Beautiful colors, clean visibility, and completely optional — enable only what you need.
⚡ 4. Enhanced Supertrend System
A modern Supertrend built for actual usability:
🎨 3 display styles (Line / Histogram / Ghost Mode)
🔄 Clear trend-change signals
🌗 Background trend zones
⚡ No repaint
⏰ Alerts for every reversal
Ideal for intraday momentum and bias confirmation.
📉 5. Breakouts with Volume Confirmation
Stops you from getting trapped in fakeouts:
🔥 Support Break
🔥 Resistance Break
🟦 Bullish Rejection
🟥 Bearish Rejection
📈 Volume-validated breakouts
📊 Smooth visual labels for clean execution
Ultra useful for NIFTY/BANKNIFTY’s typical stophunt → reversal patterns.
🎯 6. VWAP System with Multi-Band Zones
Professional VWAP for Indian markets:
✔ Session VWAP
✔ Weekly VWAP
✔ Monthly VWAP
✔ Premium–Discount Zones
✔ Expansion vs Mean-Reversion levels
✔ Clean visual bands
Perfect for intraday scalping & morning session planning.
🔔 7. Full Alerts Framework Included
Get notified for all key institutional events:
🚨 BOS / CHoCH
🚨 Order Block Breakouts
🚨 Equal High/Low
🚨 Fair Value Gaps
🚨 Trend Changes
🚨 Breakouts
🚨 Swing / Internal Structure Events
Never miss a major shift again — even when away from charts.
🧽 8. Clean UI + Auto Watermark
🖤 Dark/Light mode optimized
🧊 Smooth spacing
✨ Minimalistic visuals
🔍 Zero chart clutter
⚡ High-performance
A premium interface built for Indian index trading.
🧪 Who Is This Built For?
✔ Intraday F&O Traders
✔ NIFTY & BANKNIFTY Scalpers
✔ Swing Traders
✔ Price Action + SMC Traders
✔ VWAP-Based Scalpers
✔ Anyone wanting a complete premium system in a single indicator
⚡ Why Indian Traders Love It
⚡ Captures Nifty morning trap zones
⚡ Predicts London session expansions
⚡ Warns about NY reversal pressure
⚡ Identifies true institutional footprints
⚡ Shows real strength behind S/R zones
⚡ Eliminates false breakouts
⚡ Gives bias, structure & context instantly
This is not just an indicator —
It’s a full institutional trading framework.
🛒 Get Full Access
This indicator is available exclusively inside the Courses section on the official website.
👉 Purchase & Access:
www.ironmindtrader.com
Inside the course:
🔧 Installation Steps
⚙️ Recommended Settings
📘 Trading Logic
🔄 Lifetime Updates Included

9/20 EMA Trend indicator Fill for daytrading fills a color in between the lines of the 9 and 20 EMA to show trend easily

SMC S&R MA Market Vol All Indicator[SumitQuants]🚀 SMC S&R + Market Sessions + Volume Profile + Order Flow Suite
The Only All-In-One Institutional Trading System You’ll Ever Need.
Looking for an indicator that actually brings clarity to chaotic markets?
Meet the SMC S&R MA Market Volume & Sessions Order Flow System — a powerhouse that fuses Smart Money Concepts, Session Profiles, and Dynamic Volume Flow into one ultra-optimized institutional toolkit.
This is not “just another SMC indicator.”
This is your complete trading ecosystem.
💠 What This Indicator Does (In Simple Terms)
It automatically reads the market the way institutions do — and displays it cleanly on your chart with zero clutter.
Below is everything packed inside 👇
🔥 1. Market Sessions + Volume Profile (Real Institutional Map)
✔ Tokyo- Asia | London- Europe | New York- US sessions auto-detected ⏱️
✔ Each session gets its own Volume Profile 📊
✔ See POC, VAH, VAL, Value Area Box for each session
✔ Live Developing Profile in real-time
✔ Wick-based and body-volume distribution for ultra-accurate auctions
✔ Session Boxes that highlight imbalance zones
✔ Perfect for:
High-volume Asia breaks
London volatility expansion
NY reversal traps
👉 Think of it as having pro-level TPO/Volume Profile inside TradingView.
🎯 2. Advanced S&R Strength Engine (Buyer vs Seller Power Meter)
✔ Detects strongest Support & Resistance zones
✔ Measures Buyer Strength & Seller Strength (% based)
✔ Auto-plots S/R Lines + S/R Zones
✔ Detects Bounce signals, Rejection points, Pressure shifts
✔ Zero repaint logic
You get institutional footprints directly on your chart.
📈 3. Smart Money Concepts (Full Automation)
✔ BOS / CHoCH detection
✔ Internal + Swing Structure
✔ Order Blocks (Internal + Swing)
✔ Equal Highs & Equal Lows
✔ Fair Value Gaps (FVG)
✔ Strong/Weak Highs + Lows labeling
✔ Trend coloring (optional)
✔ Premium / Discount Zones
All plotted with precision.
All customizable.
All built to remove guesswork.
💹 4. Multi-MA Engine (5 Fully Configurable MAs)
✔ EMA, SMA, WMA, VWMA, SMMA
✔ Choose length, color, and source
✔ Ideal for trend confirmation + dynamic S/R
Smooth. Clean. Non-laggy.
📊 5. Enhanced Supertrend (Toggles + Filters)
✔ Switch between Line / Histogram / Hidden
✔ Optional background trend coloring
✔ Buy/Sell signals with trend-change alerts
✔ No repaint
Perfect for directional bias.
⚡ 6. Breakout Detection + Volume Confirmation
✔ Auto-detects Support/Resistance Breaks
✔ Confirms breaks through Volume Surge % Oscillator
✔ Detects:
Bullish Breaks
Bearish Breaks
Bullish Rejections
Bearish Rejections
You instantly know when a breakout is real or fake.
📍 7. VWAP System with Multi-Band Zones
✔ Session-based VWAP
✔ Bands via Std Deviation or %
✔ Clean pullback zones
✔ Perfect for intraday institutions-style precision
🧠 8. Fully Integrated Alerts
Alerts for:
✔ BOS / CHoCH (Internal + Swing)
✔ Order Block Breakouts
✔ Equal Highs / Equal Lows
✔ Fair Value Gaps
✔ S/R Zone Interactions
✔ Trend Shifts
✔ Breakouts with Volume Confirmation
✔ Supertrend Reversals
And more.
Never miss major price shifts again.
🎨 9. Clean UI + Auto-Adaptive Watermark
✔ Auto-contrast watermark
✔ Minimalistic but premium
✔ Chart-friendly colors
✔ Built to match dark or light themes
🌍 Who This Indicator Is For?
✔ Intraday traders
✔ Swing traders
✔ SMC traders
✔ Volume/Order Flow traders
✔ Forex, Crypto, Index & Stocks
✔ Anyone wanting a single all-in-one trading system
🔥 Why 90% Traders Love This System
Because it gives you:
🔥 Session Bias
🔥 Volume-backed Zones
🔥 Clean Market Structure
🔥 Trend Bias + Liquidity Areas
🔥 Institutional S/R with Strength Meter
🔥 Accurate Order Flow Reactions
Everything you need to trade like top-tier professionals — without needing 10 indicators.
🛒 Get Full Access
This premium institutional system is available as part of the Courses Section on the official website.
👉 Purchase the indicator as a Course at:
www.ironmindtrader.com
Inside the course, you'll get:
✔ Access instructions
✔ Setup guide
✔ Trading rules
✔ Updates included