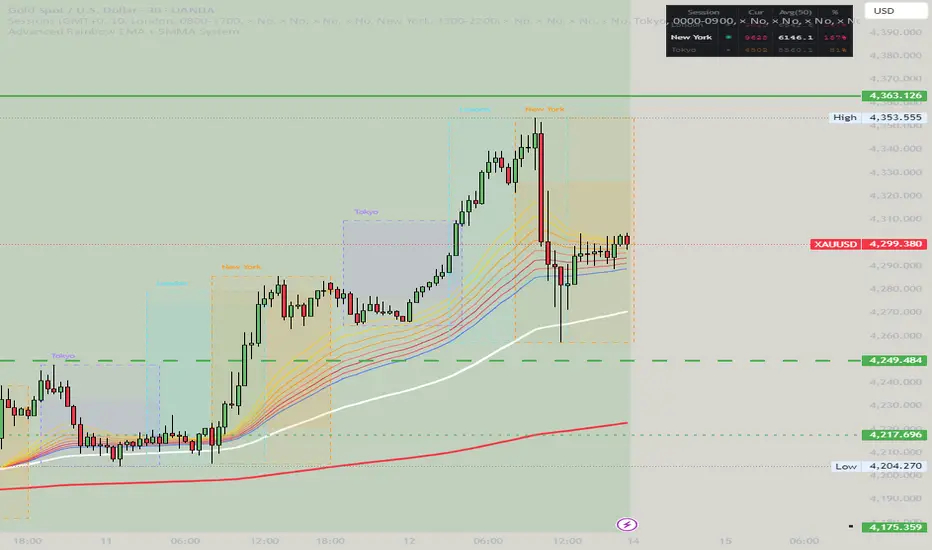
Advanced Rainbow EMA + SMMA System - VILLAGE PILOT Advanced Rainbow EMA + SMMA System
This custom indicator overlays eight rainbow‑colored EMAs (20, 25, 30, 35, 40, 45, 50, 55) together with two Smoothed Moving Averages (SMMA 50 in white, SMMA 200 in red).
Features:
🌈 Rainbow EMAs: Smooth gradient from yellow → gold → orange → dark orange → tomato → crimson → red → blue, showing short‑ to medium‑term momentum.
⚪🔴 Smoothed Moving Averages: Thick white SMMA (50) and thick red SMMA (200) for long‑term trend context.
🟩🟥 Background shading: Green when EMAs align bullish and SMMA 50 > SMMA 200, red when bearish.
📈📉 Signal arrows: “BUY” labels on Golden Cross (SMMA 50 crossing above SMMA 200), “SELL” labels on Death Cross (SMMA 50 crossing below SMMA 200).
🔔 Alerts: Built‑in TradingView alerts for Golden/Death Cross and for strong bullish/bearish EMA alignment.
Use case: This tool helps traders quickly visualize short‑term momentum against long‑term smoothed trend direction. It highlights strong trending conditions, potential reversals, and crossover signals, making it suitable for swing trading, trend following, and confirmation of entries/exits.
移動平均線
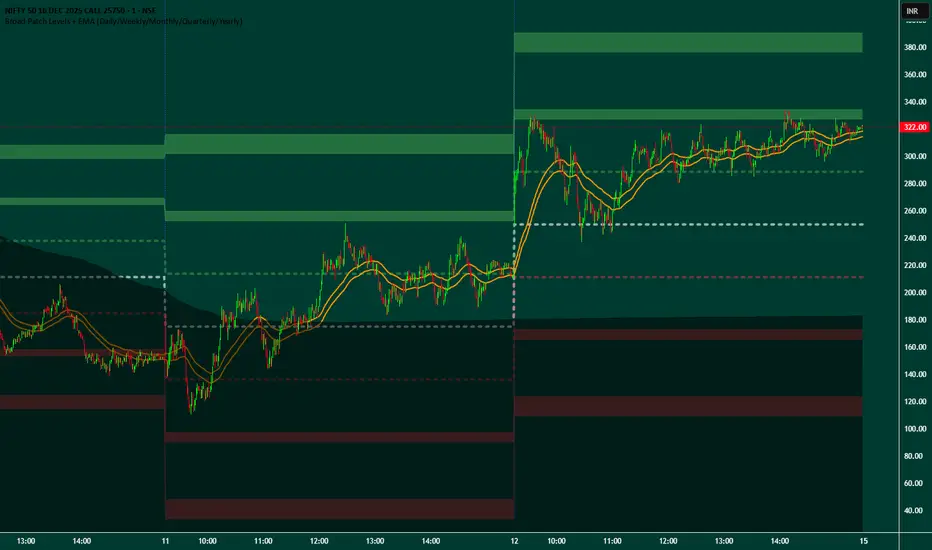
Broad Patch Levels + EMA (Daily/Weekly) with Directional AlertsThis indicator provides dynamic support and resistance levels along with trend guidance using EMA lines for daily or weekly timeframes. It is fully customizable, offering toggles for individual levels, trend lines, and alert notifications.
Key highlights:
Clearly visualize key market levels for potential trade entries and exits.
Monitor trend direction with EMA-based guidance.
Receive alerts when price interacts with important levels or trend zones.
Configurable visibility and alert options for a clean and personalized chart layout.
Ideal for professional traders looking for a structured, easy-to-read market perspective without exposing proprietary methods or calculations.
SCSC Gaussian + Full Weighted MA Hybrid (All Timeframes)SCSC Gaussian + Full Weighted MA Hybrid is a trend-focused indicator designed for 15-minute and Daily timeframes, combining Gaussian smoothing with a fully weighted moving average structure.
The indicator creates a hybrid trend line by blending multiple moving averages with Gaussian filtering, then applies ATR-based dynamic bands to detect meaningful price expansions.
Buy signals are generated during confirmed upward trends, while sideways and weak market conditions are filtered out.
Signals are intentionally selective, aiming to reduce noise and focus on clean trend continuation moves.
Key Notes
Optimized for 15m and Daily charts
Hybrid trend logic with volatility-adaptive bands
Sideways market filtering
Designed for trend-following and swing trading
Visual, chart-friendly signal structure
⚠️ This indicator is a decision-support tool, not a complete trading system.
Always combine with risk management and confirmation tools.
NFA | DYOR

MNQ DP Levels and 1m high frequency HP+MP trading signalsidea to trade off QQQ DPs converted to NQ (dont ask me :) )on 1m chart focusing only on MP,HP triggers and scaling in down to a downside DP as an exit.
Disclaimer: This tool is for educational purposes only and does not constitute financial advice. Past performance does not guarantee future results.

BIGG CHIEFF RWB MASTER v2.0 (Indicator) [v1.0]Here is a **clean, professional TradingView indicator description** you can paste directly into the script description. It explains the *logic and philosophy* without exposing proprietary specifics, while still sounding robust and credible.
---
## 📊 Indicator Overview
This indicator is a **rule-based EMA crossover strategy built on price action, opening range structure, directional bias, and momentum confirmation**.
It is designed for intraday trading during the New York session and adapts to both time-based and tick-based charts.
The system focuses on **clarity, patience, and consistency**, filtering out low-quality conditions while aligning trades with higher-probability market structure.
---
## 🧭 Core Concepts
### Opening Range Structure
* The strategy uses the **first 15 minutes of the New York session** to define an Opening Range.
* This range establishes **key intraday structure**, including:
* High
* Low
* Midpoint
* The Opening Range remains visible for the entire session and resets each day.
* Trades are framed around **breaks, retests, and rejections** of this structure.
---
## 📈 Trend, Bias & Momentum
### Directional Bias
Bias is determined by:
* **EMA stacking order**
* **Price location relative to the Opening Range**
* Optional **higher-timeframe trend alignment**
Once bias is confirmed:
* Trades are only taken **in the direction of that bias**
* Opposing trades are locked out until structure meaningfully changes
This prevents overtrading and reduces whipsaws in choppy conditions.
---
### Higher-Timeframe Alignment (Optional)
A higher-timeframe trend filter can be enabled to:
* Keep trades aligned with the broader market direction
* Improve win rate during trending sessions
* Reduce countertrend entries
---
## ⚡ Volatility & Time Filters
To avoid low-quality trades, the system includes:
* **Volatility filtering** to prevent entries during compressed or dead markets
* **Session time windows** to focus on the most liquid trading hours
* Optional **no-trade time blocks** for news or known high-risk periods
---
## 💧 Liquidity Awareness
The indicator accounts for **key liquidity zones**, such as:
* Prior session highs and lows
* Overnight and premarket extremes
Trades are filtered to ensure there is **sufficient room for reward** before running into nearby liquidity, helping avoid premature exits.
---
## ✅ Entry Logic (Primary Mode)
Trades are based on **structure first, confirmation second**:
* Breakouts must be confirmed by **candle closes**, not wicks
* Entries occur on **retracements and rejection candles**, not chase candles
* Priority is given to cleaner retests closer to structure
* Optional controls allow limiting trades to **first-touch setups only**
This encourages patience and avoids emotional entries.
---
## 🛑 Risk Management & Trade Management
The system is built around **R-multiple consistency**, not fixed targets.
* Stops are volatility-based
* Multiple profit targets can be enabled
* Optional partial profits and trailing stop logic are included
* Trailing behavior can follow momentum or structure once price moves favorably
Everything is designed to **protect capital first and scale winners second**.
---
## 🧠 Philosophy
This indicator is not designed to predict the market.
It is designed to **react intelligently** to what price is already confirming.
It prioritizes:
* Structure over indicators
* Bias over impulse
* Confirmation over hope
* Risk management over win rate
Best results come from disciplined execution, patience, and respecting the filters.

Trading Dashboard + Daily SMAsThis indicator is an all-in-one workspace overlay designed for futures and intraday traders. It consolidates critical market internals, session statistics, and daily technical levels into a single, highly customizable dashboard.
The goal of this script is to reduce chart clutter by placing essential data into a clean table while overlaying key Daily Moving Averages onto your intraday timeframe.
Key Features:
1. Comprehensive Market Internals Dashboard Monitor the health of the broad market directly from your chart. The dashboard includes real-time data for:
VIX: Volatility Index.
TICK & TRIN: Sentiment and volume flow indicators.
Breadth Data: ADD, ADV, and DECL (Advance/Decline lines and volume).
Multi-Ticker Watch: Monitor 3 additional assets (Defaults: NQ, RTY, YM) with real-time price and % change.
2. Session Statistics & Probabilities Automated calculation of intraday statistics based on a user-defined lookback period (default 100 days):
RTH Data: Tracks Regular Trading Hours Open, Close, and Range.
Contextual ATR: Compares current RTH range to the 14-day ATR.
Probabilities: Displays historical probabilities for "Gap Fill," "Break of Yesterday's High," and "Break of Yesterday's Low."
3. Daily SMAs on Intraday Charts Plot key Daily Simple Moving Averages (21, 50, 200) directly on your lower timeframe charts (1m, 5m, etc.) without switching views.
Fully Customizable: Toggle each SMA on/off individually.
Color Control: Users can change the color of every SMA line to fit their theme.
4. "Dark Mode" Optimized The dashboard features a specific "Very Dark Grey" (#121212) background by default, designed to reduce eye strain and blend seamlessly with dark-themed trading setups.
Settings & Customization:
Session Times: Define your specific RTH start and end times.
Symbols: All ticker symbols (VIX, ADD, NQ, etc.) can be customized in the settings menu to match your data provider.
Visibility: Every element in the table and every SMA line has a toggle switch. You only see what you need.
Visuals: Change table position, text size, and line colors.
Author's Instructions: Configuration Guide
This script relies on specific ticker symbols to pull data for Market Internals (TICK, TRIN, ADD) and the Watchlist. Depending on your data subscription plan (CME, CBOE, etc.), you may need to adjust the default symbols to match what you have access to.
1. How to Change Symbols
Add the indicator to your chart.
Hover over the indicator name in the top-left corner and click the Settings (Gear Icon).
Scroll to the "Symbols" section.
Click inside the text box for the symbol you want to change.
2. Common Symbol Formats If the default symbols show "N/A" or "Error," try these alternatives based on your data feed:
TICK (NYSE Tick)
Default: USI:TICK (Requires specific data)
Alternative: TVC:TICK (General TradingView feed)
Alternative: TICK (Generic)
TRIN (Arms Index)
Default: USI:TRIN
Alternative: TVC:TRIN
Alternative: TRIN
Breadth (ADD/ADV/DECL)
ADD (Advance-Decline Line): Try USI:ADD, TVC:ADD, or ADD
ADV (Advancing Volume): Try USI:ADV, TVC:ADV, or UVOL (Up Volume)
DECL (Declining Volume): Try USI:DECL, TVC:DECL, or DVOL (Down Volume)
VIX
Standard: CBOE:VIX or TVC:VIX
3. Setting Up the Ticker Watchlist (Ticker 1, 2, 3) The script defaults to "Continuous Contracts" (indicated by the 1!), which automatically rolls to the front month.
Nasdaq: CME_MINI:NQ1!
S&P 500: CME_MINI:ES1!
Russell 2000: CME_MINI:RTY1!
Dow Jones: CBOT_MINI:YM1!
Note: If you want to watch a specific contract month (e.g., December 2025), enter the specific code like NQZ2025.
4. Troubleshooting "N/A" Data If a cell in the table is empty or says "N/A":
Verify you are not viewing the chart on a timeframe that excludes the data (though dynamic_requests=true usually handles this).
Ensure you have the correct data permission for that specific symbol.
Market Closed: Some internal data points only populate during the active NYSE session (09:30 - 16:00 ET).
Disclaimer: This tool is for informational purposes only and does not constitute financial advice. Past probabilities do not guarantee future results.

3 EMA with Alerts 2025This indicator plots three key EMAs (20, 50, and 200) directly on the chart, making it easy to track short-, medium-, and long-term trends. A color-coded table is displayed in the top-right corner for quick reference.
The script also includes smart alerts that trigger only when the state changes:
• 🔵 EMA 20 crossing above EMA 50 & EMA 200 → Bullish signal
• 🔴 EMA 20 crossing below EMA 50 & EMA 200 → Bearish signal
This tool is designed for traders who want clean visuals, reliable alerts, and simplified trend recognition in 2025 markets.

Kairos QX Indicator [v1.7]What’s New in v1.7?
Streak Analytics (Dashboard Expansion):
The dashboard now tracks Winning and Losing Streaks.
Max Consec. (TP / SL): Displays the highest number of wins and losses that occurred in a row (e.g., 5 / 3).
Avg Consec. (TP / SL): Calculates the average length of your winning and losing streaks (e.g., 2.4 / 1.8).
Updated Default "settings" for MNQ 5 MIN Candles
Full Script Description
This script is a professional-grade Mean Reversion & Trend Following Engine designed for automated execution. It acts as a bridge between discretionary chart analysis and algorithmic trading, allowing you to backtest complex ideas visually and then automate them via alerts without writing code.
1. Core Logic: The "Flip Switch" Strategy
Standard Mode (Mean Reversion):
The script identifies "exhaustion" points where price pierces the Bollinger Bands.
It bets on a reversal (e.g., Price > Upper Band = Short).
Inverse Mode (Trend Following - Default):
With the "Inverse Trades" box checked, the logic flips.
It identifies "breakout" points where price pierces the bands.
It bets on continuation (e.g., Price > Upper Band = Long).
2. Advanced Automation & Safety Features
This system is built to drive trading bots (like TradersPost or 3Commas) safely:
State-Aware Execution: It tracks its own trades (in_trade state). It will never fire a duplicate "Open" signal if a trade is already active, preventing accidental pyramiding.
No Trade Zone (Force Close): You can define a specific time window (default 15:10–17:00). If a trade is open when this time hits, the script immediately triggers a Close Alert, preventing overnight holds.
Signal Cooldown: Configurable "Signals to Skip" allows you to force a cooldown period after a trade closes to avoid over-trading in choppy conditions.
3. Real-Time Analytics Dashboard
The on-chart table provides a transparent, real-time backtest of your settings:
Equity Calculator: You can set a dollar value per point (e.g., $2 for MNQ). The dashboard calculates your estimated Net Profit/Loss based on the total points gained.
Streak Analysis: Shows both the Maximum and Average number of consecutive wins and losses, helping you understand the psychological difficulty of trading the strategy.
Data Integrity: It automatically detects "N/A" trades (candles that hit both SL and TP) and excludes them from the Win Rate calculation to ensure realistic statistics.
4. Modular "Recipe" Building
The strategy is highly customizable via the settings menu (no coding required). You can filter the Bollinger Band trigger with 10 different indicators:
Supported Filters: RSI, Stochastic, CCI, Williams %R, MFI, CMO, Fisher Transform, Ultimate Oscillator, and ROC.
Logic: All selected filters must agree with the main trigger for a trade to fire.
5. Visual Projection Engine
Glowing Outcomes: The script draws exact TP (Green) and SL (Red) boxes for past trades. These boxes glow to indicate the result, allowing for rapid visual verification of the strategy's performance.
Force Close Markers: Special gray markers appear on the chart where a trade was forced to close due to the "No Trade Zone" time limit.

FlexMAShadeThis provides a flexible moving average that can be changes with shading to indicate the direction of the general trend

Kairos QX Indicator [v1.6]This script, Kairos QX , is a sophisticated, highly customizable trading engine designed for automated execution. It serves as a bridge between discretionary charting and algorithmic trading, allowing you to visually backtest complex ideas and then automate them via alerts.
Its core logic is built on Mean Reversion, but it features a powerful "Inverse Mode" that instantly transforms it into a Trend Following system.
1. The Core Strategy: Mean Reversion (Default)
By default, the script operates on the principle that price eventually returns to an average value after an extreme move.
Logic: It fades the move.
Short Signal: Price pierces the Upper Bollinger Band (overbought) + optional confluence filters (e.g., RSI > 70). The bet is that price will revert down.
Long Signal: Price pierces the Lower Bollinger Band (oversold) + optional confluence filters. The bet is that price will revert up.
2. The "Inverse Mode": Trend Following (Flip Switch)
The script includes a unique Inverse Trades checkbox that flips the entire logic engine. This allows you to adapt to market conditions where price isn't reverting but is instead "running" hard.
Logic: It rides the breakout.
Short Signal becomes Long: When price pierces the Upper Bollinger Band, instead of shorting (expecting a drop), the script enters Long (expecting the trend to blast through and continue higher).
Long Signal becomes Short: When price pierces the Lower Bollinger Band, the script enters Short, betting on a trend continuation downward.
Why this matters: If your backtest shows a failing Mean Reversion strategy (e.g., a "F" grade), flipping this switch can instantly invert those losses into wins by aligning with the trend instead of fighting it.
3. Built for Automation & Safety
The script is engineered to safely drive third-party auto-trading bots (like TradersPost, 3Commas, or PineConnector) without manual intervention.
State-Aware Execution: The script tracks its own trade state. It will never fire a duplicate "Open" signal if a trade is already active, preventing accidental double-entries.
No Trade Zone (Force Close): You can set a specific time window (e.g., 15:55 PM) where the script automatically triggers a Close Alert for any open position. This protects you from holding day trades overnight or through major news events.
Signal Cooldown: To prevent over-trading in choppy markets, you can set the script to ignore the next 1-5 signals after a trade finishes, forcing it to wait for a fresh setup.
4. Modular "Recipe" Building
You don't need to know code to change the strategy. The settings menu allows you to mix and match 10 different indicators as confluence filters.
Example Recipe: "Only take a Mean Reversion Long if: Price is below the Bollinger Band AND RSI is < 30 AND MFI is < 20."
If you check the boxes, the script enforces the rules. If you uncheck them, they are ignored.
5. Visual Projection Dashboard
The script doesn't just print arrows; it performs a real-time visual backtest on the chart.
Glowing Projections: It draws the exact Take Profit (Green) and Stop Loss (Red) boxes for historical trades. These boxes glow to indicate if the trade won or lost.
Data Integrity: It automatically detects and isolates "N/A" trades—candles so volatile that they hit both your SL and TP in the same bar—excluding them from your win rate to keep your data realistic.
Live Grading: A dashboard in the corner grades your current settings (A-F) based on their performance over the last 1,000 to 40,000 bars.


Elmas Formasyonu 2.0Diamond Formation 2.0 is a multi-layered market intelligence engine, designed beyond classical technical indicators.
It does not rely on a single oscillator or a standard formula; instead, it merges multiple market dynamics into a proprietary structure called the Diamond Intelligence Engine.

Valuation Multi-Asset [MTF]Description This indicator is a specialized Intermarket Analysis tool designed to determine the relative valuation of an asset by comparing its performance against key global benchmarks (Currency, Commodities, Bonds, and Sector ETFs).
Unlike standard oscillators (like RSI) that only look at the asset's own price, this script calculates a Relative Value Index.
Underlying Concepts & Methodology The script operates on the principle of asset correlation and mean reversion ratios. The calculation logic follows these steps:
Ratio Calculation: It computes the price ratio between the Chart Asset and a Benchmark Asset (e.g., Symbol / DXY).
Smoothing: It applies a double smoothing method using Exponential Moving Averages (EMAs) to filter out short-term noise from the ratio.
Historical Normalization: Based on valuation theories (inspired by concepts like Larry Williams' valuation window), the script normalizes the smoothed ratio over a user-defined lookback period (default is 3 years/156 weeks). This ranks the current relative value between 0 and 100.
Key Features
Multi-Benchmark Comparison: Automatically compares the asset against the Dollar Index (DXY), Gold (GC1!), Bonds (ZB1!), and Sector ETFs.
MTF Dashboard: Includes a Multi-Timeframe table to see valuation status across Daily, Weekly, and Monthly views simultaneously.
ETF Reference: A built-in reference table to help you quickly find the correct Sector ETF for stock correlation.
How to Use
Undervalued Zone (< 15): When the line turns Green (or enters the bottom zone), the asset is historically cheap relative to the benchmark. This often indicates a potential accumulation or reversal point.
Overvalued Zone (> 85): When the line turns Red (or enters the top zone), the asset is historically expensive relative to the benchmark, suggesting potential distribution.
Divergences: Watch for divergences between the asset price and the Valuation Index (e.g., Price makes a new high, but the Valuation Index against Gold makes a lower high).
Settings
You can toggle individual benchmark lines (Asset 1 to 4).
Adjust the "Lookback Period" to change the historical normalization window.
Customize the Overbought/Oversold thresholds.

EMA Cross + 12 Indicator Dashboard (Candle Filter)🚀 Ultimate EMA Trend Intelligence + 12-Factor Dashboard
Stop trading blind crossovers. Most moving average strategies fail because they lack context. This script solves that by fusing a robust 6-EMA Trend System with a powerhouse “Consensus Engine” that tracks 12 leading indicators simultaneously.
Unlike standard indicators that repaint or react too fast, this tool utilizes a strict “2-Candle Confirmation Protocol” to filter out market noise and bull/bear traps.
🔥 Why This Indicator Give You an Edge:
🛡️ The “Fakeout Shield” (2-Candle Filter): Every signal is double-checked against the previous bar’s momentum. If the trend isn’t sustained, the signal doesn’t fire. No more getting trapped by wicks.
📊 Institutional-Grade Dashboard: Get a real-time HUD (Heads-Up Display) directly on your chart. Instantly see the bias of RSI, MACD, ADX, Bollinger Bands, Volume, and more without cluttering your screen with oscillating lines.
🎯 High-Probability Confluence: A Buy/Sell signal is ONLY generated when the EMAs cross AND a “Council of 12” indicators agrees on the direction (fully adjustable consensus threshold).
🧠 Smart Volume Integration: Volume must exceed 1.5x the average to validate a move, ensuring you’re trading with the smart money, not against it.
🛠️ Key Features:
6-EMA Ribbon Logic: Covers short-term (9/26) to long-term (60/85/200) trends.
Zero-Repaint Signals: Once a candle closes and the label appears, it stays.
Fully Customizable: Adjust the strictness (e.g., require 8 out of 12 indicators to agree) to fit your trading style—from Scalping to Swing Trading.
Ready to trade with clarity? Add this to your chart and let the consensus guide you.

8.2 PRO @Mavrick8.2 PRO @Mavrick is a professional-grade predictive momentum indicator designed for traders who want early, high-confidence entries.
It intelligently combines trend structure, volume behavior, RSI, MACD, and price velocity to anticipate market moves before they fully develop. The indicator features auto-adaptive targets for BTC, ETH, SOL, and altcoins, advanced fake pump/dump detection, and an early momentum warning system to stay ahead of reversals.
A clean smart signal table displays real-time market strength, confidence levels, and actionable BUY/SELL readiness.
Best performance in strong trends and high-volume environments.

Ultimate Trading System - DMA/EMA + Volume + Chart PatternsOVERVIEW
Ultimate Trading System (UTS) is a comprehensive technical analysis tool that combines multiple analysis methods into one powerful
indicator. It detects market structure, identifies chart patterns, analyzes volume, and provides actionable trade recommendations.
FEATURES
17 MOVING AVERAGES
• 6 DMAs (Simple): 5, 10, 20, 50, 100, 200
• 11 EMAs (Exponential): 5, 8, 9, 12, 20, 21, 34, 50, 100, 180, 200
• Smart labels with price values
• Golden Cross / Death Cross detection
CHART PATTERN DETECTION
• Triangles: Ascending, Descending, Symmetrical
• Reversals: Head & Shoulders, Double Top, Double Bottom
• Continuation: Bull Flag, Bear Flag
• Confidence scores for each pattern
VOLUME ANALYSIS
• Relative volume vs 20-period average
• Volume trend detection (rising/falling)
• Bullish/Bearish divergence alerts
• Volume confirmation for signals
SMART ANALYSIS TABLE
• Real-time pattern detection
• Probability-based confidence scores
• Clear trade recommendations
• Volume status and divergence warnings
MARKET STRUCTURE DETECTION
• ACCUMULATION - Strong bullish setup
• DISTRIBUTION - Strong bearish setup
• BULL SETUP - Favorable long conditions
• BEAR SETUP - Favorable short conditions
• TRANSITION - Market changing direction
• CHOPPY - Avoid trading
HOW TO USE
1. Check the analysis table for current market bias
2. Look for pattern confirmations (Triangle, H&S, Double Top/Bottom)
3. Verify volume is confirming the move (not diverging)
4. Follow the ACTION recommendation
5. Use MA levels for support/resistance and stop placement
RECOMMENDATIONS
• 80%+ Confidence = Strong signal, consider entry
• 60-80% Confidence = Look for entries on pullbacks
• 40-60% Confidence = Wait for confirmation
• <40% Confidence = Avoid trading
SETTINGS
• Toggle individual MAs on/off
• Customize colors for each MA
• Adjust label offsets
• Set alert sensitivity (Conservative/Medium/Aggressive)
• Show/hide background colors and analysis table
ALERTS
Set alerts for:
• Strong Buy/Sell signals
• Chart pattern detection
• Volume divergences
• Golden/Death crosses
BEST USED ON
• Stocks, Forex, Crypto, Indices
• Timeframes: 5min to Daily
• Works on all markets

ARDO - Adaptive Regression Deviation Oscillator (v2.4.6)ARDO – Adaptive Regression Deviation Oscillator (v2.4.6)
ARDO (Adaptive Regression Deviation Oscillator) quantifies deviation of price structure from a regression-based equilibrium baseline using adaptive moving-average spreads. It combines percentile-normalized distance, linear-regression slope, and dynamic gradient scaling to reveal trend extension, exhaustion, and regime shifts—offering a structural view of trend integrity and mean-reversion timing beyond traditional momentum oscillators. It is designed to help you answer two questions:
Where are we in the regime? (extended, neutral, or reversal-prone)
Is this a “trade” environment or a “stand aside” environment? (Gate PASS vs Gate BLOCK / drift)
ARDO is best used as a context + timing framework , not a standalone entry/exit system.
What you see in the ARDO pane
1) Spread A (% vs baseline)
Primary “timing” spread (default: stepline). Spread A is colored by a 4-state maColor model:
GREEN : above baseline and strengthening
ORANGE : above baseline but weakening
RED : below baseline and weakening
GRAY : below baseline but improving
2) Spread B (% vs baseline)
Secondary “context” spread (default: columns). Same 4-state color model as above, often used to confirm or filter Spread A behavior.
3) LinReg (slope-gradient)
A LinReg line fit to a selected source (Spread A / Spread B / Spread A+B). ARDO applies a slope-magnitude gradient (opacity/intensity) to visualize regime:
Stronger slope magnitude = stronger directional regime
Fading / low slope magnitude = drift / dead-zone (lower edge, choppy conditions, or end-of-move)
4) Tier zones (Q0–Q2, H2–H4)
ARDO classifies LinReg values into percentile tiers (extremes and mid-tiers). These tiers can be rendered as:
Background regions, or
Zero-line marker circles (“MK …” plots)
Important: Background colors do not export . The “MK Q0 … MK H4” series are emitted so you can reconstruct tier membership in CSV/backtests.
5) Gate PASS / Gate BLOCK
A compact “permission layer” that can require:
Spread A > LinReg
EMA Fast > EMA Slow
Minimum Spread A threshold
Minimum absolute LinReg slope
Use Gate PASS to focus on higher-quality conditions; use Gate BLOCK as a “do nothing / reduce size” warning.
Key settings (what they change)
Tier Mode
Standard: symmetric cut structure (general purpose)
Asymmetric: separate tuning for highs vs lows (often better when upside and downside behavior are not symmetric)
Tier Population
All Bars (LinReg): tiers represent the full LinReg distribution
Pivots Only: tiers are computed from pivot events only (can tighten “extreme” definition and change how frequently zones appear)
Render Mode
Background: easiest to read visually
Zero-line Markers: best for export/backtesting workflows (MK series)
Gating options
Turn on/off each rule independently; adjust thresholds to match symbol volatility and timeframe.
Color overrides
Optional per-state color customization for Spread A, Spread B, and LinReg (4-state).
Alerts included (v2.4.6)
ARDO exposes named alerts you can use for automation or review, including:
Gradient / regime alerts (HIGH vs LOW slope-magnitude regimes; regime shift transitions)
Color-state changes (Spread B → GREEN/ORANGE/RED/GRAY; LinReg state changes)
Tier entry alert s (LinReg entering key tiers such as Q0/Q1/H3/H4)
Structural primitives (Bullish A > B, Bearish A < B, Gate PASS/BLOCK, crosses of 0, etc.)
How to use (practical workflow)
Anchor timeframe (65m or Daily): identify regime (tiers + gradient) and whether you should be aggressive or defensive.
Execution timeframe (5m/1m): time entries using Spread A/B structure and Gate PASS, aligned with the anchor regime.
Avoid forcing trades in drift: fading gradient + mid/low-edge tiers often marks “dead-zone” conditions.
Notes / limitations
ARDO is a context engine: it describes regime and location, not guaranteed direction.
Tier thresholds are distribution-based and will vary by window/timeframe.
Always apply your own risk management; this script is not financial advice.

ENIGMA PROENIGMA PRO: Multi-Strategy & Signal Verification System (Smart Signal Panel)
Description: Transform market chaos into clarity. Enigma combines 12 independent and powerful algorithms (based on Trend, Momentum, Volume, Reversal, and Squeeze) running in the background into a single control panel.
Instead of relying on a single indicator, rely on the "Consensus of Strategies". Enigma doesn't just say "BUY"; it shows exactly how many different strategies support this decision simultaneously.
Key Features:
🧩 12 Hidden Algorithms (T1-T12): HMA, Ichimoku, RSI, Volume, EMA, Stochastic, and more are constantly scanning in the background.
🎛 Signal Confirmation Mechanism: You decide the minimum number of strategies required to trigger an alarm. (e.g., "Notify me only if at least 3 strategies signal BUY").
📊 Live Control Panel: Instantly monitor which strategies are active via the dashboard in the top-right corner.
🎯 Precise Filtering: Pinpoint opportunities with Common Volume Threshold (RVol), Date Range, and Day-Based Scanning (e.g., Only Fridays) options.
🛡 Risk Management: Visualize automatic TP (Take Profit) and SL (Stop Loss) levels directly on the chart.
The only tool you need to decode the market cipher.
Turn off the noise, turn on Enigma.

GIX-Treid-2Timeframes: M15 – H1 (and higher)
An advanced SuperTrend, more stable and more intelligent, based on statistical calculations, not market noise.
It calculates a statistical moving average, significantly smoother than EMA or SMA.
It builds an adaptive channel around this average, using fixed pip/tick steps (not a classic ATR).
The trend changes only when price breaks the channel, not on minor fluctuations.
The main line moves in discrete steps, not continuously → no repaint and no whipsawing.
Line color indicates direction:
Green = bullish trend
Red = bearish trend

EMA Slope Angle# EMA Slope Angle Indicator
A professional, non-repainting overlay indicator that visualizes EMA slope strength as an angle in degrees, providing instant visual feedback through dynamic EMA coloring and comprehensive trend analysis.
## ORIGINALITY
This indicator is original in its approach to slope measurement:
- **Angle-based calculation**: Uses arctangent to calculate slope as an angle in degrees (not percentage), providing a more intuitive measure of trend strength
- **Dynamic visual feedback**: Combines real-time EMA line coloring with regime detection, creating a continuous visual representation of market conditions
- **Comprehensive analysis**: Integrates angle-based trend shift signals with optional statistical analysis in a single, cohesive tool
- **Non-repainting design**: All calculations use confirmed bars only, ensuring reliable, deterministic output
## HOW IT WORKS
The indicator calculates the EMA slope angle using trigonometric functions:
```
Angle = arctan((EMA_current - EMA_past) / lookback_bars) × 180/π
```
This provides an intuitive measure where:
- **Steep angles** = strong trends (visualized with saturated colors)
- **Shallow angles** = weak trends (visualized with lighter colors)
- **Near-zero angles** = flat/consolidation (visualized in gray)
The EMA line color dynamically reflects:
- **Direction**: Green shades for uptrends, red shades for downtrends
- **Strength**: Color intensity based on normalized angle (stronger slopes = more saturated colors)
- **Regime**: Gray for flat conditions when angle is below threshold
## KEY FEATURES
### Dynamic EMA Coloring
- EMA line color changes continuously based on slope strength
- Color intensity reflects trend strength (50-100% opacity range)
- Instant visual feedback without cluttering the chart
### Regime Detection
- Automatically classifies market conditions: **RISING**, **FALLING**, or **FLAT**
- Configurable angle thresholds for regime classification
- Real-time regime updates on confirmed bars only
### Trend-Shift Signals
- Detects transitions from FLAT to RISING/FALLING regimes
- Visual arrows on chart when significant trend shifts occur
- Prevents signal spam by only triggering from FLAT state
- Configurable trigger thresholds for signal sensitivity
### KPI Dashboard
- Real-time angle display (rounded to 1 decimal place)
- Current regime status with color coding
- Last signal tracking (UP/DOWN/NONE)
- Positioned in top-right corner for easy reference
### Advanced Angle Statistics (Optional)
- Detailed breakdown of angle distribution across 9 granular buckets:
- 0-0.2°, 0.2-0.5°, 0.5-1°, 1-1.5°, 1.5-2°, 2-3°, 3-5°, 5-10°, >10°
- Shows count and percentage for each bucket
- Automatically resets on symbol/timeframe changes
- Useful for analyzing historical slope patterns
## SETTINGS
### Main Settings
- **EMA Length**: Period for exponential moving average (default: 50)
- **Slope Lookback Bars**: Number of bars to compare for slope calculation (default: 5)
### Angle Settings
- **Flat Angle Threshold**: Maximum angle for FLAT regime classification (default: 2.0°)
- **Rising Angle Trigger**: Minimum angle to trigger RISING regime and UP signals (default: 1.0°)
- **Falling Angle Trigger**: Maximum angle to trigger FALLING regime and DOWN signals (default: -1.0°)
- **Max Angle for Color Saturation**: Maximum angle for full color intensity (default: 30.0°)
### Display Options
- **Uptrend Color**: Color for rising trends (default: dark green)
- **Downtrend Color**: Color for falling trends (default: dark red)
- **Flat Color**: Color for flat conditions (default: gray)
- **Show Trend-Shift Signals**: Toggle signal arrows on/off (default: true)
- **Show Angle Statistics**: Toggle statistics dashboard on/off (default: false)
## NON-REPAINTING GUARANTEE
- All calculations use confirmed bars only (`barstate.isconfirmed`)
- No future bar references
- No higher timeframe calls using `request.security()`
- Deterministic output - what you see is what you get
- Reliable for backtesting and live trading
## USE CASES
- **Trend Identification**: Instantly identify trend strength and direction at a glance
- **Reversal Detection**: Spot trend reversals early through regime changes
- **Trade Filtering**: Filter trades based on slope strength and regime
- **Consolidation Monitoring**: Identify flat market conditions for range trading
- **Pattern Analysis**: Study historical angle distributions to understand market behavior
- **Momentum Assessment**: Gauge trend momentum through visual color intensity
## LIMITATIONS
- Angle calculation depends on EMA length and lookback period settings
- Regime classification is based on configurable thresholds - adjust to match your trading style
- Signals only trigger when transitioning from FLAT state to prevent spam
- Statistics reset on symbol/timeframe changes (by design)
- Color intensity is normalized to max angle setting - adjust for your market's typical ranges
## TECHNICAL NOTES
- Uses Pine Script v6
- Overlay indicator (plots on price chart)
- No external dependencies
- Compatible with all TradingView chart types
- Works on all timeframes and symbols
## DISCLAIMER
This indicator is designed for visual trend analysis and educational purposes. Always combine with other technical analysis tools, fundamental analysis, and proper risk management strategies. Past performance does not guarantee future results. Trading involves risk of loss.
---
**Perfect for**: Swing traders, day traders, trend followers, and market analysts seeking intuitive trend strength visualization.

Combined: Gann HL + Supertrend + Supertrend v6Combined: Gann HL + Supertrend + Supertrend v6
Included Indicators
1. Gann High-Low Activator
A dynamic trend tool that flips direction when price crosses its smoothed high/low average. Gann signals often catch clean directional swings and act as an excellent early trend filter.
2. Standard Supertrend (ATR-based)
The classic trend-following indicator using average true range for volatility-adaptive stop levels. Its direction flips mark trend reversals, especially effective in trending markets.
3. Orekhov Supertrend (GPL Classic)
A robust version of Supertrend that includes wick sensitivity and doji-handling logic. It behaves smoothly on lower timeframes, avoiding false flips and maintaining direction more intelligently.

WOLFGATEWOLFGATE is a clean, session-aware market structure and regime framework designed to help traders contextualize price action using widely accepted institutional references. The indicator focuses on structure, momentum alignment, and mean interaction, without generating trade signals or predictions.
This script is built for clarity and decision support. It provides a consistent way to evaluate market conditions across different environments while remaining flexible to individual trading styles.
What This Indicator Displays
Momentum & Structure Averages
9 EMA — Short-term momentum driver
21 EMA — Structural control and trend confirmation
200 SMA — Primary regime boundary
400 SMA (optional) — Deep regime / macro bias reference
These averages are intended to help assess directional alignment, trend strength, and structural consistency.
Session VWAP (Institutional Mean)
Session-based VWAP with a clean daily reset
Default session: 09:30–16:00 ET
Uses HLC3 as the VWAP source for balanced price input
Rendered in a high-contrast institutional blue for visibility
VWAP can be used to evaluate mean interaction, acceptance, or rejection during the active session.
How to Use WOLFGATE
This framework is designed for context, not signals.
Traders may use WOLFGATE to:
Identify bullish or bearish market regimes
Evaluate momentum alignment across multiple time horizons
Observe price behavior relative to VWAP
Maintain directional bias during trending conditions
Avoid low-quality conditions when structure is misaligned
The indicator does not generate buy or sell signals and does not include alerts or automated execution logic.
Important Notes
Volume must be added separately using TradingView’s built-in Volume indicator
(Volume cannot be embedded directly into this script due to platform limitations.)
This script is intended for educational and analytical purposes only
No financial advice is provided
Users are responsible for their own risk management and trade decisions

Optimal Daily MA Suite [MTF]Title: Optimal Daily MA Suite
Description: This is a comprehensive Multi-Timeframe (MTF) analysis suite designed to streamline chart layouts. Instead of loading multiple separate indicators to track various trend lines, this single tool allows traders to overlay higher-timeframe Moving Averages and key support/resistance levels directly onto their intraday charts.
Utility & Workflow: Swing traders and day traders often need to monitor "Big Picture" Daily Moving Averages (like the Daily 200 SMA or Daily 50 EMA) while executing trades on lower timeframes like the 15m or 1H. This tool automates that process, ensuring the major trend context is always visible without cluttering the indicator list.
Key Features:
Multi-Timeframe Engine: By default, all MAs are calculated on the Daily ("D") timeframe, regardless of the chart's current timeframe. This creates a stable "anchor" for trend analysis. The timeframe is fully customizable in the settings (e.g., set to "W" for Weekly analysis).
10 Customizable Slots: Toggle up to 10 different Moving Averages on/off individually.
Flexible Calculation Types: Supports SMA, EMA, WMA, VWMA, RMA (SMMA), and SWMA for every single line.
Trend Cloud Crossovers: Includes two dedicated "Cloud" setups to visualize crossovers (e.g., Golden Cross or Death Cross) with fill shading between the fast and slow lines.
Price Action Crossovers: Optional markers to highlight when the closing price crosses specific MAs.
Contextual Levels: Includes Previous Day High (PDH) and Previous Day Low (PDL) markers for immediate intraday support/resistance context.
How to Use:
Settings: Open the settings menu to select your "Indicator Timeframe" (Default: Daily).
Customization: Enable only the MAs relevant to your strategy (e.g., Enable MA 8 for the 50 SMA and MA 10 for the 200 SMA).
Clouds: Use the "Crossover Set" inputs to define a Bullish/Bearish trend cloud between two moving averages of your choice.
Technical Note: This script uses request.security with lookahead=barmerge.lookahead_off to ensure no repainting of historical data while providing accurate higher-timeframe values on closed bars.
Credits: Standard Moving Average calculations based on TradingView built-in functions.
