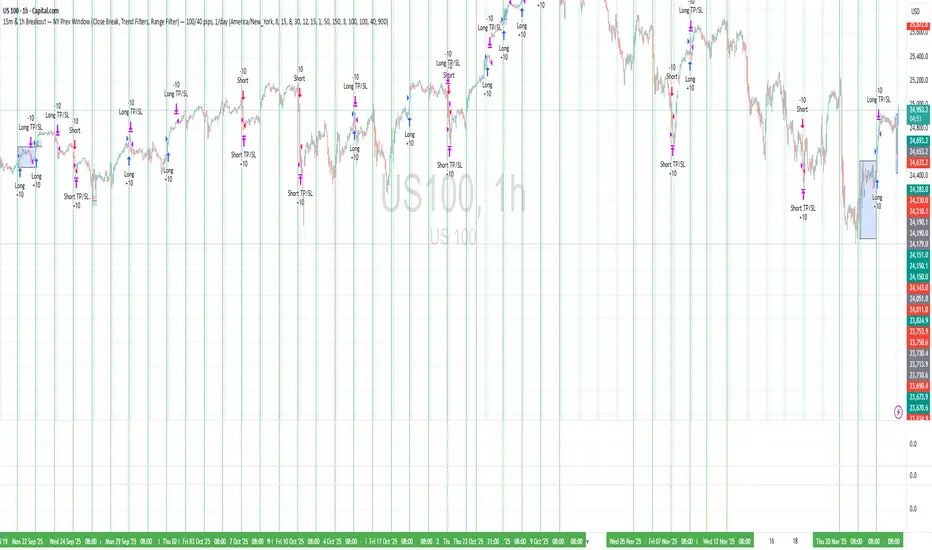
15m & 1h Breakout — NY Prev Window Define a session anchored at 09:15 New York time, adjusted safely around weekends.
For each new session, store the high and low of the previous session’s 09:15→09:15 window.
During a configurable entry window (default: 09:30–11:15 NY time), watch for close-based breakouts:
Long when price closes above the previous window high + buffer.
Short when price closes below the previous window low − buffer.
Take exactly one trade per session, with fixed TP/SL in pips, and optional:
EMA trend filters for longs and shorts.
Range (volatility) filter on the previous window.
Option to skip Thursdays.
The strategy is designed mainly for intraday timeframes (e.g. 15m / 1h), but the logic is timeframe-agnostic.
移動平均線
HMA+RVOL Strategy Hariss 369The Hull Moving Average (HMA) is a smooth, fast, and highly responsive moving average created by Alan Hull. It reduces lag significantly while still maintaining smoothness, making it one of the most popular tools for trend detection and entries. It is widely used for trend filter. Hull Moving Average(HMA) with RVOL strengthens the trend as volume is prime factor of price movement.
Trading with HMA: Simple method is buy when price closes above HMA , stop less below the low of last candle and target is 1.5 or 2 times of stop loss. The reverse is for sell. The HMA automatically turns to green on bull trend and red on bear trend for better visual confirmation.
Adding RVOL to HMA is better method of trading. Buy signal is initiated when price closes above HMA and RVOL is greater than 1.2. Sell signal is initiated when price closes below 89 HMA and rovl is greater than 1.2. One can change the value of RVOL according to trading style and type asset being traded.
It is a back tested strategy.

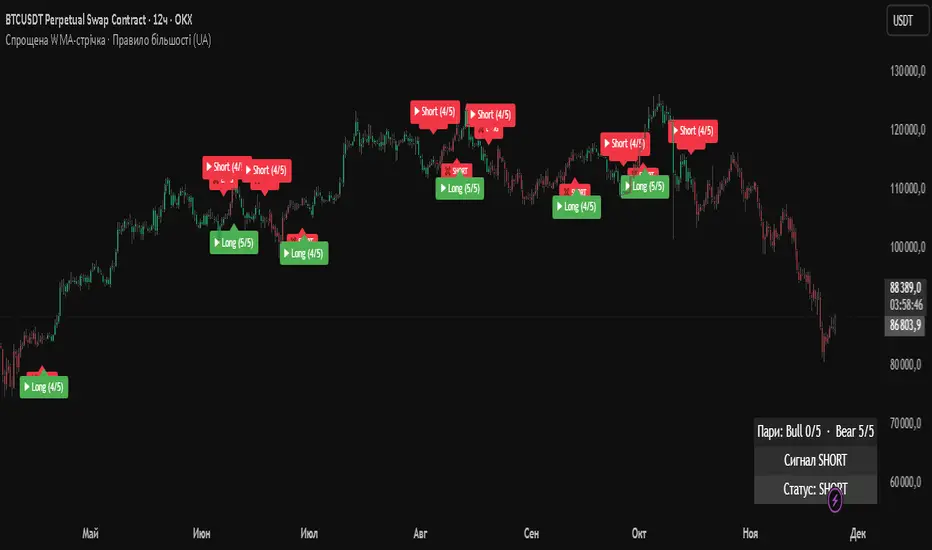
Simplified WMA Ribbon · Majority Rule StrategyThis strategy is a simplified WMA-ribbon “majority rule” system. It compares five fast WMAs (10–30) with five slow WMAs (70–90) and counts how many bullish or bearish pairs are strongly separated by a small ε-buffer. A long (short) position is opened only when a bullish (bearish) majority is reached and closed when that majority weakens or an opposite majority appears. Position size is calculated from a fixed USD amount and leverage, candles are colored by current position, and a mini dashboard shows the number of bullish/bearish pairs and the current status (LONG / SHORT / FLAT).
Inyerneck Sniper Engine v4.2 — FINAL WORKING 2025Aggressive momentum sniper for pennies. Fires on volume + EMA snaps. Use small size. Alerts ready.

Anchor SafeSwing Gold StrategyOverview:
The Anchor SafeSwing Gold Strategy is designed for users who prefer structured, rule-based swing trading on XAUUSD. It focuses on identifying high-quality trade setups rather than frequent entries.
This strategy analyzes the market using multiple technical indicators and methods—including trend analysis, multi-chart confirmation, and support/resistance evaluation—to identify potential swing points. It also incorporates a dynamic approach to risk management through adaptive stop-loss and take-profit logic.
How the Strategy Works
1. Multi-Chart & Trend Analysis:
The strategy evaluates trend direction using several indicators and multiple charts. This helps determine whether the trend favors long or short setups.
2. Buy/Sell Conditions:
a. Buy Conditions: When the broader trend is identified as bullish, the strategy waits for the formation of a strong support zone before considering a long position.
b. Sell Conditions: When the trend is bearish, it waits for a confirmed resistance zone before initiating short positions.
3. Dynamic Take-Profit Logic
The strategy uses adaptive take-profit behavior based on evolving market conditions. It monitors new support/resistance structures and various overbought/oversold signals to dynamically exit trades.
4. Dynamic and Configurable Stop-Loss:
A flexible stop-loss system adjusts according to volatility and market structure.
Users can modify the stop-loss threshold in the settings based on their own risk tolerance and account size.
Trading Frequency :
This strategy focuses on select, high-quality setups. As a result, trade frequency is relatively low and may vary depending on market conditions. Backtesting may show roughly several trades per month, but actual live performance can differ.
Important Notes
All trading involves risk, and users should evaluate the strategy and adjust settings according to their own risk management preferences.

Inyerneck Sniper Engine v4.2 — FINAL WORKING 2025yer momUltra-aggressive momentum sniper built for pennies & BTC.
Fires on every volume explosion + EMA snap. No mercy, no filters.
50+ trades per month. Use small size or die trying.
Private alpha —

Inyerneck Sniper Engine v4.2 — FINAL WORKING 2025Ultra-aggressive momentum sniper built for pennies & BTC.
Fires on every volume explosion + EMA snap. No mercy, no filters.
50+ trades per month. Use small size or die trying.
Private alpha — invite-only. do not change settings without first recording default settings, the default settings are great... usable on any time frame.. aaaaannd... yer mom!

Gold_Strategy_EMA_TradingProEC_v1.4We are pleased to announce a significant update to the execution logic of the Gold Breakouts Strategy, focusing on improved precision and reliability of trade signals.
📝 Summary of Key Changes
This version resolves the critical issue of duplicate or redundant trade entries that were being generated on the same bar when the EMA crossover condition was triggered. This caused unnecessary confusion in signal notifications and trade execution.
⚙️ Detailed Technical Implementation
Elimination of Redundant Code: We have successfully removed the conflicting entry logic block that previously attempted to execute trades using Pivot levels for Take Profit calculation. By doing this, we eliminate the source of the double entry problem.
Consolidated Execution Logic: The strategy now relies on a single, unified execution block. This block exclusively utilizes the robust Fixed TP/SL Ratio calculation as defined in the strategy inputs.
Enhanced Flow Control: We improved the conditional flow by using else if for the sell condition (else if cond_venta) immediately following the buy condition (if cond_compra). This vital change guarantees that if a Buy signal is processed on a given bar, the Sell signal logic is skipped entirely, making the execution flow more exclusive and robust against rapid market movements.
✅ User Impact and Benefits
Single, Clear Notifications: Users will now receive only one definitive entry notification per signal (either 'sell' or 'buy') at a time. This allows for immediate and confident decision-making.
Reliable Trade Execution: The strategy is now significantly more dependable, ensuring that the Stop Loss and Take Profit levels are set correctly and consistently based on the defined risk ratio immediately upon entry.

Safe Supertrend Strategy (No Repaint)Overview
The Safe Supertrend is a repaint-free version of the popular Supertrend trend-following indicator.
Most Supertrend indicators appear perfect on historical charts because they flip intrabar and then repaint after the candle closes.
This version fixes that by using close-of-bar confirmation only, making every trend flip 100% stable, safe, and non-repainting.
Why This Supertrend Doesn’t Repaint
Most Supertrend indicators calculate their trend direction using the current bar’s data.
But during a live candle:
ATR expands and contracts
The upper/lower bands move
Price moves above/below the band temporarily
A false flip appears → then disappears when the candle closes
That is classic repainting.
This indicator avoids all of that by using:
close > upper
close < lower
This means:
Trend direction flips only based on the previous candle,
No intrabar calculations,
No flickering signals,
No “perfect but fake” historical performance.
Every signal you see on the chart is exactly what was available in real-time.
How It Works
Calculates ATR (Average True Range) and SMA centerline
Builds upper and lower volatility bands
Confirms trend flips only after the previous bar closes
Plots clear bull and bear reversal signals
Works on all markets (crypto, stocks, forex, indices)
No repainting, no recalc, no misleading flips.
Bullish Signal (Trend Up)
A bullish trend begins only when:
The previous candle closes above the upper ATR band,
And this flip is fully confirmed.
A green triangle marks the start of a new uptrend.
Bearish Signal (Trend Down)
A bearish trend begins only when:
The previous candle closes below the lower ATR band,
And the downtrend is confirmed.
A red triangle signals the start of a new downtrend.
Inputs
ATR Length - default 10
ATR Multiplier - default 3.0
Works on all timeframes and market
Simple, but powerful.
Why Use This Version Instead of a Regular Supertrend?
Most Supertrends:
Look great historically
But repaint continuously on live charts
Give false trend flips intrabar
Cannot be reliably used in strategies
This version:
Uses strict previous-bar logic
Never repaints trend direction
Works perfectly in live trading
Backtests accurately
Is ideal for algorithmic strategies
Ideal For:
Trend-following strategies
Breakout trading
Algo trading systems
Reversal detection
Filtering market noise
Swing trading & scalping
Final Note
This is a safer, more reliable Supertrend designed for real-world use — not perfect-looking repaint illusions.
If you use Supertrend in your trading system, this no-repaint version ensures your signals are trustworthy and consistent.

XRP CrossChain Momentum EngineThis is a strategy with stop loss 3% , leverage 4 and no pyramiding. It works great with XRP and other coins with similar price, but i suggest XRP. Profit in 1 year around 900% and profit in 2 years around 2000% as you can see in the pictures. I have initial capital 1000 but it can change.

Optimized EMA Ribbon Strategy v6 Based on EMA rotations, ADX we create a system of entering trades. Watch out for the sell and buy signals.

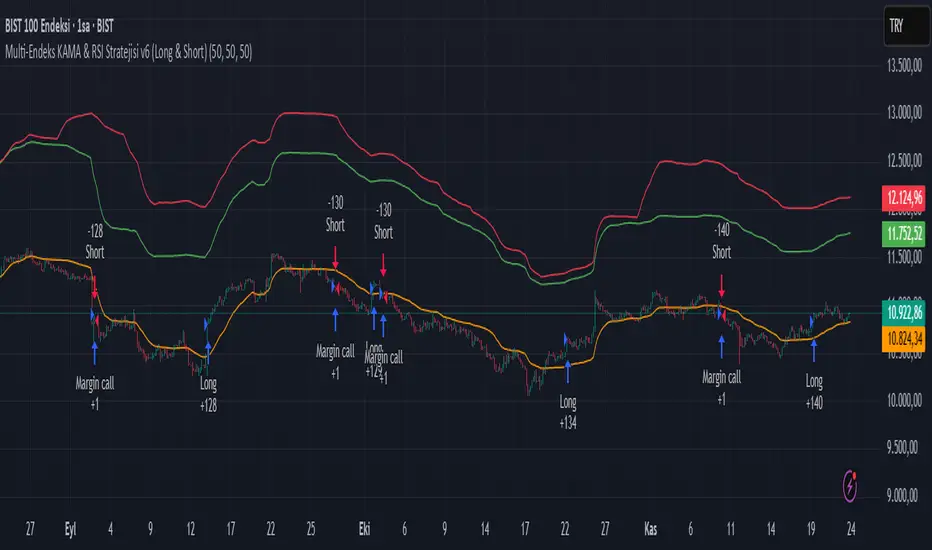
Multi-Endeks KAMA & RSI Stratejisi v6 (Long & Short)Multi-Index KAMA & RSI Strategy v6 (Long & Short)
This is a hybrid trading strategy that combines two powerful technical analysis tools—the Kaufman's Adaptive Moving Average (KAMA) for trend following and the Relative Strength Index (RSI) for measuring momentum and identifying overbought/oversold conditions.
The term "Multi-Index" suggests that the decision-making process might incorporate data or conditions from several different market indices or timeframes, rather than just the single asset being traded.
🧭 Core Components
1. KAMA (Kaufman's Adaptive Moving Average)
KAMA is an adaptive moving average developed by quantitative financial theorist Perry J. Kaufman.
Adaptivity: Unlike standard moving averages, KAMA automatically adjusts its smoothing factor (speed) based on market volatility.
Mechanism:
Trending Markets (Low Noise): When prices move clearly in one direction (low volatility), KAMA speeds up, hugging the price closely and providing fast signals.
Sideways Markets (High Noise): When prices are choppy (high volatility/noise), KAMA slows down, smoothing out price fluctuations to reduce the risk of whipsaws (false signals).
Role in Strategy: To define the main trend direction. The position of the price relative to the KAMA line determines the base directional bias (Long or Short).
2. RSI (Relative Strength Index)
RSI is a momentum oscillator developed by J. Welles Wilder Jr. that measures the speed and change of price movements.
Overbought/Oversold: It oscillates between 0 and 100. Conventionally, a reading above 70 suggests overbought conditions (potential sell signal), and a reading below 30 suggests oversold conditions (potential buy signal).
Role in Strategy: Timing and Confirmation. Once the trend is confirmed by KAMA, the RSI acts as a timing filter, often confirming an entry as it moves away from extreme overbought (for Short) or oversold (for Long) levels.
📉 Potential Trading Logic (V6)
This "v6" strategy likely aims to capture more reliable entries by requiring both trend (KAMA) and momentum (RSI) alignment:
1. LONG (Buy) Entry Conditions
Trend Confirmation (KAMA): The asset's price (Closing Price) must be above the KAMA line (confirming an uptrend).
Momentum Confirmation (RSI):
Option A (Reversal): The RSI must cross above the 30 level (exiting oversold) or decisively move above the 50 level.
Option B (Trend-Continuation): In a strong uptrend, the RSI might bounce off the 40-50 zone and turn upwards, confirming trend continuation.
2. SHORT (Sell) Entry Conditions
Trend Confirmation (KAMA): The asset's price (Closing Price) must be below the KAMA line (confirming a downtrend).
Momentum Confirmation (RSI):
Option A (Reversal): The RSI must cross below the 70 level (exiting overbought) or decisively move below the 50 level.
Option B (Trend-Continuation): In a strong downtrend, the RSI might be rejected from the 50-60 zone and turn downwards, confirming continuation.
3. Exit Management
The strategy likely utilizes dynamic risk controls:
Stop-Loss: A dynamic stop placed on the opposite side of the KAMA, or an ATR-based distance to adjust to volatility.
Take-Profit: Conditions such as the RSI reaching extreme levels or the KAMA line being crossed in the reverse direction.
🌟 Implication of the "V6" Version
The "v6" designation implies that the strategy has been refined and iterated upon over time to address weaknesses in prior versions (v1, v2, etc.). These improvements might include:
Filters: Adding stricter RSI or KAMA cross filters to reduce false signals.
Multi-Index Logic: Using the RSI or KAMA of a secondary instrument (e.g., a major index or volatility measure) as a macro filter for the main trade execution.
Optimization: Optimizing the default lookback periods for KAMA and RSI for different asset classes.
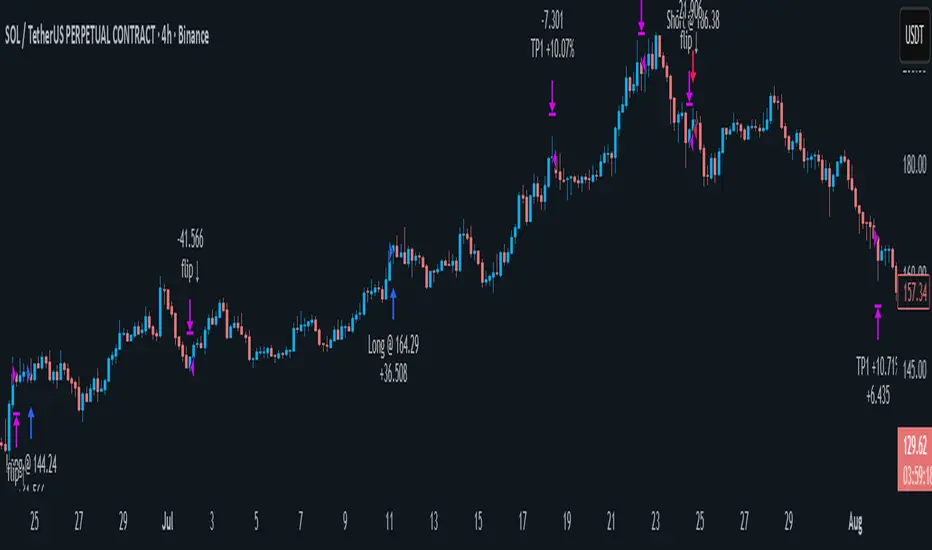
EMA Velocity Dual TF Momentum 1h (v2)BINANCE:SOLUSDT
The result is calculated on futures x10
### EMA Velocity Dual TF Momentum (v2) – Public Description
**Overview**
EMA Velocity Dual TF Momentum (v1) is a trend-following momentum strategy that uses the *speed of change* of Exponential Moving Averages (EMA) on two timeframes: the chart timeframe 1h.
The strategy looks for moments when both timeframes point in the same direction and the short‑term momentum is significantly stronger than usual, then manages trades with configurable ATR filtering, stop‑loss / take‑profit and early exit logic.
---
### Core Idea (high level, without formulas)
- On the **lower timeframe** (LTF), the strategy tracks how fast the EMA is moving (its “velocity”) and detects **impulse bars** where this velocity is unusually strong compared to its recent history.
- On the **higher timeframe** (HTF), it also measures EMA velocity and requires that the HTF trend direction is **aligned** with the LTF (both bullish or both bearish), if enabled.
- A **long trade** is opened when:
- LTF EMA velocity is positive (upward momentum),
- LTF momentum is strong enough (impulse),
- HTF EMA velocity is also upwards (if HTF filter is enabled),
- and ATR‑based volatility is above the minimum threshold.
- A **short trade** is opened in the symmetric situation (downward momentum on both timeframes).
- Positions are closed using configurable stop‑loss and take‑profit, and can be partially exited, moved to break‑even and trailed using early‑exit options.
---
### Inputs and Parameters
#### Trend & Momentum (Lower Timeframe)
- **`LTF EMA length (emaLenLTF)`**
Length of the EMA on the chart timeframe used to measure short‑term trend and momentum. Smaller values react faster; larger values are smoother and slower.
- **`LTF velocity lookback (velKLTF)`**
Lookback for computing EMA “velocity” on LTF. Controls how sensitive the momentum calculation is to recent price changes.
- **`LTF impulse lookback bars (impLookback)`**
Window size used to estimate the “normal” average absolute velocity. The strategy compares current momentum against this baseline to detect strong impulse moves.
- **`LTF |velocity| multiplier vs average (impMult)`**
Multiplier for defining what counts as a strong impulse. Higher values = fewer but stronger signals; lower values = more frequent, weaker impulses.
#### Trend & Momentum (Higher Timeframe)
- **`Use higher timeframe alignment (useHTF)`**
If enabled, trades are only taken when the higher‑timeframe EMA velocity confirms the same direction as the lower timeframe.
- **`HTF timeframe (htf_tf)`**
Higher timeframe used for confirmation (e.g. 60 minutes). Defines the “macro” context above the chart timeframe.
- **`HTF EMA length (emaLenHTF)`**
Length of the EMA on the higher timeframe. Controls how smooth and slow the higher‑timeframe trend filter is.
- **`HTF velocity lookback (velKHTF)`**
Lookback for the EMA velocity on HTF. Smaller values react quicker to changes in the higher‑timeframe trend.
#### Volatility / ATR Filter
- **`Use ATR filter (useAtrFilter)`**
Enables a volatility filter based on Average True Range. When active, trades are allowed only if market volatility is not too low.
- **`ATR Period (atrPeriod)`**
Lookback period for ATR calculation. Shorter periods react faster to recent volatility shifts; longer ones are more stable.
- **`ATR Min % for trading (atrMinPerc)`**
Minimum ATR as a percentage of price required to trade. Filters out very quiet, choppy periods where the strategy is more likely to be whipsawed.
#### Risk Management
- **`Use stops (SL/TP) (useStops)`**
Enables fixed stop‑loss and take‑profit exits. If disabled, positions are managed only by early exit logic and manual closing.
- **`Stop Loss % (stopLossPerc)`**
Distance of the protective stop from entry, in percent. Higher values give trades more room but increase risk per trade.
- **`Take Profit % (takeProfitPerc)`**
Distance of the primary profit target from entry, in percent. Controls the reward‑to‑risk profile of each trade.
#### Early Exit / Break‑Even / Trailing
- **`Enable early exit module (useEarlyExit)`**
Master switch for all early exit features: partial profit taking, break‑even stops and trailing exits.
- **`Take partial profit at +% (close 50%) (partialTP)`**
Profit level (in %) at which the strategy closes a partial portion of the position (e.g. 50%), locking in gains while leaving a runner.
- **`Trailing TP distance (%) (trailTP)`**
Distance (in %) for dynamic trailing stop after entry. When positive, the strategy trails the price to protect profits as the move extends.
- **`Break-even stop after +% profit (useBreakEven)`**
Enables automatic move of the stop to the entry price once a certain profit threshold is reached.
- **`Break-even activation (+%) (breakEvenPerc)`**
Profit level (in %) at which the stop is moved to break‑even. Higher values require a larger unrealized profit before break‑even protection kicks in.
#### Visuals
- **`Show labels (showLabels)`**
Toggles on‑chart labels that mark long and short entry signals for easier visual analysis.
- **`Label offset (labelOffset)`**
Horizontal offset (in bars) for placing labels relative to the signal bar. Used only for visual clarity; does not affect trading logic.
---
Если нужно, могу на основе этого текста сразу подготовить компактную версию (ограниченную по символам) специально под поле описания публичного скрипта в TradingView.

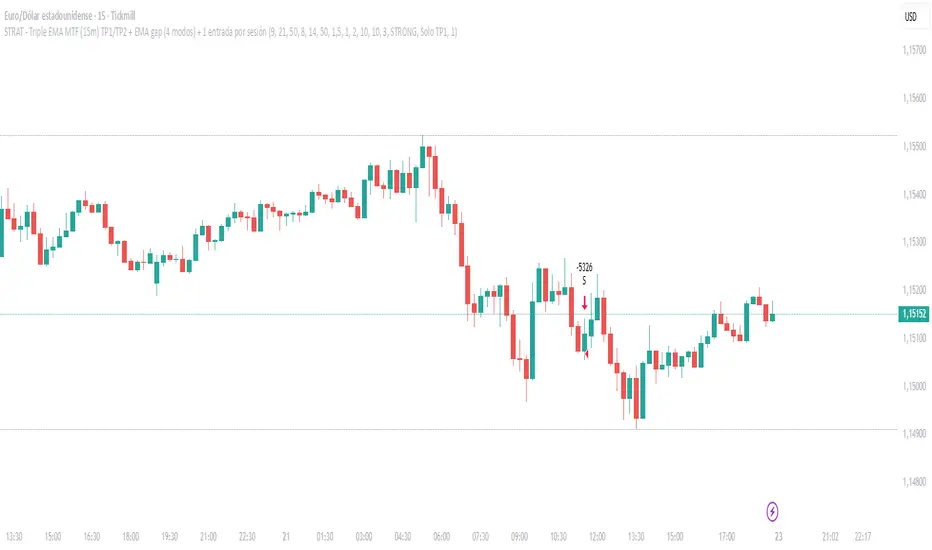
EMA Velocity Volatility Clamp (v1)A strategy based on the rate of price change using EMA.
Configured for the 5M Solana.
BINANCE:SOLUSDT

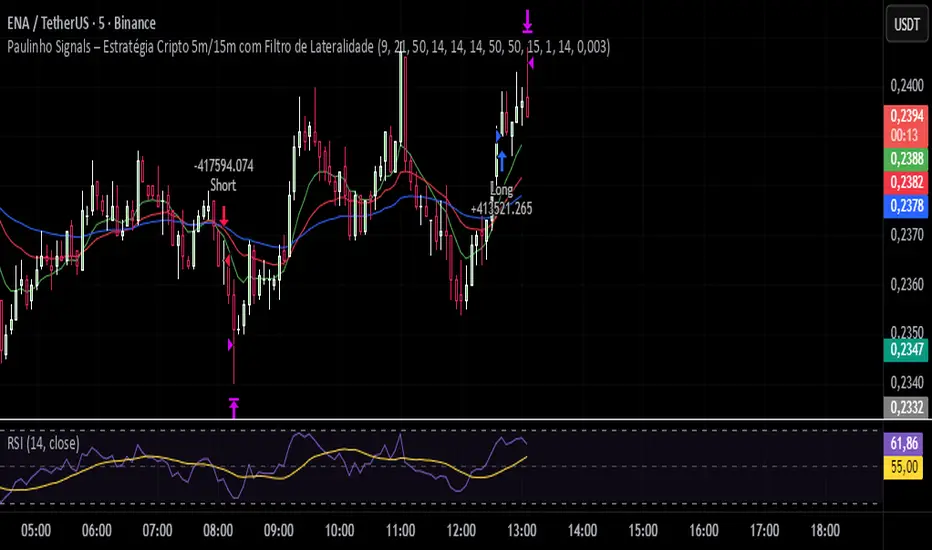
Paulinho Signals – Cripto 5m/15m com Filtro de LateralidadeThis script is an automated Pine Script v6 strategy designed for short-term cryptocurrency trading, especially on 5-minute and 15-minute timeframes. It combines moving average crossovers, trend strength (ADX), volatility (ATR), and candlestick patterns to generate buy and sell signals with a fixed risk/reward management system.
How to Use:
- Apply to cryptocurrency charts on 5m or 15m timeframes.
- Adjust parameters to fit your preferences (EMA, RSI, ADX, ATR).
- Use for backtesting or as a decision-support tool.
Disclaimer:
This script is for educational purposes only and does not constitute financial advice. Always test on demo accounts before applying to live trading.
SMC Trend Filter Strategy (EMA50/EMA200 + FVG)Overview
This strategy implements a multi-timeframe Smart Money Concept (SMC) trading system designed for intraday and swing trading.
It combines a Daily trend filter, Break of Structure (BOS) detection, Order Block (OB) zones, Fair Value Gap (FVG) confirmation, and an ATR-based trailing stop system to achieve structured and rule-based entries.
The strategy is fully automated for backtesting and allows users to evaluate SMC concepts without repainting or discretionary interpretation.
- Core Components
1. Higher-Timeframe Trend Filter (Daily EMA50/EMA200)
The strategy retrieves D1 data and determines market direction using EMA50 and EMA200:
Uptrend → EMA50 > EMA200
Downtrend → EMA50 < EMA200
Trades are only taken in the direction of the Daily trend to avoid counter-trend setups.
2. Market Structure & Break of Structure (BOS)
The strategy identifies swing highs/lows and detects when price breaks beyond them:
Bullish BOS: price closes above previous swing high
Bearish BOS: price closes below previous swing low
This forms the foundation of SMC market structure recognition.
3. Order Block Zone (OB)
Upon detecting a BOS, the strategy marks the previous candle as a potential Order Block:
For bullish BOS → OB = previous candle’s high/low
For bearish BOS → OB = previous candle’s high/low
The OB zone is visualized using a semi-transparent box extended forward

Aquas TrendIt’s a trend-following crossover system with:
A local fast/slow EMA cross for timing entries
A higher-timeframe EMA filter to only trade in the dominant trend
An ATR-based volatility filter so it only trades when the market is moving
ATR-based stop loss and take profit with fixed RR
It tries to catch swings in the direction of the larger trend and ignore chop.
AlgomaticPro - Trend Sniper (BTC, ETH, SOL) 4H timeframeBest performing coins - BTC, ETH, SOL, ADA, DOGE, AVAX, DOT, NEAR, VET, KAS
Best Performing timeframe - 4H
Vital Wave 20-50Simplicity is almost always the most effective approach, and here I’m giving you a trend-following system that exploits the bullish bias of traditional markets and their trending nature, with very basic rules.
Rules (long entries only)
• Market entry: When the EMA 20 crosses above the EMA 50 (from below)
• Main market exit: When the EMA 20 crosses below the EMA 50 (from above)
• Fixed Stop Loss: Placed at the price level of the Lower Bollinger Band at the moment the trade is entered.
In my strategy, the primary exit is when the EMA 20 crosses below the EMA 50. However, this crossover can sometimes take a while to occur, and in the meantime the price may have already dropped significantly. The Stop Loss based on the Lower Bollinger Band is designed to limit losses in case the market moves sharply against the position without giving the bearish crossover signal in time. Having two exit conditions makes the strategy much more robust in terms of risk management.
Risk Management:
• Initial capital: $10,000
• Position size: 10% of available capital per trade
• Commissions: 0.1% on traded volume
• Stop Loss: Based on the Lower Bollinger Band
• Take Profit / Exit: When EMA 20 crosses below EMA 50
Recommended Markets:
XAUUSD (OANDA) (Daily)
Period: January 3, 1833 – November 23, 2025
Total Profit & Loss: +$6,030.62 USD (+57.57%)
Maximum Drawdown: $541.53 USD (3.83%)
Total Trades: 136
Winning Trades (Win Rate): 36.03% (49/136)
Profit Factor: 2.483
XAUUSD (OANDA) (12-hour)
Period: March 19, 2006 – November 23, 2025
Total Profit & Loss: +$1,209.56 USD (+11.89%)
Maximum Drawdown: $384.58 USD (3.61%)
Total Trades: 97
Winning Trades (Win Rate): 35.05% (34/97)
Profit Factor: 1.676
XAUUSD (OANDA) (8-hour)
Period: March 19, 2006 – November 23, 2025
Total Profit & Loss: +$1,179.36 USD (+11.81%)
Maximum Drawdown: $246.88 USD (2.32%)
Total Trades: 147
Winning Trades (Win Rate): 31.97% (47/147)
Profit Factor: 1.626
Tesla (NASDAQ) (4-hour)
Period: June 29, 2010 – November 23, 2025
Total Profit & Loss (Absolute): +$11,687.90 USD (+116.88%)
Maximum Drawdown: $922.05 USD (6.50%)
Total Trades: 68
Winning Trades (Win Rate): 39.71% (27/68)
Profit Factor: 4.156
Tesla (NASDAQ) (3-hour)
Total Profit & Loss: +$11,522.33 USD (+115.22%)
Maximum Drawdown: $1,247.60 USD (8.80%)
Total Trades: 114
Winning Trades: 33.33% (38/114)
Profit Factor: 2.811
Additional Recommendations
(These assets have shown good trending behavior with the same strategy across multiple timeframes):
• NVDA (15 min, 30 min, 1h, 2h, 3h, 4h, 6h, 8h, 12h, Daily)
• NFLX (1h, 2h, 3h, 4h, 6h, 8h, 12h, Daily)
• MA (1h, 2h, 3h, 4h, 6h, 8h, 12h, Daily)
• META (1h, 2h, 3h, 4h, 6h, 8h, 12h, Daily)
• AAPL (1h, 2h, 3h, 4h, 6h, 8h, 12h, Daily)
• SPY (12h, Daily)
About the Code
The user can modify:
• EMA periods (20 and 50 by default)
• Bollinger Bands length (20 periods)
• Standard deviation (2.0)
Visualization
• EMA 20: Blue line
• EMA 50: Red line
• Green background when EMA20 > EMA50 (bullish trend)
• Red background when EMA20 < EMA50 (bearish trend)
Important Note:
We can significantly increase the profit factor and overall profitability by risking a fixed percentage per trade instead of a fixed amount. This would prevent losses from fluctuating with changes in volatility.
This could be implemented by reducing position size or adjusting leverage based on the volatility percentage required for each trade, but I’m not sure if this is fully possible in Pine Script. In my other script, “ Golden Cross 50/200 EMA ,” I go deeper into this topic and provide examples.
I hope you enjoy this contribution. Best regards!

Hull VWMA Crossover StrategyA simple variation on the Hull Moving Average which reacts faster to high volume events, making it more responsive in those cases than even the standard Hull average -- CREDIT GOES TO Saolof - -- Edited into a strategy with some more options that im going to continue to refine. LMK if theres any features or confluence you want me to add -- cheers!

EMA + RSI Forex StrategyHere is a complete and ready-to-use Pine Strategy Script v5 trading strategy. It’s designed for forex pairs and uses combination of EMA crossover and RSI confirmation to identify high-probability entries. The script includes backtesting capability and adjustable parameters for optimization.