LiquidTradeRoom Auto Zones1. Finds Swing Highs and Swing Lows
It looks for pivot highs and lows using a user-chosen length.
Swing highs = possible supply
Swing lows = possible demand
These swings help the indicator understand the market structure.
2. Automatically Creates Supply & Demand Zones
When a new swing high or low is found:
🔴 Supply zone (after a swing high)
Draws a box above price
Slight buffer added using ATR
Extends the box forward to the right
🔵 Demand zone (after a swing low)
Draws a box below price
ATR buffer
Extends the box to the right
The boxes act as “areas price may react from.”
3. Stops Overlapping Zones
Before creating a new zone, the script checks:
If the new zone is too close to an existing one → it does not draw it.
This avoids clutter & duplicate zones.
4. Draws POI Labels
Within each supply/demand box it draws a small “POI” label showing the midpoint.
This marks the "most important part" of the zone.
5. Marks BOS (Break of Structure) Automatically
If price breaks above a supply zone top or below a demand zone bottom, the indicator:
Converts that zone into a BOS marker
Draws a line showing where structure was broken
Removes the old supply/demand box
This helps identify trend changes.
6. Extends Active Zones
Existing zones are constantly pushed further right so they stay visible on the chart.
7. Optional Zig-Zag
The script can draw a zig-zag line to help visualize:
Higher highs
Higher lows
Lower highs
Lower lows
But you can turn it on or off.
8. Optional Swing Labels
If enabled, it prints:
HH (Higher High)
HL (Higher Low)
LH (Lower High)
LL (Lower Low)
This visually shows market structure.
✨ In summary
This script automatically builds a full “Smart Money Concepts” structure map including:
✔ Swing points
✔ Supply & demand zones
✔ POIs
✔ Break of structure (BOS)
✔ Zig-zag structure
✔ Market structure labels (HH, HL, LH, LL)
移動平均線

Sniper PRO: The "Institutional X-Ray" [Visual Trend System]"The stock market is a device for transferring money from the impatient to the patient." — Warren Buffett
Stop gambling. Stop guessing. Start hunting.
Most traders get slaughtered because they look at Price. The top 1% make fortunes because they look at Money Flow.
Sniper PRO gives you that unfair advantage. It is a complete, visual trading system designed to act as an "Institutional X-Ray" for your charts. It ignores the retail noise and tracks the only thing that moves markets: Big Institutional Volume.
🔥 Why is this the "Holy Grail" for Swing Traders?
You know that feeling when you get stopped out, only to watch the stock rocket to the moon without you? It ends today.
This system introduces the "VFI Absolute Shield" technology.
The Secret: Even if price breaks your support, the algorithm checks the Dark Pools and Institutional Volume.
The Result: If the Whales are still holding, The Shield holds. You stay in the trade while everyone else panics. This is how you catch the 100%+ runners.
🦁 Visual Beast Mode: What you see
We stripped away the confusing numbers and gave you a Heads-Up Display (HUD):
The Trend Snake 🐍
The EMA 50 comes alive. It changes color dynamically.
Lime Green: Bull Market (Accumulation).
Blood Red: Bear Market (Distribution).
Blue/Orange: Stay Away (The Trap Zone).
Smart Signals (No Repaint)
🚀 Rocket: High-confidence Long entry confirmed by volume.
🩸 Drop: High-confidence Short entry (or hedge).
💀 Skull Markers: Honest, transparent loss markers so you can learn from every move.
The "Sleep Well" Stop Loss
See that dotted line? That’s your safety net.
When the 🛡️ SHIELD icon appears, you know you are protected by Smart Money flow, even if the price dips.
🏆 How to trade like a Hedge Fund
Timeframes: Best on 1H, 4H, Daily (Swing Trading).
Assets: Optimized for Stocks (NVDA, TSLA, AAPL) & Crypto (BTC, ETH).
Strategy: Wait for the Snake to turn Green + Rocket signal. Ride it until the Shield breaks.
Stop being the liquidity. Be the Sniper.
Disclaimer: This is a powerful analysis tool. Always manage your risk.

20 EMA from 5m & 60m This indicator displays the 20-period EMA calculated from higher timeframes while trading on the 1-minute chart.
It plots:
20 EMA from the 5-minute timeframe
20 EMA from the 60-minute timeframe
🔍 Purpose
This tool is designed for intraday scalpers who want to track key trend EMAs from higher timeframes without leaving the 1-minute chart.
It helps quickly identify:
Trend direction (short-term and mid-term)
Dynamic support/resistance levels
Reversal and continuation conditions

EMA + RSI Signal ProKey Features & Logic:
Market Structure Analysis:
Detects bullish and bearish trends based on market structure.
Suggests LONG trades in bullish trends and SHORT trades in bearish trends.
EMA Cross Confirmation:
Signals potential changes in trend momentum using fast and slow EMA crossovers.
Adds an extra layer of confirmation before entering a trade.
RSI Overbought/Oversold Filter:
Ensures entries only occur under optimal conditions:
Buy signals trigger only when the market is oversold.
Sell signals trigger only when the market is overbought.
This reduces false signals and increases the probability of success.
Clear Entry Signals:
Buy and Sell signals are displayed as labels directly on the chart, making them easy to follow.
Optional alert notifications can be set up for instant trade alerts.
Customizable Settings:
Adjustable EMA periods
Adjustable RSI length and overbought/oversold thresholds
Optional trend filtering for even more precise entries
Why this indicator is different:
Unlike basic EMA crossover or RSI indicators, this tool combines three layers of confirmation:
Trend direction from market structure
Momentum change via EMA cross
Optimal entry conditions via RSI
This makes it a complete trading decision tool suitable for Forex, Stocks, Crypto, and other markets.
Disclaimer:
This indicator is for educational purposes only and does not guarantee profits. Always use proper risk management.

MTF Step EMA With ColorMTF Stepped EMA – Dynamic & Color-Coded (Green / Red / Yellow)
This indicator plots a higher-timeframe EMA as a stepped line (staircase style) directly on your current chart, with smart dynamic coloring:
- Green → The stepped EMA is actively rising (higher highs in the staircase) → bullish higher-timeframe momentum
- Red → The stepped EMA is actively falling (lower lows in the staircase) → bearish higher-timeframe momentum
- Yellow → The EMA has been flat (no new step) for a user-defined number of bars → consolidation / range phase
Features
• Fully dynamic – updates instantly when the higher-timeframe EMA changes
• Clean step-line style (plot.style_stepline) – no diagonal lines, pure staircase
• Automatic color switching based on the actual direction of the last step
• Yellow "flat" detection after X bars without movement (customizable)
• Thin reference line of the original smooth higher-timeframe EMA (optional)
• Very lightweight and repaints-free (uses proper request.security)
How to use
• Classic setup: Daily or Weekly EMA 50/200 on 1H or 4H charts
• Green steps → look for longs in lower timeframes
• Red steps → look for shorts
• Yellow → caution or stay out – higher timeframe is ranging
Perfect for multi-timeframe trend confirmation, pullback trading, and avoiding choppy markets.
Enjoy & trade safe!

Veil Trend# Veil Trend (VTrend)
**Veil Trend** is a minimalist trend-following and volatility framework built around a triple-EMA structure and adaptive price bands. It is designed to clearly define trend direction, dynamic support and resistance, and momentum expansion—without clutter.
---
## 🔹 Core Components
### Main EMA (Slow)
Acts as the primary trend axis.
- Price **above** the main EMA → bullish bias
- Price **below** the main EMA → bearish bias
### Medium EMA
Tracks intermediate momentum and trend strength, helping visualize pullbacks within the broader trend.
### Fast EMA (Optional)
Provides short-term momentum sensitivity and early trend shifts.
Hidden by default to maintain a clean chart.
---
## 🔹 Adaptive Veil Bands
Veil Trend wraps the main EMA with adaptive volatility bands (“the veil”) to define normal price movement versus expansion.
- **ATR-Based Bands (Default)**
Bands automatically expand and contract with volatility, adapting to changing market conditions.
- **Percentage-Based Bands (Optional)**
Bands are offset by a fixed percentage from the main EMA, useful for consistent scaling across instruments.
The shaded area between bands represents the **healthy trend zone**, where pullbacks and consolidations typically occur.
---
## 🔹 Signals & Interpretation
*(Disabled by default for a clean visual experience)*
### Band Breaks
- **Break above upper band** → strong bullish momentum
- **Break below lower band** → strong bearish momentum
### Band Bounces
- **Bounce from lower band** → potential bullish continuation
- **Rejection at upper band** → potential bearish continuation
Alerts are included for all band events and can be enabled as needed.
---
## 🔹 Visual Design Philosophy
- Clean, layered EMA structure (“noodles”)
- Subtle volatility bands with optional fill
- Optional status table for quick market context
- Minimalist by default, information-rich when enabled
---
## 🔹 Best Use Cases
- Identifying trend direction and bias
- Trading pullbacks within established trends
- Spotting volatility expansion and breakout conditions
- Works on **stocks, crypto, forex, and indices**
- Effective across all timeframes
---
**Veil Trend doesn’t predict — it reveals.**


LS_mas_V1Itsy Bitsy Spider:
The itsy bitsy spider
Climbed up the water spout.
Down came the rain
And washed the spider out.
Out came the sun
And dried up all the rain.
And the itsy bitsy spider
Climbed up the spout again.
2
Wheels on the Bus:
The wheels on the bus go round and round,
All through the town,
The front wheels go round and

EMA SMA Rhythmic Lite Public V1.0 by SRT📌 EMA SMA Rhythmic Lite Public V1.0 by SRT
A clean, fast, non-repainting trend-rhythm indicator designed for swing traders, reversal reads, and structure-based entries. Built on fixed EMAs + SMAs, it offers Engulfing Bars (EB), Long-Tail Body (LTB) signals, rhythmic Flush Dots, and a real-time Bias Table.
Perfect for traders who want clear directional guidance without clutter or over-optimization.
🔶 Key Features
1. Fixed MA Rhythm Engine
MA1: EMA
MA2: EMA
MA3: SMA
MA4: SMA
Stacking forms the core “trend rhythm” for quick bias reading.
2. Engulfing Bars (EB) — Non-Repainting
Detects previous bar only, filters weak signals using ATR size and minimum body %. Outputs EBull and EBear with 20-label cap.
3. Long-Tail Body (LTB)
Identifies exhaustion/reversal areas with tail % thresholds, body position filters, optional body size filter, and ATR thresholds. Produces LTB Bull and LTB Bear.
4. MA Flush Dots
Rhythmic compression markers: bullish at the bottom, bearish at the top — ideal for spotting MA squeezes and momentum resets.
5. Bias Table (Top-Right)
Compact real-time sentiment showing:
MA Bias (Bullish / Bearish / Neutral)
LTB presence (Yes / No)
🔶 Alerts Included
Signal Bar Formed
Bullish Combo
Bearish Combo
All non-repainting (previous bar logic).
🔶 Ideal For
Swing traders
Trend continuation setups
Reversal exhaustion reads
Structure-based entries
Clean, non-spammy signals
🔶 Premium Version Intro
For traders seeking the full rhythm engine, consider the EMA SMA Rhythmic Trend Premium V1.0 by SRT.
It includes advanced rhythm alerts, enhanced LTB logic, optional EMA/SMA dynamic switching, extra visualization features, and customizable MA stacking, providing a comprehensive toolset for serious trend and reversal strategies.
🔶 Notes
Fully non-repainting
Flush markers, labels, and MA visibility are fully user-controlled
Code is locked to preserve original logic and prevent redistribution
Enjoy the rhythm.
- SRT

RVOL + Volume Z-Score (Textbook)This indicator is a relative-volume and “volume anomaly” dashboard designed to help you quickly spot when a ticker is actually in-play versus simply drifting on normal activity. It plots standard volume bars (colored by up/down candles) and overlays multiple optional smoothers of volume (SMA, LSMA/linear-regression MA, HMA, ALMA) so you can see whether participation is expanding or fading across different smoothing styles. It also calculates RVOL (current bar volume divided by the average volume over a user-defined lookback) and displays RVOL (and Z) in a small table for quick reference.
The core feature is a textbook volume z-score: Z=(V−SMA(V,N))/StDev(V,N)
This measures how far the current bar’s volume is from its recent average in standard-deviation units, making it easy to filter for genuinely unusual volume. The script plots mean + 1σ and mean + 2σ threshold bands and can highlight “anomaly” volume bars when Z exceeds your chosen σ thresholds (default 1σ for broader detection, with alerts available for 1σ/2σ). Use it as a participation filter: combine high RVOL / high Z with your price structure (key levels, VWAP, trend) to validate breakouts or identify high-conviction reversal/flush events.

TH-SixPair Engine v6.3ระบบ Multi-pair EMA + ATR x1.5 สำหรับ XAUUSD, GBPUSD, EURUSD, USDJPY, USDCAD, AUDUSD
– ใช้ EMA 8/21 + EMA เทรนด์ 50 + RSI filter + Session filter
– มีโหมด Pending + Extra Entry (EMA pullback / Swing HL retest / FVG retest)
– จัดการ TP1/TP2 แบบ partial + BE อัตโนมัติ
– มีตารางแสดง SL/TP1/TP2 เป็น USD สำหรับ lot 0.01 และสถิติย้อนหลัง 10 ออเดอร์
แนะนำใช้ TF 1H เป็นหลัก

VV Moving Average Convergence Divergence # VMACDv3 - Volume-Weighted MACD with A/D Divergence Detection
## Overview
**VMACDv3** (Volume-Weighted Moving Average Convergence Divergence Version 3) is a momentum indicator that applies volume-weighting to traditional MACD calculations on price, while using the Accumulation/Distribution (A/D) line for divergence detection. This hybrid approach combines volume-weighted price momentum with volume distribution analysis for comprehensive market insight.
## Key Features
- **Volume-Weighted Price MACD**: Traditional MACD calculation on price but weighted by volume for earlier signals
- **A/D Divergence Detection**: Identifies when A/D trend diverges from MACD momentum
- **Volume Strength Filtering**: Distinguishes high-volume confirmations from low-volume noise
- **Color-Coded Histogram**: 4-color system showing momentum direction and volume strength
- **Real-Time Alerts**: Background colors and alert conditions for bullish/bearish divergences
## Difference from ACCDv3
| Aspect | VMACDv3 | ACCDv3 |
|--------|---------|---------|
| **MACD Input** | **Price (Close)** | **A/D Line** |
| **Volume Weighting** | Applied to price | Applied to A/D line |
| **Primary Signal** | Volume-weighted price momentum | Volume distribution momentum |
| **Use Case** | Price momentum with volume confirmation | Volume flow and accumulation/distribution |
| **Sensitivity** | More responsive to price changes | More responsive to volume patterns |
| **Best For** | Trend following, breakouts | Volume analysis, smart money tracking |
**Key Insight**: VMACDv3 shows *where price is going* with volume weight, while ACCDv3 shows *where volume is accumulating/distributing*.
## Components
### 1. Volume-Weighted MACD on Price
Unlike standard MACD that uses simple price EMAs, VMACDv3 weights each price by its corresponding volume:
```
Fast Line = EMA(Price × Volume, 12) / EMA(Volume, 12)
Slow Line = EMA(Price × Volume, 26) / EMA(Volume, 26)
MACD = Fast Line - Slow Line
```
**Benefits of Volume Weighting**:
- High-volume price movements have greater impact
- Filters out low-volume noise and false moves
- Provides earlier trend change signals
- Better reflects institutional activity
### 2. Accumulation/Distribution (A/D) Line
Used for divergence detection, measuring buying/selling pressure:
```
A/D = Σ ((2 × Close - Low - High) / (High - Low)) × Volume
```
- **Rising A/D**: Accumulation (buying pressure)
- **Falling A/D**: Distribution (selling pressure)
- **Doji Handling**: When High = Low, contribution is zero
### 3. Signal Lines
- **MACD Line** (Blue, #2962FF): The fast-slow difference showing momentum
- **Signal Line** (Orange, #FF6D00): EMA or SMA smoothing of MACD
- **Zero Line**: Reference for bullish (above) vs bearish (below) bias
### 4. Histogram Color System
The histogram uses 4 distinct colors based on **direction** and **volume strength**:
| Condition | Color | Meaning |
|-----------|-------|---------|
| Rising + High Volume | **Dark Green** (#1B5E20) | Strong bullish momentum with volume confirmation |
| Rising + Low Volume | **Light Teal** (#26A69A) | Bullish momentum but weak volume (less reliable) |
| Falling + High Volume | **Dark Red** (#B71C1C) | Strong bearish momentum with volume confirmation |
| Falling + Low Volume | **Light Pink** (#FFCDD2) | Bearish momentum but weak volume (less reliable) |
Additional shading:
- **Light Cyan** (#B2DFDB): Positive but not rising (momentum stalling)
- **Bright Red** (#FF5252): Negative and accelerating down
### 5. Divergence Detection
VMACDv3 compares A/D trend against volume-weighted price MACD:
#### Bullish Divergence (Green Background)
- **Condition**: A/D is trending up BUT MACD is negative and trending down
- **Interpretation**: Volume is accumulating while price momentum appears weak
- **Signal**: Smart money accumulation, potential bullish reversal
- **Action**: Look for long entries, especially at support levels
#### Bearish Divergence (Red Background)
- **Condition**: A/D is trending down BUT MACD is positive and trending up
- **Interpretation**: Volume is distributing while price momentum appears strong
- **Signal**: Smart money distribution, potential bearish reversal
- **Action**: Consider exits, avoid new longs, watch for breakdown
## Parameters
| Parameter | Default | Range | Description |
|-----------|---------|-------|-------------|
| **Source** | Close | OHLC/HLC3/etc | Price source for MACD calculation |
| **Fast Length** | 12 | 1-50 | Period for fast EMA (shorter = more sensitive) |
| **Slow Length** | 26 | 1-100 | Period for slow EMA (longer = smoother) |
| **Signal Smoothing** | 9 | 1-50 | Period for signal line (MACD smoothing) |
| **Signal Line MA Type** | EMA | SMA/EMA | Moving average type for signal calculation |
| **Volume MA Length** | 20 | 5-100 | Period for volume average (strength filter) |
## Usage Guide
### Reading the Indicator
1. **MACD Lines (Blue & Orange)**
- **Blue Line (MACD)**: Volume-weighted price momentum
- **Orange Line (Signal)**: Smoothed trend of MACD
- **Crossovers**: Blue crosses above orange = bullish, below = bearish
- **Distance**: Wider gap = stronger momentum
- **Zero Line Position**: Above = bullish bias, below = bearish bias
2. **Histogram Colors**
- **Dark Green (#1B5E20)**: Strong bullish move with high volume - **most reliable buy signal**
- **Light Teal (#26A69A)**: Bullish but low volume - wait for confirmation
- **Dark Red (#B71C1C)**: Strong bearish move with high volume - **most reliable sell signal**
- **Light Pink (#FFCDD2)**: Bearish but low volume - may be temporary dip
3. **Background Divergence Alerts**
- **Green Background**: A/D accumulating while price weak - potential bottom
- **Red Background**: A/D distributing while price strong - potential top
- Most powerful at key support/resistance levels
### Trading Strategies
#### Strategy 1: Volume-Confirmed Trend Following
1. Wait for MACD to cross above zero line
2. Look for **dark green** histogram bars (high volume confirmation)
3. Enter long on second consecutive dark green bar
4. Hold while histogram remains green
5. Exit when histogram turns light green or red appears
6. Set stop below recent swing low
**Example**:
```
Price: 26,400 → 26,450 (rising)
MACD: -50 → +20 (crosses zero)
Histogram: Light teal → Dark green → Dark green
Volume: 50k → 75k → 90k (increasing)
```
#### Strategy 2: Divergence Reversal Trading
1. Identify divergence background (green = bullish, red = bearish)
2. Confirm with price structure (support/resistance, chart patterns)
3. Wait for MACD to cross signal line in divergence direction
4. Enter on first **dark colored** histogram bar after divergence
5. Set stop beyond divergence area
6. Target previous swing high/low
**Example - Bullish Divergence**:
```
Price: Making lower lows (26,350 → 26,300 → 26,250)
A/D: Rising (accumulation)
MACD: Below zero but starting to curve up
Background: Green shading appears
Entry: MACD crosses signal line + dark green bar
Stop: Below 26,230
Target: 26,450 (previous high)
```
#### Strategy 3: Momentum Scalping
1. Trade only in direction of MACD zero line (above = long, below = short)
2. Enter on dark colored bars only
3. Exit on first light colored bar or opposite color
4. Quick in and out (1-5 minute holds)
5. Tight stops (0.2-0.5% depending on instrument)
#### Strategy 4: Histogram Pattern Trading
**V-Bottom Reversal (Bullish)**:
- Red histogram bars start rising (becoming less negative)
- Forms "V" shape at the bottom
- Transitions to light red → light teal → **dark green**
- Entry: First dark green bar
- Signal: Momentum reversal with volume
**Λ-Top Reversal (Bearish)**:
- Green histogram bars start falling (becoming less positive)
- Forms inverted "V" at the top
- Transitions to light green → light pink → **dark red**
- Entry: First dark red bar
- Signal: Momentum exhaustion with volume
### Multi-Timeframe Analysis
**Recommended Approach**:
1. **Higher Timeframe (15m/1h)**: Identify overall trend direction
2. **Trading Timeframe (5m)**: Time entries using VMACDv3 signals
3. **Lower Timeframe (1m)**: Fine-tune entry prices
**Example Setup**:
```
15-minute: MACD above zero (bullish bias)
5-minute: Dark green histogram appears after pullback
1-minute: Enter on break of recent high with volume
```
### Volume Strength Interpretation
The volume filter compares current volume to 20-period average:
- **Volume > Average**: Dark colors (green/red) - high confidence signals
- **Volume < Average**: Light colors (teal/pink) - lower confidence signals
**Trading Rules**:
- ✓ **Aggressive**: Take all dark colored signals
- ✓ **Conservative**: Only take dark colors that follow 2+ light colors of same type
- ✗ **Avoid**: Trading light colored signals during high volatility
- ✗ **Avoid**: Ignoring volume context during news events
## Technical Details
### Volume-Weighted Calculation
```pine
// Volume-weighted fast EMA
fast_ma = ta.ema(src * volume, fast_length) / ta.ema(volume, fast_length)
// Volume-weighted slow EMA
slow_ma = ta.ema(src * volume, slow_length) / ta.ema(volume, slow_length)
// MACD is the difference
macd = fast_ma - slow_ma
// Signal line smoothing
signal = ta.ema(macd, signal_length) // or ta.sma() if SMA selected
// Histogram
hist = macd - signal
```
### Divergence Detection Logic
```pine
// A/D trending up if above its 5-period SMA
ad_trend = ad > ta.sma(ad, 5)
// MACD trending up if above zero
macd_trend = macd > 0
// Divergence when trends oppose each other
divergence = ad_trend != macd_trend
// Specific conditions for alerts
bullish_divergence = ad_trend and not macd_trend and macd < 0
bearish_divergence = not ad_trend and macd_trend and macd > 0
```
### Histogram Coloring Logic
```pine
hist_color = (hist >= 0
? (hist < hist
? (vol_strength ? #1B5E20 : #26A69A) // Rising: dark/light green
: #B2DFDB) // Positive but falling: cyan
: (hist < hist
? (vol_strength ? #B71C1C : #FFCDD2) // Rising (less negative): dark/light red
: #FF5252)) // Falling more: bright red
```
## Alerts
Built-in alert conditions for divergence detection:
### Bullish Divergence Alert
- **Trigger**: A/D trending up, MACD negative and trending down
- **Message**: "Bullish Divergence: A/D trending up but MACD trending down"
- **Use Case**: Potential reversal or continuation after pullback
- **Action**: Look for long entry setups
### Bearish Divergence Alert
- **Trigger**: A/D trending down, MACD positive and trending up
- **Message**: "Bearish Divergence: A/D trending down but MACD trending up"
- **Use Case**: Potential top or trend reversal
- **Action**: Consider exits or short entries
### Setting Up Alerts
1. Click "Create Alert" in TradingView
2. Condition: Select "VMACDv3"
3. Choose alert type: "Bullish Divergence" or "Bearish Divergence"
4. Configure: Email, SMS, webhook, or popup
5. Set frequency: "Once Per Bar Close" recommended
## Comparison Tables
### VMACDv3 vs Standard MACD
| Feature | Standard MACD | VMACDv3 |
|---------|---------------|---------|
| **Price Weighting** | Equal weight all bars | Volume-weighted |
| **Sensitivity** | Fixed | Adaptive to volume |
| **False Signals** | More during low volume | Fewer (volume filter) |
| **Divergence** | Price vs MACD | A/D vs MACD |
| **Volume Analysis** | None | Built-in |
| **Color System** | 2 colors | 4+ colors |
| **Best For** | Simple trend following | Volume-confirmed trading |
### VMACDv3 vs ACCDv3
| Aspect | VMACDv3 | ACCDv3 |
|--------|---------|--------|
| **Focus** | Price momentum | Volume distribution |
| **Reactivity** | Faster to price moves | Faster to volume shifts |
| **Best Markets** | Trending, breakouts | Accumulation/distribution phases |
| **Signal Type** | Where price + volume going | Where smart money positioning |
| **Divergence Meaning** | Volume vs price disagreement | A/D vs momentum disagreement |
| **Use Together?** | ✓ Yes, complementary | ✓ Yes, different perspectives |
## Example Trading Scenarios
### Scenario 1: Strong Bullish Breakout
```
Time: 9:30 AM (market open)
Price: Breaks above 26,400 resistance
MACD: Crosses above zero line
Histogram: Dark green bars (#1B5E20)
Volume: 2x average (150k vs 75k avg)
A/D: Rising (no divergence)
Action: Enter long at 26,405
Stop: 26,380 (below breakout)
Target 1: 26,450 (risk:reward 1:2)
Target 2: 26,500 (risk:reward 1:4)
Result: High probability setup with volume confirmation
```
### Scenario 2: False Breakout (Avoided)
```
Time: 2:30 PM (slow period)
Price: Breaks above 26,400 resistance
MACD: Slightly positive
Histogram: Light teal bars (#26A69A)
Volume: 0.5x average (40k vs 75k avg)
A/D: Flat/declining
Action: Avoid trade
Reason: Low volume, no conviction, potential false breakout
Outcome: Price reverses back below 26,400 within 10 minutes
Saved: Avoided losing trade due to volume filter
```
### Scenario 3: Bullish Divergence Bottom
```
Time: 11:00 AM
Price: Making lower lows (26,350 → 26,300 → 26,280)
MACD: Below zero but curving upward
Histogram: Red bars getting shorter (V-bottom forming)
Background: Green shading (divergence alert)
A/D: Rising despite price falling
Volume: Increasing on down bars
Setup:
1. Divergence appears at 26,280 (green background)
2. Wait for MACD to cross signal line
3. First dark green bar appears at 26,290
4. Enter long: 26,295 (next bar open)
5. Stop: 26,265 (below divergence low)
6. Target: 26,350 (previous swing high)
Result: +55 points (30 point risk, 1.8:1 reward)
Key: Divergence + volume confirmation = high probability reversal
```
### Scenario 4: Bearish Divergence Top
```
Time: 1:45 PM
Price: Making higher highs (26,500 → 26,520 → 26,540)
MACD: Positive but flattening
Histogram: Green bars getting shorter (Λ-top forming)
Background: Red shading (bearish divergence)
A/D: Declining despite rising price
Volume: Decreasing on up bars
Setup:
1. Bearish divergence at 26,540 (red background)
2. MACD crosses below signal line
3. First dark red bar appears at 26,535
4. Enter short: 26,530
5. Stop: 26,555 (above divergence high)
6. Target: 26,475 (support level)
Result: +55 points (25 point risk, 2.2:1 reward)
Key: Distribution while price rising = smart money exiting
```
### Scenario 5: V-Bottom Reversal
```
Downtrend in progress
MACD: Deep below zero (-150)
Histogram: Series of dark red bars
Pattern Development:
Bar 1: Dark red, hist = -80, falling
Bar 2: Dark red, hist = -95, falling
Bar 3: Dark red, hist = -100, falling (extreme)
Bar 4: Light pink, hist = -98, rising!
Bar 5: Light pink, hist = -90, rising
Bar 6: Light teal, hist = -75, rising (crosses to positive momentum)
Bar 7: Dark green, hist = -55, rising + volume
Action: Enter long on Bar 7
Reason: V-bottom confirmed with volume
Stop: Below Bar 3 low
Target: Zero line on histogram (mean reversion)
```
## Best Practices
### Entry Rules
✓ **Wait for dark colors**: High-volume confirmation is key
✓ **Confirm divergences**: Use with price support/resistance
✓ **Trade with zero line**: Long above, short below for best odds
✓ **Multiple timeframes**: Align 1m, 5m, 15m signals
✓ **Watch for patterns**: V-bottoms and Λ-tops are reliable
### Exit Rules
✓ **Partial profits**: Take 50% at first target
✓ **Trail stops**: Use histogram color changes
✓ **Respect signals**: Exit on opposite dark color
✓ **Time stops**: Close positions before major news
✓ **End of day**: Square up before close
### Avoid
✗ **Don't chase light colors**: Low volume = low confidence
✗ **Don't ignore divergence**: Early warning system
✗ **Don't overtrade**: Wait for clear setups
✗ **Don't fight the trend**: Zero line dictates bias
✗ **Don't skip stops**: Always use risk management
## Risk Management
### Position Sizing
- **Dark green/red signals**: 1-2% account risk
- **Light signals**: 0.5% account risk or skip
- **Divergence plays**: 1% account risk (higher uncertainty)
- **Multiple confirmations**: Up to 2% account risk
### Stop Loss Placement
- **Trend trades**: Below/above recent swing (20-30 points typical)
- **Breakout trades**: Below/above breakout level (15-25 points)
- **Divergence trades**: Beyond divergence extreme (25-40 points)
- **Scalp trades**: Tight stops at 10-15 points
### Profit Targets
- **Minimum**: 1.5:1 reward to risk ratio
- **Scalps**: 15-25 points (quick in/out)
- **Swing**: 50-100 points (hold through pullbacks)
- **Runners**: Trail with histogram color changes
## Timeframe Recommendations
| Timeframe | Trading Style | Typical Hold | Advantages | Challenges |
|-----------|---------------|--------------|------------|------------|
| **1-minute** | Scalping | 1-5 minutes | Fast profits, many setups | Noisy, high false signals |
| **5-minute** | Intraday | 15-60 minutes | Balance of speed/clarity | Still requires quick decisions |
| **15-minute** | Swing | 1-4 hours | Clearer trends, less noise | Fewer opportunities |
| **1-hour** | Position | 4-24 hours | Strong signals, less monitoring | Wider stops required |
**Recommendation**: Start with 5-minute for best balance of signal quality and opportunity frequency.
## Combining with Other Indicators
### VMACDv3 + ACCDv3
- **Use**: Confirm volume flow with price momentum
- **Signal**: Both showing dark green = highest conviction long
- **Divergence**: VMACDv3 bullish + ACCDv3 bearish = examine price action
### VMACDv3 + RSI
- **Use**: Overbought/oversold with momentum confirmation
- **Signal**: RSI < 30 + dark green VMACD = strong reversal
- **Caution**: RSI > 70 + light green VMACD = potential false breakout
### VMACDv3 + Elder Impulse
- **Use**: Bar coloring + histogram confirmation
- **Signal**: Green Elder bars + dark green VMACD = aligned momentum
- **Exit**: Blue Elder bars + light colors = momentum stalling
## Limitations
- **Requires volume data**: Will not work on instruments without volume feed
- **Lagging indicator**: MACD inherently follows price (2-3 bar delay)
- **Consolidation noise**: Generates false signals in tight ranges
- **Gap handling**: Large gaps can distort volume-weighted values
- **Not standalone**: Should combine with price action and support/resistance
## Troubleshooting
**Problem**: Too many light colored signals
**Solution**: Increase Volume MA Length to 30-40 for stricter filtering
**Problem**: Missing entries due to waiting for dark colors
**Solution**: Lower Volume MA Length to 10-15 for more signals (accept lower quality)
**Problem**: Divergences not appearing
**Solution**: Verify volume data available; check if A/D line is calculating
**Problem**: Histogram colors not changing
**Solution**: Ensure real-time data feed; refresh indicator
## Version History
- **v3**: Removed traditional MACD, using volume-weighted MACD on price with A/D divergence
- **v2**: Added A/D divergence detection, volume strength filtering, enhanced histogram colors
- **v1**: Basic volume-weighted MACD on price
## Related Indicators
**Companion Tools**:
- **ACCDv3**: Volume-weighted MACD on A/D line (distribution focus)
- **RSIv2**: RSI with A/D divergence detection
- **DMI**: Directional Movement Index with A/D divergence
- **Elder Impulse**: Bar coloring system using volume-weighted MACD
**Use Together**: VMACDv3 (momentum) + ACCDv3 (distribution) + Elder Impulse (bar colors) = complete volume-based trading system
---
*This indicator is for educational purposes. Past performance does not guarantee future results. Always practice proper risk management and never risk more than you can afford to lose.*

ACCDv3# ACCDv3 - Accumulation/Distribution MACD with Divergence Detection
## Overview
**ACCDv3** (Accumulation/Distribution MACD Version 3) is an advanced volume-weighted momentum indicator that combines the Accumulation/Distribution (A/D) line with MACD methodology and divergence detection. It helps identify trend strength, momentum shifts, and potential reversals by analyzing volume-weighted price movements.
## Key Features
- **Volume-Weighted MACD**: Applies MACD calculation to volume-weighted A/D values for earlier, more reliable signals
- **Divergence Detection**: Identifies when A/D trend diverges from MACD momentum
- **Volume Strength Filtering**: Distinguishes high-volume confirmations from low-volume noise
- **Color-Coded Histogram**: 4-color system showing momentum direction and volume strength
- **Real-Time Alerts**: Background colors and alert conditions for bullish/bearish divergences
## Components
### 1. Accumulation/Distribution (A/D) Line
The A/D line measures buying and selling pressure by comparing the close price to the trading range, weighted by volume:
```
A/D = Σ ((2 × Close - Low - High) / (High - Low)) × Volume
```
- **Rising A/D**: More accumulation (buying pressure)
- **Falling A/D**: More distribution (selling pressure)
- **Doji Handling**: When High = Low, contribution is zero (avoids division errors)
### 2. Volume-Weighted MACD
Instead of simple EMAs, the indicator weights A/D values by volume:
- **Fast Line** (default 12): `EMA(A/D × Volume, 12) / EMA(Volume, 12)`
- **Slow Line** (default 26): `EMA(A/D × Volume, 26) / EMA(Volume, 26)`
- **MACD Line**: Fast Line - Slow Line (green line)
- **Signal Line** (default 9): EMA or SMA of MACD (orange line)
- **Histogram**: MACD - Signal (color-coded columns)
This volume-weighting ensures that periods with higher volume have greater influence on the indicator values.
### 3. Histogram Color System
The histogram uses 4 distinct colors based on **direction** and **volume strength**:
| Condition | Color | Meaning |
|-----------|-------|---------|
| Rising + High Volume | **Dark Green** (#1B5E20) | Strong bullish momentum with volume confirmation |
| Rising + Low Volume | **Light Teal** (#26A69A) | Bullish momentum but weak volume (less reliable) |
| Falling + High Volume | **Dark Red** (#B71C1C) | Strong bearish momentum with volume confirmation |
| Falling + Low Volume | **Light Red/Pink** (#FFCDD2) | Bearish momentum but weak volume (less reliable) |
Additional shading:
- **Light Cyan** (#B2DFDB): Positive but not rising (momentum stalling)
- **Bright Red** (#FF5252): Negative and accelerating down
### 4. Divergence Detection
Divergence occurs when A/D trend and MACD momentum move in opposite directions:
#### Bullish Divergence (Green Background)
- **Condition**: A/D is trending up BUT MACD is negative and trending down
- **Interpretation**: Accumulation increasing while momentum appears weak
- **Signal**: Potential bullish reversal or continuation
- **Action**: Look for entry opportunities or hold long positions
#### Bearish Divergence (Red Background)
- **Condition**: A/D is trending down BUT MACD is positive and trending up
- **Interpretation**: Distribution increasing while momentum appears strong
- **Signal**: Potential bearish reversal or weakening uptrend
- **Action**: Consider exits, tighten stops, or prepare for reversal
## Parameters
| Parameter | Default | Range | Description |
|-----------|---------|-------|-------------|
| **Fast Length** | 12 | 1-50 | Period for fast EMA (shorter = more sensitive) |
| **Slow Length** | 26 | 1-100 | Period for slow EMA (longer = smoother) |
| **Signal Smoothing** | 9 | 1-50 | Period for signal line (MACD smoothing) |
| **Signal Line MA Type** | EMA | SMA/EMA | Moving average type for signal calculation |
| **Volume MA Length** | 20 | 5-100 | Period for volume average (strength filter) |
## Usage Guide
### Reading the Indicator
1. **MACD Lines (Green & Orange)**
- **Crossovers**: When green crosses above orange = bullish, below = bearish
- **Distance**: Wider gap = stronger momentum
- **Zero Line**: Above = bullish bias, below = bearish bias
2. **Histogram Colors**
- Focus on **dark colors** (dark green/red) for high-confidence signals
- Be cautious with **light colors** (teal/pink) - wait for volume confirmation
- Watch for **rising red bars** (V-bottom pattern) = potential bullish reversal
- Watch for **falling green bars** (Λ-top pattern) = potential bearish reversal
3. **Background Divergence Alerts**
- **Green background**: Bullish divergence - consider long entries
- **Red background**: Bearish divergence - consider exits or shorts
- Best used in combination with price action and support/resistance levels
### Trading Strategies
#### Trend Following
1. Wait for MACD to cross above zero line with dark green histogram
2. Enter long when histogram shows consecutive dark green bars
3. Exit when histogram turns light green or red appears
#### Divergence Trading
1. Wait for background divergence alert (green or red)
2. Confirm with price action (support/resistance, candlestick patterns)
3. Enter on next dark-colored histogram bar in divergence direction
4. Set stops beyond recent swing high/low
#### Volume Confirmation
1. Ignore signals during low-volume periods (light colors)
2. Take aggressive positions during high-volume confirmations (dark colors)
3. Use volume strength as position sizing guide (larger size on dark bars)
### Best Practices
✓ **Combine with price action**: Don't rely on indicator alone
✓ **Wait for dark colors**: High-volume bars are more reliable
✓ **Watch for divergences**: Early warning signs of reversals
✓ **Use multiple timeframes**: Confirm signals across 1m, 5m, 15m
✓ **Respect zero line**: Trading direction should align with MACD side
✗ **Don't chase light-colored signals**: Low volume = lower reliability
✗ **Don't ignore context**: Market structure and levels matter
✗ **Don't over-trade**: Wait for clear, high-volume setups
✗ **Don't ignore alerts**: Divergences are early warnings
## Technical Details
### Volume-Weighted Calculation Method
Traditional MACD uses simple price EMAs. ACCDv3 weights each A/D value by its corresponding volume:
```pine
// Volume-weighted fast EMA
close_vol_fast = ta.ema(ad × volume, fast_length)
vol_fast = ta.ema(volume, fast_length)
vw_ad_fast = close_vol_fast / vol_fast
// Same for slow EMA
close_vol_slow = ta.ema(ad × volume, slow_length)
vol_slow = ta.ema(volume, slow_length)
vw_ad_slow = close_vol_slow / vol_slow
// MACD is the difference
macd = vw_ad_fast - vw_ad_slow
```
This ensures high-volume periods have proportionally more impact on the indicator.
### Volume Strength Filter
Determines whether current volume is above or below average:
```pine
vol_avg = ta.sma(volume, vol_length)
vol_strength = volume > vol_avg
```
Used to select dark (high volume) vs light (low volume) histogram colors.
### Divergence Logic
```pine
// A/D trending up if above its 5-period SMA
ad_trend = ad > ta.sma(ad, 5)
// MACD trending up if above zero
macd_trend = macd > 0
// Divergence when trends oppose
divergence = ad_trend != macd_trend
// Specific conditions
bullish_divergence = ad_trend and not macd_trend and macd < 0
bearish_divergence = not ad_trend and macd_trend and macd > 0
```
## Alerts
The indicator includes built-in alert conditions:
- **Bullish Divergence**: "Bullish Divergence: A/D trending up but MACD trending down"
- **Bearish Divergence**: "Bearish Divergence: A/D trending down but MACD trending up"
To enable:
1. Click "Create Alert" button in TradingView
2. Select "ACCDv3" as condition
3. Choose "Bullish Divergence" or "Bearish Divergence"
4. Configure notification method (popup, email, webhook, etc.)
## Comparison with Standard MACD
| Feature | Standard MACD | ACCDv3 |
|---------|---------------|---------|
| **Input** | Close price | Accumulation/Distribution line |
| **Weighting** | Simple EMA | Volume-weighted EMA |
| **Divergence** | Price vs MACD | A/D vs MACD |
| **Volume Analysis** | None | Built-in strength filter |
| **Color System** | 2 colors (up/down) | 4+ colors (direction + volume) |
| **Leading/Lagging** | Lagging | More leading (volume-weighted) |
## Example Scenarios
### Scenario 1: Strong Bullish Signal
- **Chart**: MACD crosses above zero line
- **Histogram**: Dark green bars (#1B5E20) appearing
- **Volume**: Above 20-period average
- **Action**: Enter long, strong momentum with volume confirmation
### Scenario 2: Weak Bearish Signal
- **Chart**: MACD crosses below zero line
- **Histogram**: Light pink bars (#FFCDD2) appearing
- **Volume**: Below 20-period average
- **Action**: Avoid shorting, low volume = unreliable signal
### Scenario 3: Bullish Divergence Reversal
- **Chart**: Price making lower lows
- **Indicator**: A/D line trending up, MACD negative
- **Background**: Green shading appears
- **Histogram**: Transitions from red to dark green
- **Action**: Look for long entry on next dark green bar
### Scenario 4: V-Bottom Reversal
- **Chart**: Downtrend in place
- **Histogram**: Red bars start rising (becoming less negative)
- **Pattern**: Forms "V" shape at bottom
- **Confirmation**: Transitions to dark green bars
- **Action**: Bullish reversal signal, consider long entry
## Timeframe Recommendations
- **1-minute**: Scalping, very fast signals (noisy, use with caution)
- **5-minute**: Intraday momentum trading (recommended)
- **15-minute**: Swing entries, clearer trend signals
- **1-hour+**: Position trading, major trend identification
## Limitations
- **Requires volume data**: Will not work on instruments without volume
- **Lag during consolidation**: MACD is inherently trend-following
- **False signals in chop**: Sideways markets generate noise
- **Not a standalone system**: Should be combined with price action and risk management
## Version History
- **v3**: Removed traditional price MACD, using only volume-weighted A/D MACD with A/D divergence
- **v2**: Added A/D divergence detection, volume strength filtering, enhanced histogram colors
- **v1**: Basic MACD on A/D line with volume-weighted calculation
## Support & Further Reading
For questions, updates, or to report issues, refer to the main project documentation or contact the developer.
**Related Indicators in Suite:**
- **VMACDv3**: Volume-weighted MACD on price (not A/D)
- **RSIv2**: RSI with A/D divergence
- **DMI**: Directional Movement Index with A/D divergence
- **Elder Impulse**: Bar coloring system using volume-weighted MACD
---
*This indicator is for educational purposes. Always practice proper risk management and never risk more than you can afford to lose.*

200 EMA Rebound Signals | Partnior Programista🚀 200 EMA Rebound Signals | TradingView Indicator Description
1. 💡 Overview
The 200 EMA Rebound Signals is a trend-following indicator designed to identify high-probability reversal signals (rebound) from the 200-period Exponential Moving Average (EMA), which is widely recognized as a major dynamic support and resistance level defining the long-term market trend.
This tool provides a clear, actionable signal when price temporarily pulls back to the 200 EMA and then continues in the direction of the prevailing trend (the context).
2. 🎯 Core Logic (Context & Trend)
The indicator first establishes the market context (long-term trend) using the 200 EMA:
* Bullish Context (LONG): The current closing price is above the 200 EMA.
* Bearish Context (SHORT): The current closing price is below the 200 EMA.
A trade signal is only generated when a rebound pattern occurs in the direction of the established context.
3. 🧩 Three Entry Logic Options
The indicator offers three distinct methods for confirming the rebound, selectable via the Entry Signal Logic input:
Option 1: Confirmation (A/D) - (Default)
This logic requires a two-candle sequence for confirmation:
* LONG Signal: The previous candle's close was above the EMA, and its low touched the EMA. The current candle then closes above the high of the previous candle, confirming the upward bounce.
* SHORT Signal: The previous candle's close was below the EMA, and its high touched the EMA. The current candle then closes below the low of the previous candle, confirming the downward bounce.
Option 2: Pin Bar / Rejection (B/E)
This logic uses the powerful Pin Bar candlestick pattern to signal a strong rejection of the 200 EMA level.
* LONG Signal: A Pin Bar forms (long lower shadow) in a Bullish Context, and the candle's low touches the EMA. The lower shadow must be greater than the candle body by the specified Min. Shadow Ratio.
* SHORT Signal: A Pin Bar forms (long upper shadow) in a Bearish Context, and the candle's high touches the EMA. The upper shadow must be greater than the candle body by the specified Min. Shadow Ratio.
Option 3: Simple Touch & Close (C/F)
This is the simplest logic, requiring only a single candle to signal the rebound:
* LONG Signal: In a Bullish Context, the candle's low touches or penetrates the EMA, but the candle closes above the EMA.
* SHORT Signal: In a Bearish Context, the candle's high touches or penetrates the EMA, but the candle closes below the EMA.
4. ⚙️ Key Inputs (Inputs)
| Parameter (Russian) | Parameter (English) | Default Value | Description |
|---|---|---|---|
| Период EMA (N) | EMA Period (N) | 200 | Sets the lookback period for the Exponential Moving Average. (Default: 200) |
| Источник Цены | Price Source | close | The price data used for the EMA calculation (e.g., Close, Open, High, Low). |
| Логика Сигнала Отскока | Entry Signal Logic | 1. Confirmation (A/D) | Selects one of the three rebound confirmation methods explained above. |
| Мин. Коэф. Тени (Пин-Бар) | Min. Shadow Ratio (Pin Bar) | 2.0 | Used only for Option 2. Specifies how many times the pin bar's shadow must be larger than its body to qualify as a signal. (e.g., 2.0 means shadow >= 2 * body size). |
5. 🛠️ How to Use
* Define Your Trend: The indicator automatically shows the long-term trend (Bullish/Bearish Context).
* Select Logic: Choose the entry logic that best suits your trading style (Confirmation, Pin Bar, or Simple Touch).
* Wait for the Rebound: Wait for the price to pull back to the 200 EMA.
* Enter Trade: A Green Triangle below the bar signals a potential LONG entry. A Red Triangle above the bar signals a potential SHORT entry.
Would you like me to translate any other sections of your code's comments or description?

Moving Average ExponentialThe EMA 50 Trend Filter At the heart of the Sniper system lies the 50-period Exponential Moving Average. Unlike simple moving averages, the EMA applies a weighting factor to recent price data, significantly reducing lag. Role in Strategy:
Trend Identification: Serves as the binary divider between Long and Short bias.
Dynamic Structure: Acts as dynamic support in uptrends and resistance in downtrends.
Signal Filtering: The algorithm automatically suppresses any 'Buy' signals below the line and 'Sell' signals above it, ensuring you never trade against the institutional momentum.

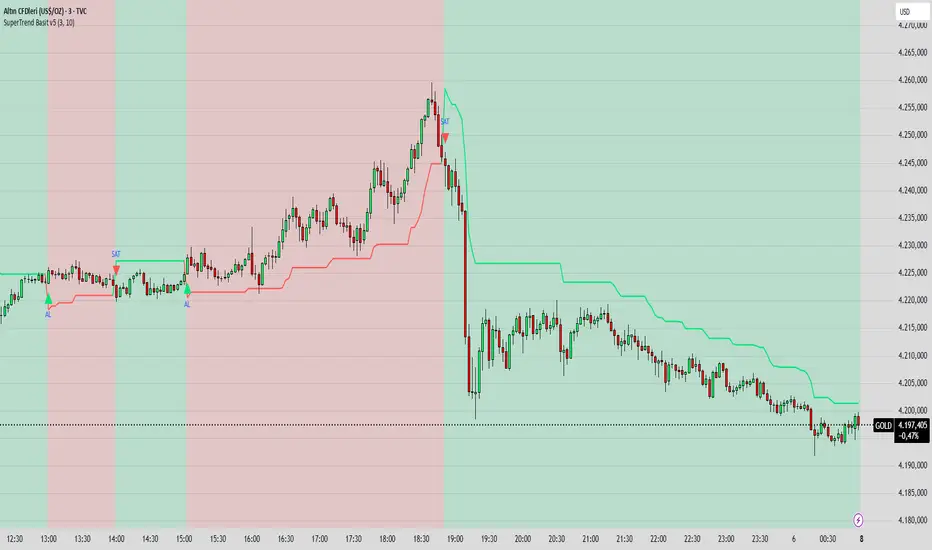
SuperTrend Basit BY İNCEBACAK//@version=5
indicator("SuperTrend Basit v5", overlay=true)
// === Girdi ayarları ===
factor = input.float(3.0, "ATR Katsayısı")
atrPeriod = input.int(10, "ATR Periyodu")
// === Hesaplamalar ===
= ta.supertrend(factor, atrPeriod)
// === Çizim ===
bodyColor = direction == 1 ? color.new(color.lime, 0) : color.new(color.red, 0)
bgcolor(direction == 1 ? color.new(color.lime, 85) : color.new(color.red, 85))
plot(supertrend, color=bodyColor, linewidth=2, title="SuperTrend Çizgisi")
// === Al/Sat sinyali ===
buySignal = ta.crossover(close, supertrend)
sellSignal = ta.crossunder(close, supertrend)
plotshape(buySignal, title="AL", location=location.belowbar, color=color.lime, style=shape.triangleup, size=size.small, text="AL")
plotshape(sellSignal, title="SAT", location=location.abovebar, color=color.red, style=shape.triangledown, size=size.small, text="SAT")
EMA Color Cross + Trend Bars + Background BY İNCEBACAK//@version=5
indicator("EMA Color Cross + Trend Bars + Background", overlay=true)
// EMA ayarları
shortEMA = input.int(9, "Short EMA")
longEMA = input.int(21, "Long EMA")
emaShort = ta.ema(close, shortEMA)
emaLong = ta.ema(close, longEMA)
// Trend yönü
trendUp = emaShort > emaLong
trendDown = emaShort < emaLong
// EMA çizgileri trend yönüne göre renk değiştirsin
plot(emaShort, color=trendUp ? color.green : color.red, linewidth=4)
plot(emaLong, color=trendUp ? color.green : color.red, linewidth=4)
// Barları trend yönüne göre renklendir
barcolor(trendUp ? color.green : color.red)
// Arka plan trend yönüne göre
bgcolor(trendUp ? color.new(color.green, 85) : color.new(color.red, 85))
// Kesişim sinyalleri ve oklar
longSignal = ta.crossover(emaShort, emaLong)
shortSignal = ta.crossunder(emaShort, emaLong)
plotshape(longSignal, title="Long", style=shape.triangleup, location=location.belowbar, color=color.green, size=size.large)
plotshape(shortSignal, title="Short", style=shape.triangledown, location=location.abovebar, color=color.red, size=size.large)

EMA Cross with SLEMA Cross with adjustable SL.
Created for M5 timeframe chart.
Best combine with MACD.

EMA Cross Pullback For M5 timeframe chart.
Best combine with MACD.
Stop Loss slightly below/above ema50.


Gemini Hibrit Avcı (Supertrend + StochRSI)SupertrendOption 1: Natural & Conversational (Best Match for Original Tone)
This version captures the explanatory, "speaking to a friend" vibe of your Turkish text.
Supertrend: When you look at the chart, you'll see Green or Red clouds in the background. This basically tells you, "Should you only be thinking about buying right now, or selling?"
Stoch RSI: You know how the price sometimes makes a correction (drops slightly) even when the Supertrend is green? This indicator catches the exact moment that correction ends and the price starts heading back up (the K and D crossover).
EMA 200 Filter: This comes enabled by default in your settings. It means: "If the price is below the 200-day average, do not—under any circumstances—enter a trade, even if the Supertrend gives a BUY signal." This protects you from fake rallies (bull traps) during a bear market.

Dan Zanger Master Trading System [Premium]
Dan Zanger Master Trading System
Overview
This indicator implements the legendary trading methodology of Dan Zanger, who famously turned $10,775 into over $42 million using pattern recognition and volume analysis. The system combines professional-grade pattern detection, volume analysis, and risk management into a comprehensive trading solution.
----------------------------------------------------------------------------------
Core Features
1. Zanger Volume Ratio (ZVR)
The cornerstone of Zanger's methodology—volume confirms everything.
- Dynamic volume classification: Extreme (≥2x), High (≥1.65x), Moderate (≥1.25x), Low
- Bar coloring by volume intensity for instant visual feedback
- Volume dry-up detection: Identifies when volume contracts to <50% of average—Zanger's key signal that precedes explosive breakouts
2. Pattern Detection Engine
Automatically detects Zanger's favorite chart patterns:
🚩 Bull Flag - 15%+ pole with orderly 20-50% retracement, downward-sloping flag, declining volume
☕ Cup & Handle - U-shaped recovery (12-35% depth), handle in upper half, no undercut of cup low
△ Ascending Triangle - Flat resistance with higher lows, converging range, multiple resistance touches
▽ Descending Triangle - Flat support with lower highs (bearish warning)
◇ Symmetrical Triangle - Converging trendlines with contracting volume
▬ Flat Base - Tight consolidation (<15% range), price near highs, volume drying up
═ Channel - Up/Down/Horizontal channels with parallel bounds
3. Trend Analysis
Four Moving Averages: 10/20/50/200-period (selectable: SMA, EMA, WMA, VWMA)
Trend Score (0-100): Quantifies trend strength based on MA positioning and direction
Golden Cross/Death Cross detection with visual markers
4. Zanger-Style Breakout Detection
Breakouts require ALL of these conditions:
- ✅ Price exceeds resistance with conviction
- ✅ Volume confirms (≥1.5x average)
- ✅ Strong close (upper 25% of bar range)
- ✅ Above rising 50-day MA
- ✅ Preceded by volume dry-up (ideal)
5. "Never Chase" Protection
Zanger's #1 rule implemented: Warns you when price is >5% above breakout level. This prevents costly chasing entries.
6. Risk Management System
Built-in position management following Zanger's rules:
Stop Loss: Default 7% (Zanger uses 5-7%)
Profit Target 1: 15% (take partial profits)
Profit Target 2: 30% (let winners run)
Trailing Stop: Activates after PT1, trails at 10% from highs
Visual stop loss and profit target lines on chart
------------------------------------------------------------------------------------
Dashboard
Real-time information panel showing:
Current ZVR value and classification
Volume dry-up status
Trend score and bias
MA positioning
Active pattern detection
Current signal status
Position P&L and stop levels
---------------------------------------------------------------------------------
Alert System
15+ configurable alerts including:
Pattern breakouts (Bull Flag, Cup & Handle, Triangles, Flat Base)
Extreme volume detection
Volume dry-up alerts
Stop loss/trailing stop triggers
Profit target notifications
Chasing warnings
--------------------------------------------------------------------------------
Settings
Fully customizable parameters:
ZVR thresholds and lookback
MA types and lengths
Pattern detection toggles
Breakout sensitivity
Stop loss and profit target percentages
Visual styling and colors
---------------------------------------------------------------------------------
Zanger's Key Principles Implemented
Volume is King – Every breakout requires volume confirmation
Never Chase – Built-in warning when >5% above breakout
Cut Losses Quickly – 5-7% stop losses
Let Winners Run – Trailing stops after first target
Trade with the Trend – Only buy above rising 50-day MA
Volume Dry-Up – Best breakouts follow volume contraction
Strong Closes – Look for closes in upper 25% of bar
----------------------------------------------------------------------------------
Best Practices
Use on daily charts for swing trading (Zanger's primary timeframe)
Works on stocks with adequate volume (avoid illiquid names)
Combine with market analysis (Zanger trades strong markets)
Wait for pullbacks when chasing warning appears
Honor your stops – capital preservation is priority
-----------------------------------------------------------------------------------
Disclaimer
This indicator is for educational purposes. Past performance does not guarantee future results. Always do your own research and use proper risk management.
