1H & 15M Swing Liquidity BSL / SSL (Projected to Lower TFs)I created this script to plot 1H intermediate and 15m short term liquidity on the lower timeframe charts. Works best when used with high timeframe keylevels as a catalyst to move price to these liquidity zones.
Multitimeframe

Fib and Slope Trend Detector [EWT] + MTF Dashboard🚀 Overview
The Momentum Structure Trend Detector is a sophisticated trend-following tool that combines Price Velocity (Slope) with Market Structure (Fibonacci) to identify high-probability trend reversals and continuations.
Unlike traditional indicators that rely heavily on lagging moving averages, this script analyzes the speed of price action in real-time. It operates on the core principle of market structure: Impulse moves are fast and steep, while corrections are slow and shallow.
🧠 The Logic: Physics Meets Market Structure
This indicator determines the trend direction by calculating the Slope (Velocity) of price swings.
ZigZag Calculation: It first identifies market swings (Highs and Lows) using a standard pivot detection algorithm.
Slope Calculation: It calculates the velocity of every completed leg using the formula: $Slope = \frac{|Price Change|}{|Time Duration|}$.
Trend Definition:
Uptrend : If the previous Up-move was fast (Impulse) and the subsequent Down-move is slower (Correction), the market is primed for an uptrend.
Downtrend : If the previous Down-move was fast (Impulse) and the subsequent Up-move is slower (Correction), the market is primed for a downtrend.
🔥 Key Features
1. Aggressive Real-Time Detection (No Lag)
Most structure indicators wait for a "Higher High" to confirm a trend, which often leads to late entries. This script uses an Aggressive Live Slope calculation:
It compares the current developing slope of the live price action against the slope of the previous completed leg.
Result: As soon as the current move becomes "steeper" (faster) than the previous correction, the trend flips immediately. This allows you to catch the "meat" of the move before a new pivot is even confirmed.
2. Fibonacci Validity Filter
Momentum alone isn't enough; we need structural integrity.
The script calculates the 78.6% Retracement level of the impulse leg.
If a correction moves deeper than this Fibonacci limit (on a closing basis), the trend structure is considered "broken" or "invalid," and the indicator switches to a Neutral state. This filters out choppy/ranging markets.
3. Multi-Timeframe (MTF) Dashboard
A customizable dashboard on the chart allows for fractal analysis. You can view the trend state (UP/DOWN/NEUTRAL) across 9 different timeframes (1m to 1M) simultaneously.
Green Row : Uptrend
Red Row : Downtrend
Gray : Neutral/Indeterminate
4. Smart Visuals
Background Colo r: Changes dynamically (Teal for Bullish, Red for Bearish, Gray for Neutral) to give you an instant read of the market state.
Slope Labels : Displays the calculated numeric slope on the chart, helping you visualize the momentum difference between impulse and corrective waves.
Invalidation Levels : Automatically plots the invalidation line (Stop Loss level) based on the market structure.
🛠️ Settings & Inputs
Strategy Settings
Pivot Deviation Length : Sensitivity of the ZigZag calculation (Default: 5). Lower numbers = more sensitive to small swings.
Max Retracement % : The Fibonacci limit for a valid correction (Default: 78.6%).
Min Bars for Live Calc : To prevent noise, the script waits for this many bars after a pivot before calculating the "Live Slope" (Default: 3).
Dashboard Settings
Show Dashboard : Toggle the table on/off.
Timeframe Toggles : Enable/Disable specific timeframes (1m, 5m, 15m, 30m, 1H, 4H, 1D, 1W, 1M) to suit your trading style.
🎯 How to Use
Wait for Background Change : When the background turns Teal, it indicates that a corrective pullback has ended and a new impulse with high velocity has begun.
Check Invalidation : Look at the plotted Stop Loss Level. If price closes below this line, the trade idea is invalid.
Confirm with Dashboard : Use the table to ensure the higher timeframes (e.g., 1H, 4H) align with your current chart's direction for higher probability setups.
Disclaimer : This tool is designed for trend analysis and educational purposes. Past performance (momentum) is not indicative of future results. Always manage your risk.

Đại Ka 3 ATR BandsĐại Ka 3 ATR Bands – The ultimate single-slot indicator that replaces three separate ATR plots.
Designed specifically for ICT/SMC traders in 2025:
• Light red band (±0.5 ATR) → fake moves, Judas Swing, Turtle Soup zone
• Gray band (±1.0 ATR) → normal price action
• Light green band (±2.0 ATR) → real displacement zone → Silver Bullet, SFT, high-probability entries
How to use:
– Price stuck inside red band → expect reversal/fakeout
– Price breaks and closes outside green band + volume spike → enter aggressively in that direction (85%+ win-rate inside Killzones)
Default ATR(14), subtle fills for instant visual filtering of real vs fake moves.
Perfect companion for Order Blocks, FVG, Breaker Blocks and NY/London Killzones.
Free forever – coded with love by Đại Ka & Vietnamese ICT crew.

RSI Hybrid + EMA Cloud + Swings(15m/2H)RSI Hybrid + EMA Cloud (15m Trend + 2H Momentum)
A dual-timeframe trading system combining fast 15-minute trend structure with higher-timeframe 2-Hour momentum, volume and structural levels.
🧩 What This Indicator Does
This tool blends:
🔹 15m Trend (EMA Cloud) – 2 Points
EMA 7 vs 21 → Short trend
EMA 30 vs 74 → Long trend
Cloud shading highlights bullish/bearish alignment
Faster, intraday trend sensitivity
🔹 2H Momentum (RSI Hybrid) – 3 Points
RSI > 50
RSI > SMA(4)
RSI > SMA(12)
Gives short / medium / long momentum confirmation from the higher timeframe.
🔹 2H Volume Pressure – 1 Point
Volume vs 20-SMA
Mild / Moderate / Strong Bull/Bear
Confirms true participation behind price moves
⭐ Score System (0–6 Total)
Component Points
15m EMA Trend 2
2H RSI Hybrid 3
2H Volume Power 1
Total 6
Interpretation:
5–6 → High-confluence direction
3–4 → Partial confluence
1–2 → Weak bias
0 → No reliable direction
Designed for discretionary and semi-systematic intraday traders.
📊 15m Structural Levels
Includes:
✔ Last confirmed 15m Swing High / Swing Low
Based on close-price pivots, not highs/lows.
✔ Live Running High since last Swing LOW
Tracks how far price has extended upward.
✔ Live Running Low since last Swing HIGH
Tracks downward extension after a swing high.
✔ ATR(15m)
Volatility reference for SL/TP or risk modeling.
These levels help in timing entries, managing stops, and identifying breakout/breakdown zones.
🖥 On-Chart Info Table
Summarizes:
15m EMA short & long trend
2H RSI short/medium/long momentum
RSI vs 50
2H volume power
Bull & Bear score (with breakdown)
Last 15m swing highs/lows
ATR(15m)
Color-coded for clarity
💡 Why Use This Indicator
High-speed 15m trend detection
Higher-TF 2H momentum & volume confirmation
Multi-layered bias presented in a simple score
Built-in structure for more intelligent entries/exits
Works on indices, stocks, FX, crypto
Ideal for intraday traders who want speed + reliability

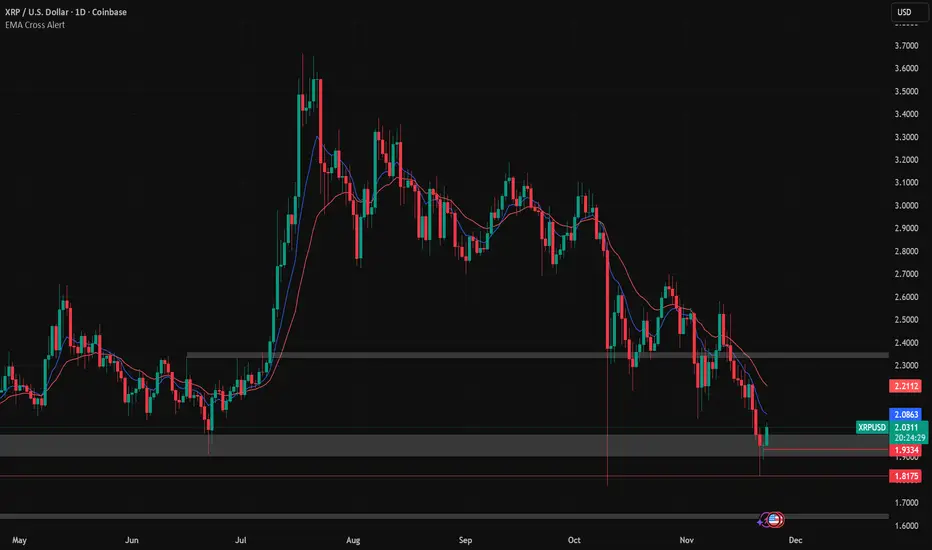
FortesThis script generates buy and sell alerts based on the crossover of two EMAs (9 and 21). When the 9 EMA crosses above the 21 EMA, it signals a buy; when it crosses below, it signals a sell. Simple and effective for EMA crossover trading.
MTF EMA Directional Bias -1hr and 4hr A compact, fixed-position table (bottom-right corner) that shows the current slope direction of two higher-timeframe EMAs:
4H EMA 50 → direction over the last 2 bars (UP ↑, DOWN ↓, or FLAT ⏸)
1H EMA 21 → direction over the last 2 bars (UP ↑, DOWN ↓, or FLAT ⏸)
Background color logic:
Green → both 4H and 1H EMAs are sloping upward
Red → both 4H and 1H EMAs are sloping downward
Gray → mixed or flat directions (no confluence)
Additionally draws the actual 1H EMA-21 (purple) and 4H EMA-50 (red) as step-lines on the chart.

MTF Scalper - alemicihanMulti-Timeframe Scalper Strategy: Aligning the Big Picture for Quick Gains
This article presents a robust futures trading strategy designed for high-frequency scalping in the crypto market. It’s built on the principle of minimizing risk by ensuring that short-term entries are always aligned with the dominant, higher-timeframe trend.
The Core Concept: Alignment is Key
A Balanced Trend Follower approach, now refined for rapid scalping, uses a Multi-Timeframe (MTF) confirmation system to filter out market noise and increase the probability of a successful trade.
The strategy operates on a Low Timeframe (LTF) chart (e.g., 3m, 5m, or 15m) but only executes trades if the direction is validated by three Higher Timeframes (HTF).
ComponentPurposeFunctionHTF (D, 4h, 1h) EMA => Trend Confirmation =>Checks if the current price is above/below all three Exponential Moving Averages (EMA 20). This provides a strong directional bias.
LTF (5m) Stochastic RSI => Momentum Entry => Generates the actual buy/sell signal by spotting a swift crossover, indicating fresh momentum in the direction of the confirmed HTF trend.
How The Signal Is Generated
Trend Alignment: The system first confirms the trend. If the price is trading above the Daily, 4-Hour, and 1-Hour EMAs, the market is deemed to be in a Strong LONG Trend. Only LONG signals are permitted.
Momentum Trigger: Once the trend is confirmed, a Long Signal is generated only when the Stochastic K-Line crosses above the D-Line, indicating a momentum shift (a pullback ending) towards the main trend direction.
Short Signal: The inverse logic applies to the Short Trend confirmation and entry signal.
Mandatory Risk Management: ATR-Based Exit
Given the high leverage nature of futures and scalping, static Stop-Loss (SL) and Take-Profit (TP) levels are inefficient. This strategy uses the Average True Range (ATR) indicator to dynamically set profit and loss targets based on current market volatility.
Stop Loss (SL): Set dynamically at 1.5 x ATR below (for long) or above (for short) the entry price. This gives the trade enough room to breathe without risking excessive capital.
Take Profit (TP): Set dynamically at 3.0 x ATR, establishing a robust Risk-to-Reward Ratio of 1:2.
Final Thoughts on Testing
This sophisticated approach combines the reliability of MTF analysis with the speed of momentum indicators. However, data analysis is key. Backtesting these parameters (EMA, ATR Multipliers, RSI/Stochastic lengths) on your chosen asset (like BTC/USDT or ETH/USDT) and timeframe is crucial to achieving optimal performance.

ICT Macro Slot Algo Event📊 Overview
A powerful multi-timeframe trading indicator that combines Institutional Macro Session Tracking identify optimal trading windows throughout the day. This tool helps traders align with institutional flow patterns and algorithmic activity across major sessions.
🎯 Key Features
1. Macro Algo Event Sessions
Tracks 6 key institutional time windows during NY Session:
NY Sweep (08:50-09:10) - Opening balance flows
Silver Bullet #1 (09:50-10:10) - First major macro move
Silver Bullet #2 (10:50-11:10) - Second chance/retest opportunity
Lunch Macro (11:50-12:10) - Mid-day repositioning
Post-Lunch Rebalance (13:10-13:40) - Post-lunch adjustments
NY Closing Macros (15:15-15:45) - End-of-day flows

Five Moving Averages (5, 10, 21, 50, 200)This helps to use multiple Moving averages . Using this indicator you can able to user 5 time frames at time .

Advanced Triple Strategy ScalperHere are the three scalping strategies presented in the video "3 Scalping Strategies That Work Every Day (Backtested & Proven)" by Asia Forex Mentor – Ezekiel Chew:
### Scalper’s Trend Filter (Triple EMA)
This strategy uses three EMAs (25, 50, 100) on the 5-minute chart to filter high-probability trades aligned with momentum .
- Only trade when all three EMAs are angled in the same direction and clearly separated (no crossing or tangling) .
- Enter when price pulls back toward the 25 or 50 EMA and then bounces back toward the 25 EMA, but do not enter if price closes below the 100 EMA .
- Set stop-loss just below the 50 EMA or swing low and aim for a risk-to-reward ratio of 1:1.5 .
### Flip Zone Trap (Reversal Catching)
This method identifies precise reversal moments where market structure shifts from weakness to strength .
- Use the 15-min chart to locate key support or resistance zones where price previously reacted .
- Wait for price to stop making lower lows and begin making higher highs (or vice versa for shorts); confirm with a trendline break AND follow-through (higher lows & highs within 5-7 candles) .
- Use confirmation candles (bullish engulfing, pin bar rejection) at the zone before entry .
### Liquidity Shift Trigger (Smart Money Trap)
This system leverages institutional stop hunts and liquidity sweeps at key zones for sniper entries .
- Start with a 15-min chart to identify structure breaks and points of interest (order blocks, flip zones, demand zones) .
- Drop to 1-min chart and wait for price to enter the refined zone and sweep liquidity (sharp wick/spike below/above key level) .
- Once liquidity is swept, wait for a clean structure shift (break of most recent internal high or low) within 5–6 candles—if confirmed, refine entry to the candle that caused the break and enter when price returns to that candle with a strong reaction .
***
### Practical Application
- These strategies are systematic, rule-based, and designed to cut out fake moves, avoid early stop-outs, and align entries with momentum and institutional activity .
- Perfect for short timeframes and volatile pairs like XAUUSD, especially if paired with additional confirmation from other technical analysis tools .
All three strategies emphasize filtering noise, waiting for momentum/trend confirmation, and avoiding impulsive entries—key principles for consistent scalping success

RSI to 50 (decimal version) - TemujinTradingSimple indicator that shows the price levels required for the RSI to get to the value of 50.
What I observe is 50 rsi often acts as support or resistance and is a fair indication of bullish/bearish sentiment and price action and bounce/rejection levels.
It provides a table showing current time frame, 4 hr, daily, weekly describing the current rsi value and the price needed for that rsi to get to 50. This table is colored red when bearish at the time frame and green when bullish (as per <50 rsi or >50rsi).
Plots historical lines of each previous candle in the series showing how price interacts.
Updated script to allow manual input of price decimals to enable more assets price to be viewable in the table format.

RSI to 50 - TemujinTradingSimple indicator that shows the price levels required for the RSI to get to the value of 50.
What I observe is 50 rsi often acts as support or resistance and is a fair indication of bullish/bearish sentiment and price action and bounce/rejection levels.
It provides a table showing current time frame, 4 hr, daily, weekly describing the current rsi value and the price needed for that rsi to get to 50. This table is colored red when bearish at the time frame and green when bullish (as per <50 rsi or >50rsi).
Plots historical lines of each previous candle in the series showing how price interacts.

Multi-Timeframe TTM Squeeze Pro with alerts and screenersBased of John Carters TTM Squeeze. Must open the settings and select wether you want to match the timeframe in your chart. This must be done in the pinescreener as well otherwise results will not be correct.
---
# **Squeeze Momentum Pro – Enhanced Screener + EMA Cross Alerts**
This custom version of the Squeeze Momentum indicator expands the standard TTM-style squeeze with screening and automated alert logic so you can quickly find high-quality setups across many tickers.
---
## **What This Script Does**
This indicator plots a three-level squeeze visual similar to TTM Squeeze:
Dot meanings in this indicator
Orange dot:
Strongest squeeze – Bollinger Bands are inside the tightest Keltner level (highest volatility compression).
Red dot:
Medium squeeze – still compressed, but not as tight as orange.
Black dot:
Weak squeeze / lowest level of volatility compression.
Price is coiling, but not as tight as the higher levels.
Green dot (“Fired”):
Squeeze has released — Bollinger Bands have expanded out of the channels and momentum is moving.
A momentum histogram is plotted to show directional pressure during the squeeze.
---
## **Major Improvements Added**
### **① Screenable Conditions for Stock Scanners**
This version includes multiple `alertcondition()` flags so the script can be used as a **Pine Screener inside TradingView**.
Currently it can screen for:
✔ Price closing above the 50-SMA
✔ Presence of an **orange (strong) squeeze dot**
✔ 6/20 EMA crossover signals inside a squeeze
These can be used inside the TradingView Screener or in watchlists to automatically highlight qualifying tickers.
---
### **② 6/20 EMA Trend Signals (Filtered by Squeeze)**
A crossover system was added:
* **Bullish Signal:** 6 EMA crosses above 20 EMA
* **Bearish Signal:** 6 EMA crosses below 20 EMA
But **these signals only trigger if the market is in a red or orange squeeze**, which helps remove noise and focus on valid setups.
---
### **③ Visual Markers Under the Histogram**
Whenever an EMA crossover occurs during a squeeze:
* A **green up-triangle** is plotted for a bullish cross
* A **red down-triangle** for a bearish cross
These markers are drawn **below the histogram**, keeping the display clean while still providing quick visual cues.
---
### **④ Fully Non-Repainting Logic**
All signals and squeeze calculations are based on standard fully-resolved `ta.*` functions, making the results stable both in backtesting and real-time.
---
## **Who This Script Helps**
This version is ideal for:
* Traders who use TradingView’s screener and want automated breakout/continuation filtering
* Traders who scan large watchlists for squeeze setups
* Users who want trend confirmation during volatility compression
---
## **How to Use It**
1. Add the script to your chart
2. Open TradingView Alerts or Screener
3. Select the conditions you want, for example:
* *“Orange Squeeze Detected”*
* *“Squeeze Fire after 3 squeeze dots*
* *“4 REd Dots in a row.”*
* *“Buy Alert”*
* *“EMA 6/20 Bullish Crossover (Squeeze Only)”*
* *“Close Above 50 SMA”*
Once active, TradingView will automatically flag symbols that meet the criteria.
---
## **Summary**
This enhanced Squeeze Momentum indicator turns the standard TTM-style visual into a **true screening and alert system** by adding:
* Multi-level squeezes
* EMA trend signals
* Screener-compatible alert conditions
* Clean visual signals
* Non-repainting logic
It helps traders quickly locate high-probability setups across any watchlist or market.

Previous Day Candle [ApexFX]Previous Day Candle is a precision tool designed for intraday traders who rely on previous daily structures to find support and resistance.
While most indicators simply mark the previous high and low, this tool focuses on Session Continuity. It highlights the full 24-hour range of the previous day and extends those levels into the "Killzone" of the current trading day (up to 2:00 PM EST / 12:00 PM MST).
Why use this? Market reaction often occurs at the previous day's extremes. By extending these lines into the current session, you can easily spot:
Breakouts: Price pushing through yesterday's high.
Failed Auctions: Price sweeping yesterday's low and reversing.
Support/Resistance Flips: Old highs becoming new support.
Main Features:
Asset Class Presets: Don't worry about timezones. Simply select your market:
Forex: Aligns to the standard 5:00 PM EST New York Open.
Indices: Aligns to the 6:00 PM EST Globex Open.
Crypto: Aligns to UTC Midnight.
Custom: Full manual control for specific needs.
Visual "Boxing": Vertical dotted lines clearly demarcate the start and end of the previous trading day.
Dynamic History: Choose to show just yesterday's levels or look back at the last 5+ days.
Smart Color Coding: The indicator automatically cycles colors for each day (Blue = Yesterday, Green = 2 Days Ago, etc.), making it instant to read historical price action.
Best Used On: Intraday timeframes (5m, 15m, 1h).

Mini Checklist (Left-side, static)It's a mini checklist on the left side of the chart serving as a note for when you trade.
Pretty simple

Candle day/hourThis indicator displays a short label on each bar showing the day of week on daily charts and the hour on hourly charts. It supports multiple timezones and allows customization of label color, background, and font size.


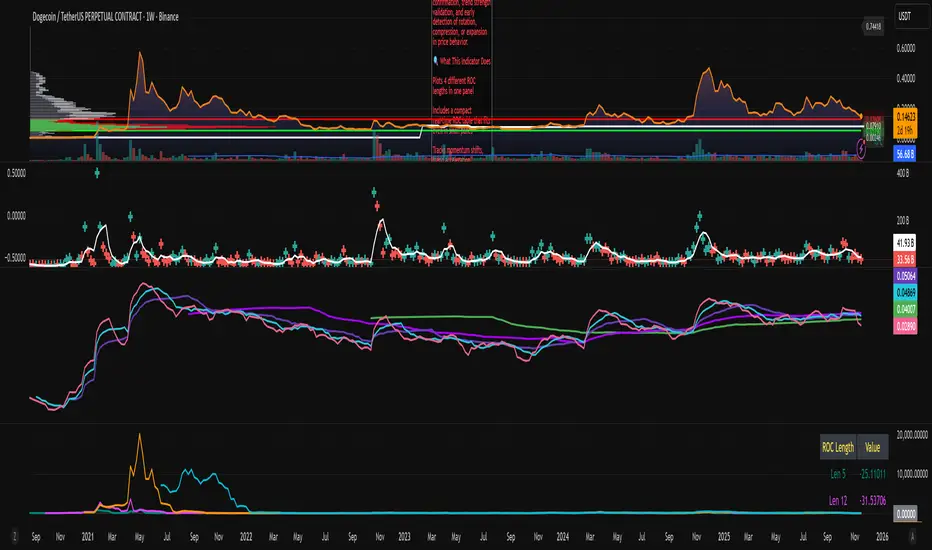
ROC x4 (Multi-Period Overlay) + Table📈 ROC x4 (Multi-Period Momentum Suite) + Compact Table
A clean, powerful momentum indicator that overlays four Rate-of-Change (ROC) periods inside a single pane — without needing to stack multiple separate indicators.
This script is designed for traders who use multi-timeframe momentum confirmation, trend strength validation, and early detection of rotation, compression, or expansion in price behavior.
🔍 What This Indicator Does
Plots 4 different ROC lengths in one panel
Includes a compact real-time ROC table that fits even in small panes
Tracks momentum shifts, trend acceleration, slowdowns, and regime transitions
Allows manual input for all 4 ROC lengths
Optional smoothing to reduce noise
Zero-line toggle for momentum direction clarity
Perfect for traders who want to monitor short-term, mid-term, and long-term ROC simultaneously.
KC-BB Squeeze Trend Trader█ OVERVIEW
The KC-BB Squeeze Trend Trader identifies volatility compression and expansion by detecting when Bollinger Bands contract inside Keltner Channels and then release with confirmed momentum. It highlights potential trend-starting breakouts by combining squeeze detection, directional momentum, trend bias, and optional volume filters.
During periods of low volatility, price consolidates and energy builds. When volatility expands again, strong directional moves often follow. This tool helps traders spot those opportunities early with clear visual cues and optional performance tracking.
█ KEY FEATURES
Squeeze detection using Bollinger Bands inside Keltner Channels
Automatic identification of volatility expansion after the squeeze ends
Optional filters for momentum, trend direction, volume, and signal cooldown
Dynamic color fills for squeeze, bullish expansion, bearish expansion, and neutral states
Dashboard showing squeeze duration, tightness, momentum, trend, and volume context
Optional win-rate analytics using ATR-based target and stop evaluation
Multi-timeframe confirmation for higher-quality breakouts
█ HOW IT WORKS
A squeeze occurs when both Bollinger Bands sit inside the Keltner Channels.
A breakout begins when the Bollinger Bands expand outside the KCs.
Long signals appear when squeeze release aligns with bullish momentum and trend strength.
Short signals appear when bearish momentum and trend conditions agree.
Volume and cooldown filters help reduce noise and avoid low-quality entries.
█ HOW TO USE
Wait for a squeeze period (yellow fill).
Monitor duration and tightness: longer/tighter squeezes often lead to stronger moves.
When a long or short signal appears, use the plotted ATR-based target and stop as reference levels.
Watch for contraction or exit hints when momentum fades or volatility narrows again.
Higher timeframes generally provide cleaner and more reliable signals.
█ TIMEFRAME GUIDANCE
Crypto: 4H or 1D; consider increasing KC multiplier for high volatility.
Forex: 1H–4H; longer squeeze duration can improve selectivity.
Stocks: 1D–1W; consider slightly higher BB multiplier on slow-moving markets.
█ SETTINGS SUMMARY
Adjustable Bollinger Band and Keltner Channel lengths and multipliers
Three momentum modes: Linear Regression, Price–SMA, or ROC
Trend and volume filters (optional)
Configurable minimum squeeze duration and signal cooldown
ATR-based target and stop multipliers
Optional historically tight squeeze filter (percentile-based)
█ ALERTS
Squeeze Detected
Squeeze Released
Long Entry
Short Entry
Exit Hint
Historically Tight Squeeze
█ NOTES
ATR-based win-rate calculations provide simplified performance estimates.
Past behavior does not guarantee future movement.
Use position sizing and risk management appropriate for the instrument and timeframe.
█ CREDITS
Inspired by the Bollinger Band and Keltner Channel squeeze concept popularized by John Carter’s TTM Squeeze, with added enhancements for squeeze strength, filtering, and real-time performance metrics.

DANGHIEU EMA 34/89/200 Ribbon (Scaled HTF)📘 Indicator Description – EMA 34/89/200 Ribbon (Scaled HTF)
The EMA 34/89/200 Ribbon (Scaled HTF) indicator is designed to replicate higher-timeframe EMAs directly on your current chart without switching timeframes.
Using a precise HTF Scaling Algorithm, the script converts EMAs from 1H, 2H, 4H, 6H, 12H, 1D, and even 1W into equivalent lengths on lower timeframes—allowing traders to perform true multi-timeframe trend analysis on a single chart.
The 34-EMA and 89-EMA form a dynamic trend ribbon that changes color based on the relationship between the two moving averages. This helps traders quickly identify trend direction, momentum strength, and potential market reversals. The indicator also includes optional crossover markers (X symbols) to highlight bullish and bearish crossovers for cleaner signal recognition. EMA200 is included as the long-term trend anchor.
This tool is ideal for scalpers, day traders, and swing traders who require higher-timeframe context while trading lower-timeframe entries.
🟦 How to Use the Indicator
1. Choose the Higher Timeframe to Simulate
Use the “HTF to Simulate” dropdown to select the timeframe you want to emulate (e.g., 4H, 2H, 1D, 1W).
The script automatically scales the EMA lengths so they match the selected HTF.
2. Read the Ribbon for Trend Direction
Green Ribbon → EMA34 above EMA89 → Bullish momentum
Red Ribbon → EMA34 below EMA89 → Bearish momentum
The ribbon expands when momentum strengthens and contracts during consolidation.
3. Use EMA Crossovers as Signal Zones
Optional X markers highlight crossover points:
Bullish Crossover → EMA34 crosses above EMA89
Bearish Crossover → EMA34 crosses below EMA89
These crossovers often align with trend shifts or early momentum changes.
4. EMA200 as Trend Filter
The EMA200 acts as the macro trend filter:
Price above EMA200 → only consider long setups
Price below EMA200 → only consider short setups
Combining ribbon trend + EMA200 alignment improves signal accuracy.
5. Multi-Timeframe Trading Strategy
This indicator is powerful for:
Scalping with HTF bias
Pullback entry on lower timeframe during HTF trend
Identifying trend exhaustion when the ribbon flips
Confirming wave structure (Elliott Wave, Dow Theory)
Spotting strong momentum phases and squeeze zones
Example workflow:
Select 4H as HTF simulation.
Trade on 15m or 5m chart.
Enter only when price aligns with the HTF ribbon + EMA200 trend.
Use EMA crossovers as confirmation signals.

darshakssc SMC Infinity Enginedarshakssc SMC Infinity Engine is an advanced Smart Money Concepts–based tool designed to help traders visually understand institutional price behavior such as liquidity sweeps, displacement moves, and structure breaks — all without repainting.
This script does not predict the future or guarantee outcomes.
Instead, it provides a structured price-action framework to help traders study how markets move during key intraday phases.
🔍 Core Concepts Used
This indicator highlights:
Liquidity Sweeps (equal highs/lows taken out)
Displacement Candles (strong institutional momentum bars)
Break of Structure (BOS) confirmations
Kill Zone Sessions (optional smart-money timing filter)
Higher Time Frame Trend Alignment
Dynamic Entry, Stop Loss, and Target Levels
Internal trade outcome tagging (TP1/TP2/TP3/SL)
These components are widely used in institutional price-action models and can help users understand how liquidity and structure interact throughout the trading day.
📊 What the Indicator Displays
LONG / SHORT signals after confirmed BOS
Entry, SL, TP1, TP2, TP3 mapped directly on the chart
Background highlighting for liquidity sweep zones
A clean dashboard showing:
Current symbol
Current price
Number of setups recognized
TP1/TP2/TP3 stats
SL count
Live win-rate calculation
Last outcome recorded
All visuals are provided for study purposes to help users review how price reacts during key structure shifts.
🧠 How to Use It (Educational Purpose)
This tool is designed as a market research & educational study aid.
You can use it to:
Observe how liquidity sweeps often precede directional moves
Study how displacement confirms institutional intent
Analyze BOS-based structure shifts
Compare HTF trend alignment with LTF execution
Review trade outcomes historically for self-improvement
It can assist in building discipline and consistency when learning SMC-style concepts — without any automation or strategy execution.
⚠️ Important Notes
This script does not repaint.
This is not a trading system, signal generator, or financial advice.
All information is for educational and informational purposes only.
Past performance does not guarantee future results.
Users should always perform their own analysis and risk management.
🛡️ Compliance Disclaimer
This script is provided for educational purposes only.
It does not constitute investment advice, does not guarantee results, and should not be used as the sole basis for any trading decision.

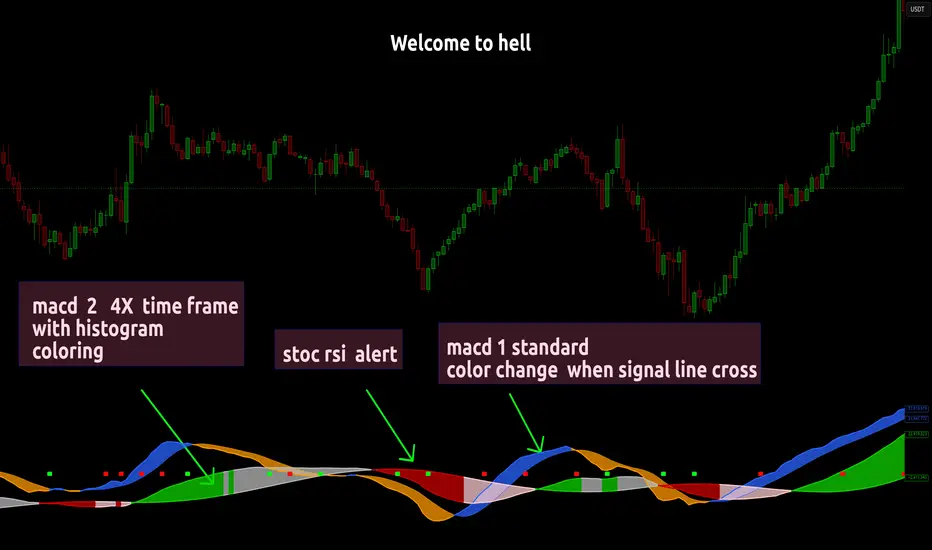
MACD FROM HELLthis is a double macd with 2 time frames macd 1 is chart macd 4 is 4X meaning the 1hr becomes the 4hr and it uses the histogram coloring for added detail ,, on top of that it has stochastic rsi Alerts set to trigger when k line goes above 99.9 or below 0.01 and exits ,, alert triggers on exit
EMA+SuperThis indicator integrates multiple trend-following components into a unified, clean, and easy-to-interpret chart overlay. Its purpose is to help traders observe short-term and long-term trend direction, momentum shifts, and potential areas of interest using established moving-average and volatility-based techniques.
🔹 Features
1. Multi-EMA Framework
Plots the 9, 21, 50, 100, and 200 EMAs to provide a structured view of short, medium, and long-term market trends.
2. Supertrend Overlay
Applies an ATR-based Supertrend to visualize potential directional shifts.
Both uptrend and downtrend zones are lightly shaded for improved clarity.
3. NovaWave-Style Trend Cloud
A dynamic cloud formed from:
Fast EMA
Slow EMA
Signal MA
The cloud automatically adapts its color based on the relationship between the fast and slow EMAs, offering a quick visual read of momentum bias.
4. Displaced Moving Averages (20 / 50 / 200 DMA)
Includes optional forward displacement to replicate commonly used DMA models in trend-following systems.
5. Crossover Buy/Sell Signals
Buy and sell markers appear when the fast EMA crosses above or below the slow EMA.
Users may create custom alerts via the TradingView alerts panel.
🔹 Alerts
This indicator supports built-in EMA crossover alerts:
Buy Alert – triggered when the fast EMA crosses above the slow EMA
Sell Alert – triggered when the fast EMA crosses below the slow EMA
Users can enable these alerts through the “Add Alert” panel and select the corresponding alert condition.
Alerts are evaluated on bar close for consistency and do not repaint.
🔹 How to Use
EMA structure helps define directional bias and market phase.
The Supertrend and Trend Cloud offer contextual confirmation.
EMA crossovers can help highlight momentum changes.
DMAs provide an additional perspective on smoothed trend levels.
This tool is intended for visual analysis and can complement other approaches such as volume studies, higher-timeframe trend analysis, or support/resistance mapping.
⚠️ Disclaimer
This script is for educational and informational purposes only. It does not constitute financial advice or guarantee any outcome. Always perform independent analysis and apply proper risk management.
