Opening Range {premium}Introduction
Opening Range {premium} is designed to help traders clearly define, visualize and trade the opening range of a session. Built for precision and flexibility, this indicator is ideal for day traders who use opening range breakout (ORB), mean reversion or range expansion strategies across equities, futures, forex and crypto markets.
By automatically calculating the opening range high, low and midpoint within a configurable session window, this tool removes manual effort and provides clean actionable structure directly on your chart.
Description
The indicator measures the opening range over a user-defined duration (5m, 15m, 30m or 60m) within a specified trading session (default: NY session). During the opening window, the indicator dynamically tracks the highest high and lowest low, then locks in these levels once the range is complete. A shaded fill visually emphasizes the opening range, with an optional size label displaying the total range in price units.
After the opening range is established, the indicator:
Extends the high, low and mid levels forward.
Plots multiple extension levels based on the size of the range.
Visually highlights the first candle that breaks above or below the range.
This indicator includes dark, light and custom themes, allowing it to integrate seamlessly with any chart style.
Features
Configurable opening range length
Choose between 5m, 15m, 30m or 60m opening range time lengths.
Session-based calculation
Opening range is calculated only within your selected trading session.
Opening range levels
Opening range high, low and midpoint.
Range fill & size display
Shaded fill between opening range high and low.
Text showing total opening range size.
Extension levels
Plot up to four customizable extension levels above and below the range, based on range multiples (e.g. 0.5x, 1x, 1.5x, 2x).
Breakout candle highlighting
Automatically highlights the first candle that breaks above or below the opening range high or low.
Advanced styling options
Line styles: solid, dashed, dotted.
Adjustable line thickness.
Dark, light or custom color themes.
Optimized performance
Designed to run efficiently on intraday timeframes compatible with the selected opening range length.
Terms & Conditions
This indicator is provided for educational and informational purposes only and does not constitute financial advice.
Trading involves risk and past performance is not indicative of future results.
The user assumes full responsibility for any trading decisions made using this indicator.
Redistribution, resale or modification of this script without permission is strictly prohibited.
Openingrangehighlow

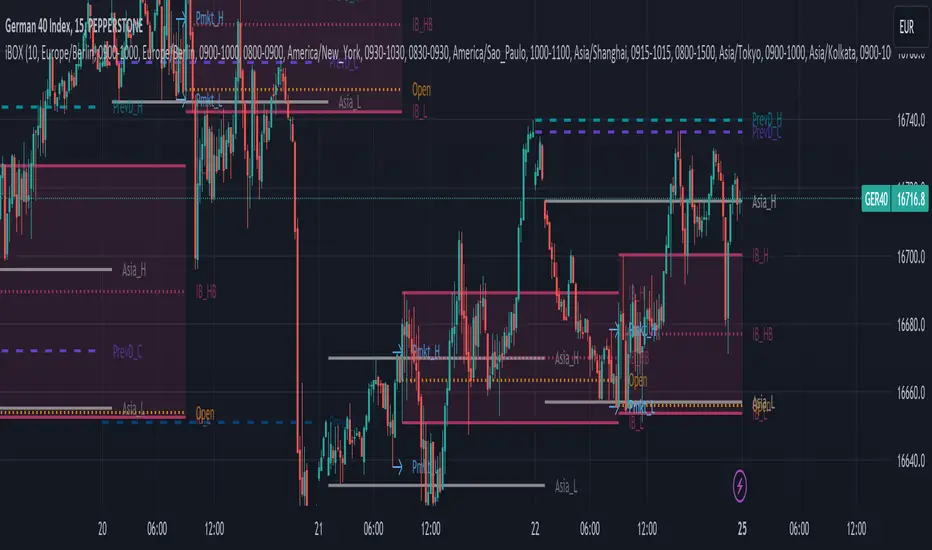
iBox, Initial Balance | IB High, Low, Midpoint | OpeningThis Indicator will print basically 4 lines.
You have to understand the importance of the "Initial Balance" the first trading hour of Cash session is very important in trading stocks and indizes.
So you will get 4 lines:
Opening
Initial Balance High
Initial Balance Low
Initial Balance Midpoint/Halfback
Most indicators for Range Box, Opening Trade, Opening Range, Initial Balance, iBOX and "Ultimate Lines" will only use the timezone of the exchange or your own timezone. I'm living in europe and we have this daylight saving time change in Summer/Winter - which will cause problems with most of the existing indicators or at least will push you to change the times regularly.
Another important point: I really like to switch the indizes when trading on my mobile. So what will happen when you set up opening range for DAX at 09:00 and then switch to S&P500? All indicators I tried failed here - they will just draw a wrong line for SPX, NDX, DJI, FTSE, ASX etc. I fixed that and hard coded stock exchanges and ticker symbols into 3 main groups Initial Balance EU/US/Asia
For example we take DAX - XETRA DAX is opening at 09:00 MEZ (Europe/Berlin)
The Initial Balance is set during the H1 Candle from 09:00 - 09:59
Please be aware, that some cash indizes only deliver data to TradingView after the "opening auction" - so for Xetra DAX you have to book live data and often you will only see data at 09:02/09:03 after the opening auction.
So you will get different opening lines compared from cash to future or your CFD provider. Future and CFD should fit for 99%
The Opening Line will be drawn at exactly 09:00
IB High on the highest price during the H1 candle
IB Low on the lowest price during the H1 candle
IB Halfback is simple: (IB High + IB Low) / 2
The lines will be drawn from cash start until next day and will end 2 minutes before the next cash session will start again. Please make your own experience! Activate the indicator for a CFD or Future switch to M15 and watch the wicks around the 4 lines. Even in the night or the next morning before the next Initial Balance will be set.
For me the lines are valid for around 24 hours and often longer. That's why it's good to have the old lines on the chart too.
To-do:
Yesterday high / low / close / halfback (also for last week and month)
Labels for the lines - sometimes only the colors will confuse you - a simple label should be a benefit (IB_h, IB_l, IB_1/2, 1D_o)
Range Lines for Asia Range and Premarket Range - additionaly a parameter to disable premarket lines when premarket is trading in asia range.
Add Alert condition to get alerts after IB is set
If you have and thoughts, ideas or improvements, please send me an message or leave an comment!
Like i said, the stock exchanges and ticker symbols are hard coded and can be extended for all relevant assets.
Have fun and i really hope this indicator will help improving your trading experience!
Opening Range FibonaccisThis indicator uses the concept of the "Opening Range" to create a Fibonacci zone from the high and low set during a specific time period after open (Defaults to 9:30 - 10:05 AM, EST)
The Opening Range is a popular tool for intraday technical analysis. Price frequently uses these levels as support/resistance, and a breakout from within the range can be a sign of further movement.
The Fibonacci levels are set such that the opening range high/low fall on the +/-0.5 fib. This creates an "extended range" outside of the opening range that may be useful during breakouts.

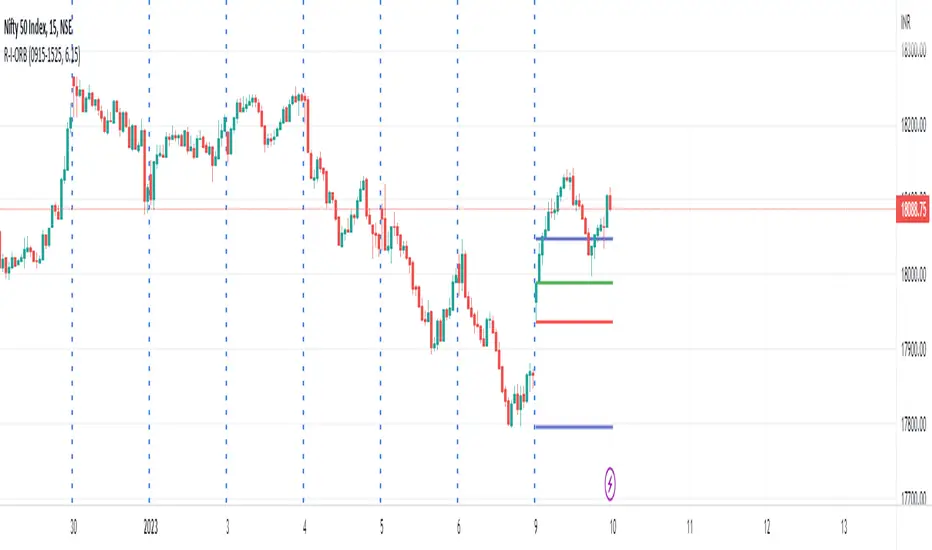
R-I-ORBThis is an intraday indicator which plots high and low of timeframe's first bar.
Top line - High of the first session bar
Bottom line - low of the first session bar
Requires session timing and total trading hours to plot the lines appropriately.
We can use the indicator to trade intraday opening range breakouts.
Thanks!
ORB with Multi Tracking [MV]This Indicator Session time is Indian NSE Equity Market
This is plot By Default Opening Range First Candle High and Low
What is the First Range?
First Range after plot when Opening Range High Above Open candle
What is the Second Range?
Second Range after plot when Opening Range Low Below Open candle
1: purple line are first Candle High and low
2: first range are green line high and Low after
opening range above open candle
3: second range are red line high and Low after
opening range below open candle
4: yellow line are high and low Buffer by
default 1percent
if you have any suggestion mention there
Thank you

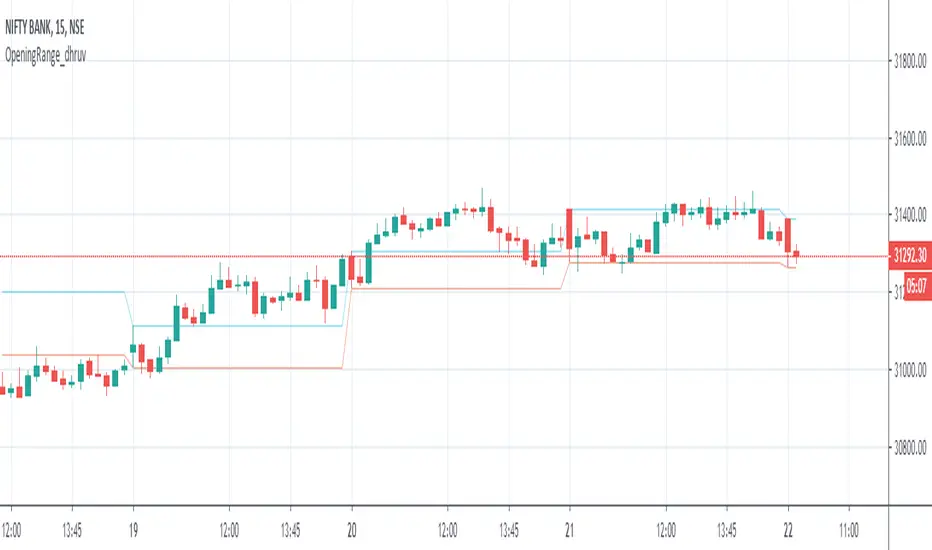
Opening Range_dhruvHello Traders ..
this is the strategy for opening range 15 min high low auto marking tool