Decision Points for TradingSimple script to highlight
Previous Day Low (PDL), Previous Day High(PDH), Previous Day Close(PDC)
Big round Numbers (BRN)
High Of the Day (HoD)
Low Of the Day (LOD)
-- Will add more DP's going fwd.
Usage : Especially useful to trade on NIFTY/Bank Nifty without any additional specific indicators.
Especially for daily analysis and intraday trading - Decision Points(DP's) are critical and will be using this simple script.
Orb

London Open Range Breakout by KviateqThis script is what I currently use to day trade forex on a 5-minute timeframe.
The script features Multi-timeframe EMA20 that uses timeframe multipliers and is smoother by the factor by which you're multiplying your current timeframe.
Default settings are set to display EMA20 on the current (M5) timeframe, as well as M15, H1, H4 and D1 timeframes.
The background color changes intensity based on how many conditions are met - are all EMAs in the right order, is the current close above/below all the EMAs.
Featured is also a range set to 1 hour since the London breakout (can be changed to M15, or however long you'd like - my current setting is 30 minute).
Also featured are levels that I find to be of most importance - such as Daily and Weekly Open, Previous Day's and Week's Highs.
The idea is to only take trades when all stars align - EMAs, break above/below the Opening Range and not to long/short into an important level.

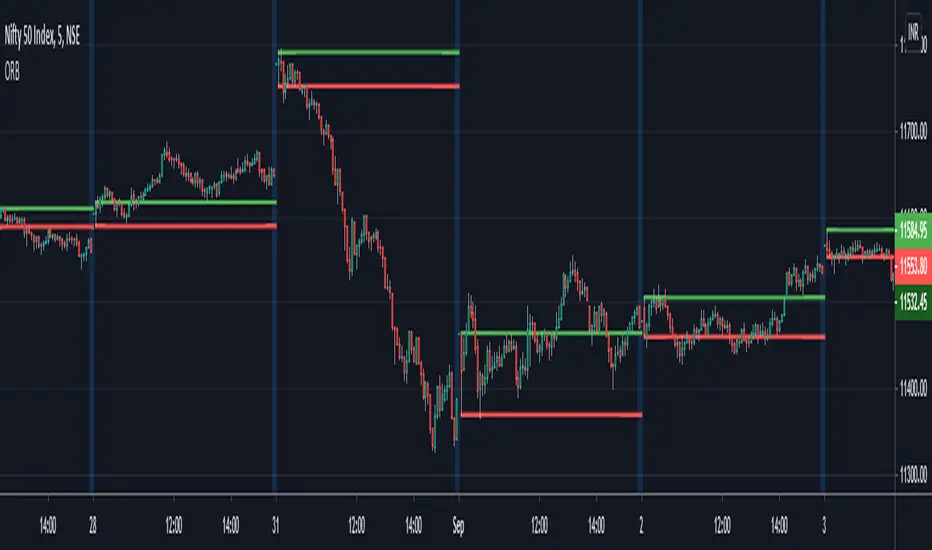
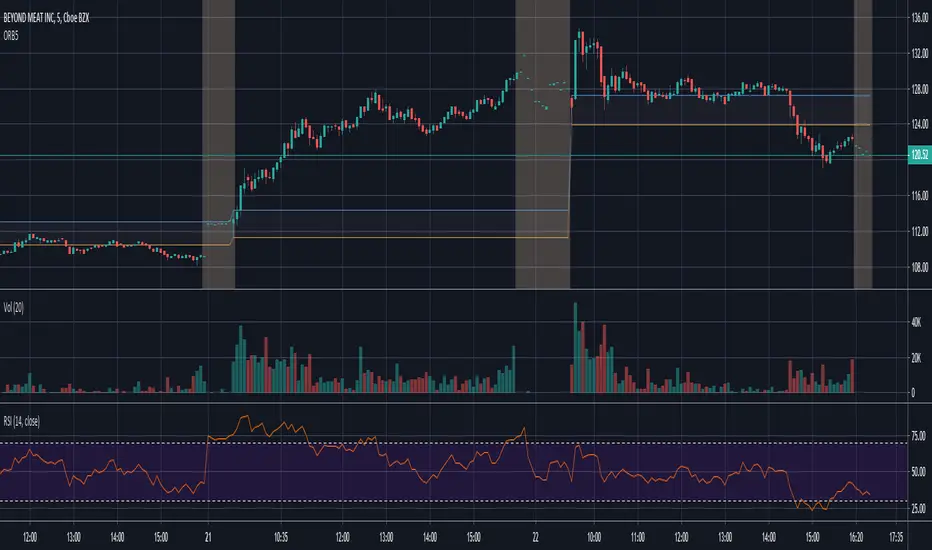
ORB - Opening Range BreakoutThis script plots the high/low of any custom session and extends it until the daily close. It does not show on the timeframe higher than the length of custom opening session by default.
The time period of opening range & the max timeframe to display it on can be adjusted from the settings.
So for eg. if want to use 5m ORB to trade, then set "ORB total time" as 5min & "Session Time" as whatever is the opening 5mins time period of ticker that are trading.
High & Low Of Custom Session - OpeningRange Breakout (Expo)High & Low Of Custom Session - OpeningRange Breakout (Expo) prints the high and the low of a custom session.
I use the indicator to trade the re-test of opening range (high/low) as well as breakouts from the opening range. The same logic can be applied to the session you have chosen.
HOW TO USE
1. Use the indicator to trade the re-tests of the session range.
2. Use the indicator to trade breakouts of session range.
INDICATOR IN ACTION
1-min chart
I hope you find this indicator useful , and please comment or contact me if you like the script or have any questions/suggestions for future improvements. Thanks!
I will continually work on this indicator, so please share your experience and feedback as it will enable me to make even better improvements. Thanks to everyone that has already contacted me regarding my scripts. Your feedback is valuable for future developments!
-----------------
Disclaimer
Copyright by Zeiierman.
The information contained in my scripts/indicators/ideas does not constitute financial advice or a solicitation to buy or sell any securities of any type. I will not accept liability for any loss or damage, including without limitation any loss of profit, which may arise directly or indirectly from the use of or reliance on such information.
All investments involve risk, and the past performance of a security, industry, sector, market, financial product, trading strategy, or individual’s trading does not guarantee future results or returns. Investors are fully responsible for any investment decisions they make. Such decisions should be based solely on an evaluation of their financial circumstances, investment objectives, risk tolerance, and liquidity needs.
My scripts/indicators/ideas are only for educational purposes!

ORB-5Min with Pre Market DataORB 5 Min With Pre Market Data
Opening Range 5 Minute Chart
- set chart to 5m
- enable pre market data (if using with tradingview, if not use my other script)
- add your other indicators you like
ORB 15 Min By EquityDurai#Let the index/stock trade for the first fifteen minutes and then use the high and low of this "fifteen minute range" as support and resistance levels.
#A buy signal is given when price exceeds the high of the 15 minute range after an up gap.
#A sell signal is given when price moves below the low of the 15 minute range after a down gap.
#It's a simple technique that works like a charm in many cases.
>If you use this technique, though, a few caveats are in order to avoid whipsaws and other market traps.
>The most common whipsaw is a trading range that lasts longer than 15 minutes.
>If an obvious range builds in 20, 25 or even 30 minutes , use those to define your support and resistance levels.
>Also consider the higher noise level in the morning.
>A breakout that extends only a tick or two can be easily reversed and trap you in a sudden loss.
>So let others take the bait at these levels, while you find pullbacks and narrow range bars for trade execution.

ORB PotentialWhen indicator line shows rising trend, it means market has been good candidate for Intra-day ORB trading strategy. Indicator measures market's tendency of uni-directional moves during intra-day. Markets with rising indicator line can be used for Intra-day ORB trading in anticipation of continuing its past tendency to show intra-day unidirectional moves.

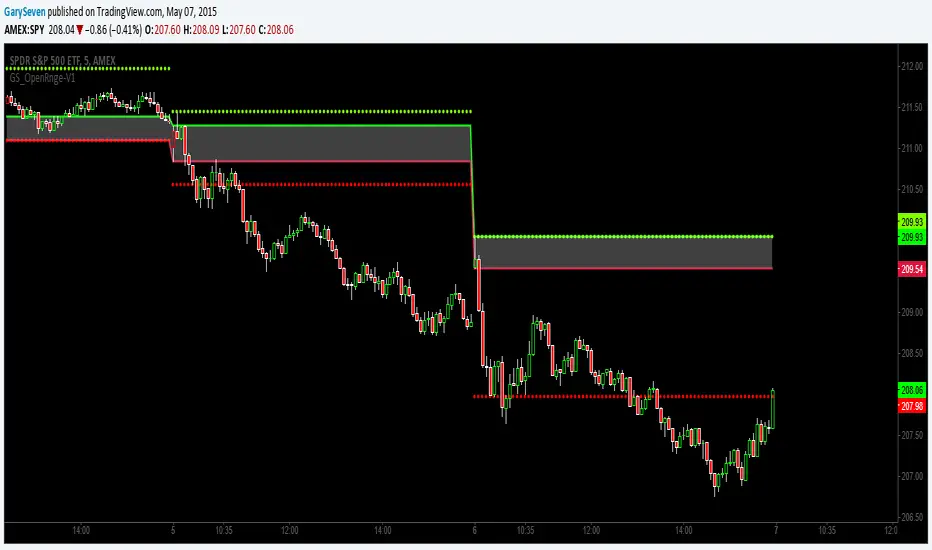
GS_Opening-Range-V1ORB Opening Range Breakout 5 and 3O Minute Indicator
Kudos to Chris Moody for the inspiration to create my first indicator.
The 5 and 30 run together at times but the scalp would be when the equity breaks the 5 go long or short for the scalp and when it breaks the 30 go for the swing trade.