Rob Hoffman - Overlay SetHere is all the Rob Hoffman (Overlay) Indicator. Will release the rest as a different indicator.
Planned,
1. Stochastic
2. MACD
Alternatively,
Videos
www.youtube.com
Overlay

Coral Trend Indicator [LazyBear]This is a famous trend indicator in MT4 platform. Is this better than other MA based trend systems? I will let you decide that :)
Supported modes:
- Trend mode: This is the default. Draws a trend line (like MA) and colors them based on the trend.
- Ribbon Mode: Shown at the bottom pane. No trend lines are drawn.
- OverlayMode: Bars are colored based on the current trend. Trend line is also displayed (default color=gray).
Complete list of all my indicators:
docs.google.com

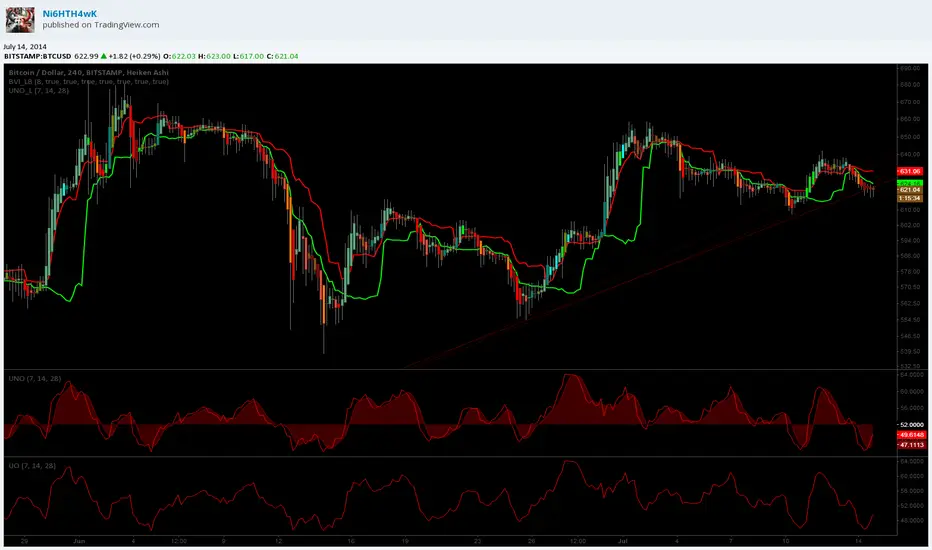
[LAVA] UNO OverlayEDIT: Ignore the comments... I can't get the update to show due to hard brackets " " being censored for some reason.... but they show up in here so this is where the updates will show.
This is the Ultimate (Nonlinear) Oscillator in overlay format. Took me a while to figure out the best configuration and finally found this one. From what I've observed, this is basically a support/resistance line indicator. When the candle moves thru the supporting/resisting line, its a entry/exit point or an indicator that the opposite side should be targeted depending on the market condition. Ignore the wicks as they go thru the line constantly.
Go here to see updates...
pastebin.com