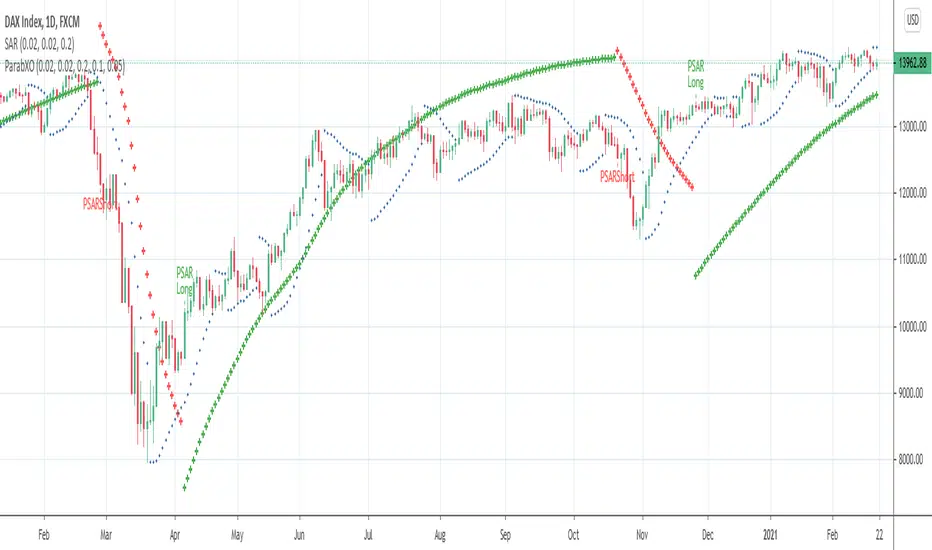
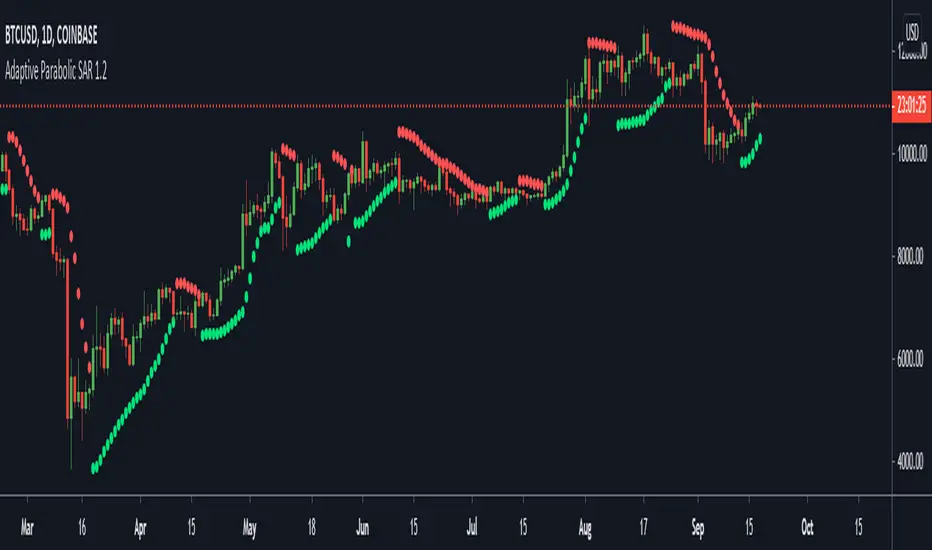
ParabxotThis indicator is a modified Parabolic SAR (Stop And Reverse) created by Dennis Meyers in 2001 in order to avoid the typical whipsaws produced in ranging, non-trending markets. Parabxot does not reverse unless the price penetrates the previous SAR level by a specified amount. Also it increases (decreases) the initial distance of the SAR level by adding (substracting) a predefined percentage amount to the Parabolic starting value.
The thresholds can be adjusted using the following parameters:
xo controls the percentage amount added or substracted to the last Parabolic SAR value in order to allow a change in direction in the indicator.
xpr defines how much should be added to the previous highest high (in case of a bearish reversal) or substracted to the previous lowest low (in case of a bullish reversal), expressed as a percentage of price.
Setting xo and/or xpr to zero disables the filters and the indicator behaves as the original Parabolic SAR.
Reference
Meyers, Dennis (2001), The Improved Parabolic + Noise Filter System
パラボリック・ストップ&リバース (PSAR)

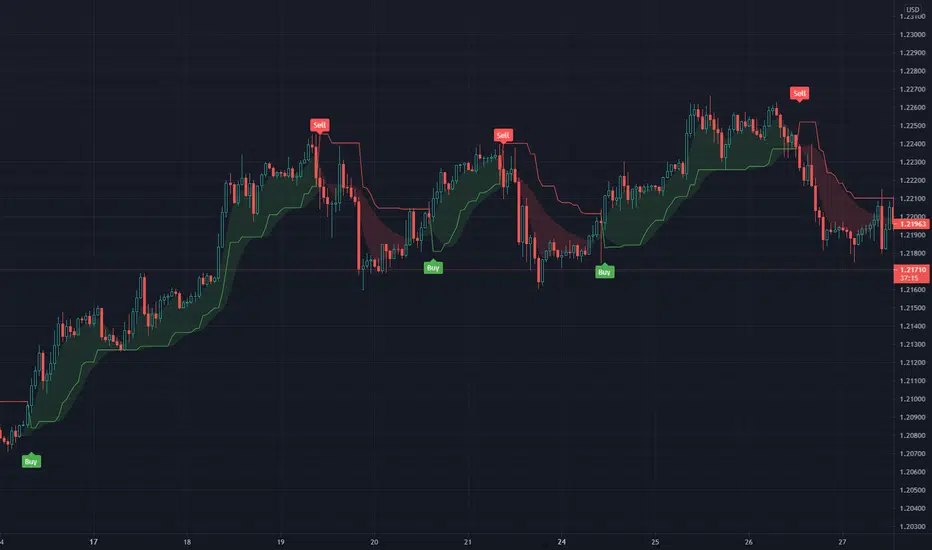
TKP T3 Trend With Psar BarcolorThis script is adapted from TKP's long/short indicator to initiate buy/sell indications when price crosses the T3 moving averages, and when the T3's themselves cross. Bars change colors based on price over/under T3 and T3 up or down or This allows for simple visual analysis of trend direction along with entries, exits, and stop loss values.

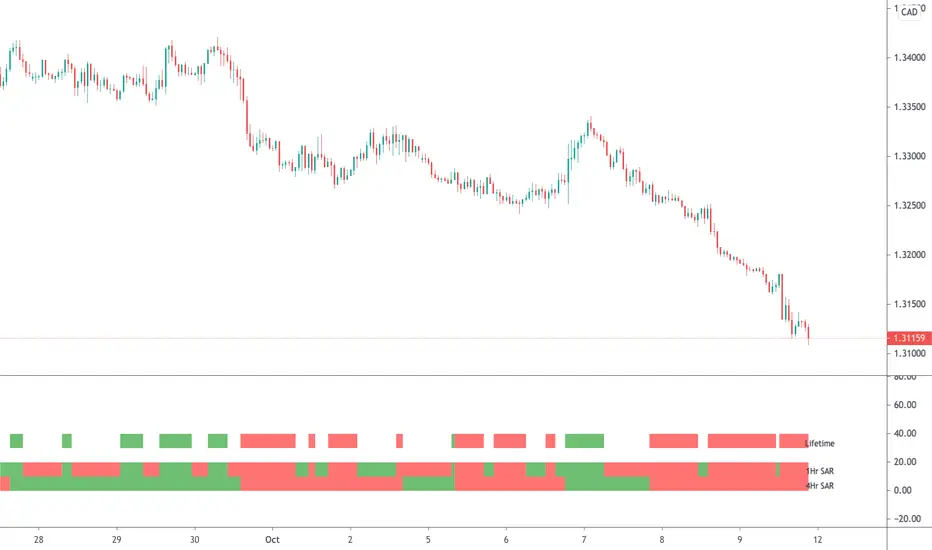
Parabolic SAR (MTF)This is a multi-timeframe Parabolic SAR indicator which uses 1 and 4 hour charts.
Using this indicator is simple, if the LifeTime line is green then buy, if red then sell OR don't trade. So...
Green Line - This strategy is in a buy position
Red Line - This strategy is in a sell position
Any other colour - DON'T TRADE
The traders approach is simple, when all indicators are green or red, then take the trade. As soon as one indicator changes, then re-evaluate using your normal process, such as price action, to determine whether to close the trade or continue.
If you require any further information or script modifications, please message me.
PLEASE CHECK OUT MY OTHER SCRIPTS
Supertrend (MTF) & Parabolic SAROne of my mixed approach strategy indicators which includes:
- Parabolic SAR
- 1 Hour Supertrend
- 4 Hour Supertrend
Whilst this script may appear slow due to the 4hr Supertrend, it does a great job of managing breakouts.
Using this indicator is simple, if the line labeled Lifetime is green then buy, if red then sell OR don't trade. So...
Green Line - This strategy is in a buy position
Red Line - This strategy is in a sell position
Any other Color - DON'T TRADE
The traders approach is simple, when all indicators are green or red, then take the trade. As soon as one indicator changes, then re-evaluate using your normal process, such as price action, to determine whether to close the trade or continue.
If you require any further information or script modifications, please message me.
PLEASE CHECK OUT MY OTHER SCRIPTS

DXY Helper for Binary Option by MrTuanDoanThe US Dollar Index (DXY) is really important for Binary traders who looking for setups on USD pairs.
With this indicator, you dont need another chart or switching between your current USD-pair chart and DXY chart.
What's the different with normal DXY?
THE DAILY GAP
If you know what happens when there is a GAP in DXY, this is your indicator.
FYI: I'll wait for the GAP TO BE FILLED. That means other USD-pairs will follow that "filling" direction.
Functions:
Draw DXY chart on other chart
Added Double Bollinger Bands
Added Parabolic SAR for the trend
Added GAP detection on chart
Added alert for GAP
Please always follow your Risk Managment

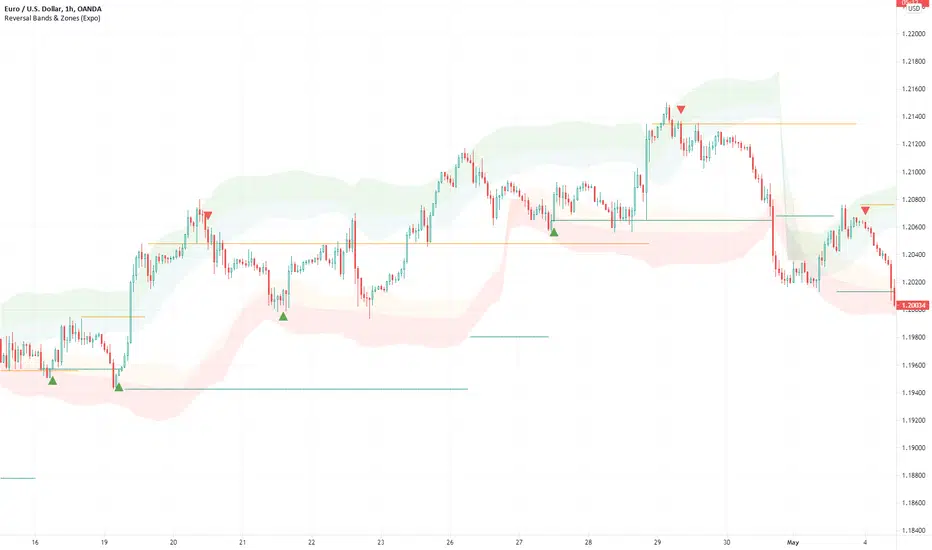
Reversal Bands & Zones (Expo) "It has never been easier to find high probability trades"
Reversal Bands & Zones (Expo) is an algorithm that analyzes the market in real-time and identifies reversal points, key market zones, and trends. The advanced and unique reversal bands act as support & resistance zones, and together with the trend tracking feature, it serves as a trend confirmation. The real-time market zones are displayed where there is a high probability of finding support/resistance. The algorithm does also map out key pivot levels based on the current market structure.
> Reversal points and key market zones have alerts.
Real-time
No repainting
Works on any market and in any timeframe
The indicator can be used standalone or as a part of your current trading strategy.
☖ Reversals
The algorithm identifies areas of potential turning points, these are displayed as Upper and Lower Reversal Cloud. When the price hits the cloud and bounces off there is a high probability that the price will reverse. If the price stays in the reversal cloud, there is a high probability that a trend is forming.
☖ Trends
Positive Trend: If the price is in or close to the upper green reversal band and above the trend- tracking line, we can be sure that the market is in a positive trend until the price crosses down from the reversal cloud and the trend tracking line.
NegativeTrend: If the price is in or close to the lower red reversal band and below the trend- tracking line, we can be sure that the market is in a negative trend until the price crosses up from the reversal cloud and the trend tracking line.
☖ Zones
"It hasn't been easier to display, in real-time, one of the most important and useful technical analysis, namely key support and resistance zones"
The algorithm analyzes the market structure in real-time and maps out key supply/resistance and demand/support zones. The user gets an instant understanding of the market structure. Support and resistance can be used to determine the range of a market, to trade reversals, bounces, or breakouts.
☖ Pivots
The indicator does also displays key pivot levels. Pivots can be used to determine the range of a market, to trade reversals, bounces, or breakouts.
HOW TO USE
- Use the indicator to identify reversals.
- Use the indicator to identify the range of the market.
- Use the indicator to identify key support/resistance zones.
- Use the indicator to identify trends.
INDICATOR IN ACTION
1-hour chart
I hope you find this indicator useful , and please comment or contact me if you like the script or have any questions/suggestions for future improvements. Thanks!
I will continually work on this indicator, so please share your experience and feedback as it will enable me to make even better improvements. Thanks to everyone that has already contacted me regarding my scripts. Your feedback is valuable for future developments!
-----------------
Disclaimer
Copyright by Zeiierman.
The information contained in my scripts/indicators/ideas does not constitute financial advice or a solicitation to buy or sell any securities of any type. I will not accept liability for any loss or damage, including without limitation any loss of profit, which may arise directly or indirectly from the use of or reliance on such information.
All investments involve risk, and the past performance of a security, industry, sector, market, financial product, trading strategy, or individual’s trading does not guarantee future results or returns. Investors are fully responsible for any investment decisions they make. Such decisions should be based solely on an evaluation of their financial circumstances, investment objectives, risk tolerance, and liquidity needs.
My scripts/indicators/ideas are only for educational purposes!
ACCESS THE INDICATOR
• Contact me on TradingView or use the links below
matty pips strategyFor education purpose. Applied only for Matty Pips Strategy. Arrow will appear when bollingerband + sar + binary with temito are in the same OB/OS.

Compact Self-Adjusting Parabolic SARA custom version of the Self-Adjusting Parabolic SAR that can be used as a source for your trading frameworks and indicators.
It is presented on the preview as a -signal line that replicates Self-Adjusting Parabolic SAR state.
Here is an example of how it works with Buy/Sell/TP/SL/TSL Alerts Module :
If you have any questions don't hesitate to ask and contact me either via private messages on TradingView or via Telegram.

ATR + PSAR Trailing Stop (Expo)This ATR + PSAR Trailing Stop indicator is unique. It comes with new ways of calculating ATR and PSAR to enhance performance and accuracy as well as give clarity in trends. The indicator can be used standalone or as a part of your current trading strategy.
ATR + PSAR Trailing Stop (Expo) is a trailing stop indicator that combines ATR and PSAR to enhance the calculation of the trailing stop. This indicator works well in all types of markets, for example, in a trading range or in a trending market, etc.
The user can choose between the following ATR Settings:
Quick ATR
Adaptive ATR
Follow the price closely - ATR
Standard ATR
Trend ATR
The user can enable Trend ATR which displays the overall market structure. If the Trend ATR line is above the price we have a negative market structure, and if the Trend ATR line is below the price we have a positive market structure.
Real-time
No repainting
Works on any market and in any timeframe
HOW TO USE
- Use the ATR + PSAR Trailing Stop as a stop-loss.
- Use the indicator for taking a position when price crosses the ATR trailing line or taking a position when price crosses the PSAR circles.
- Use the indicator to identify the current market structure and trend.
The indicator can be used standalone or as a part of your current trading strategy.
INDICATOR IN ACTION
1-hour chart
I hope you find this indicator useful , and please comment or contact me if you like the script or have any questions/suggestions for future improvements. Thanks!
I will continually work on this indicator, so please share your experience and feedback as it will enable me to make even better improvements. Thanks to everyone that has already contacted me regarding my scripts. Your feedback is valuable for future developments!
-----------------
Disclaimer
Copyright by Zeiierman.
The information contained in my scripts/indicators/ideas does not constitute financial advice or a solicitation to buy or sell any securities of any type. I will not accept liability for any loss or damage, including without limitation any loss of profit, which may arise directly or indirectly from the use of or reliance on such information.
All investments involve risk, and the past performance of a security, industry, sector, market, financial product, trading strategy, or individual’s trading does not guarantee future results or returns. Investors are fully responsible for any investment decisions they make. Such decisions should be based solely on an evaluation of their financial circumstances, investment objectives, risk tolerance, and liquidity needs.
My scripts/indicators/ideas are only for educational purposes!
ACCESS THE INDICATOR
• Contact me on TradingView or use the links below
Adaptive Parabolic SARThis is part 7 of 11 in the system named Ninetales/Volt V2 you can find on Tradingview. Add custom values to backtest, it will return the most accurate of them.
DTC_ZoneThis Indicator can be used for finding the supply and demand zone. Supply and demand has been fetched from the past 10 days volatility of the particular stock. And the main thing is the target and stop-loss were arrived based on the Fibonacci retracement.

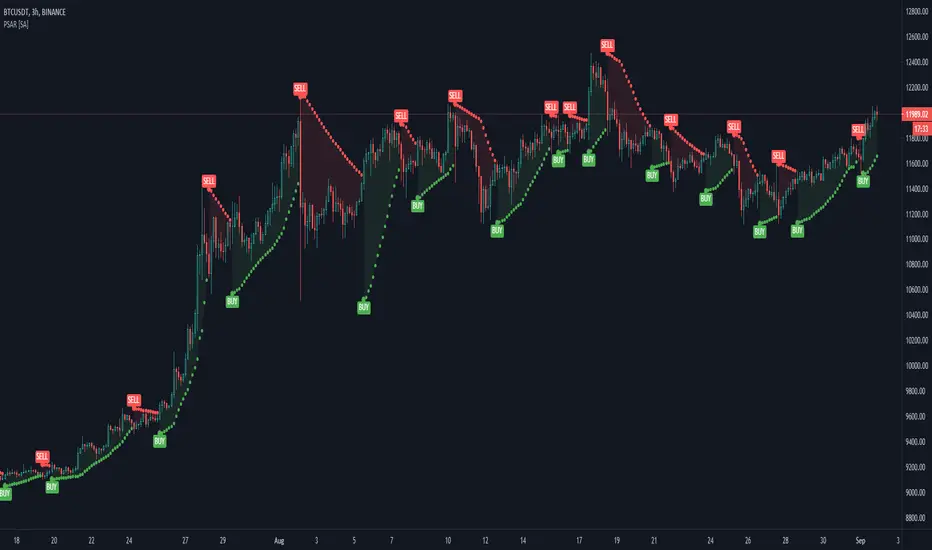
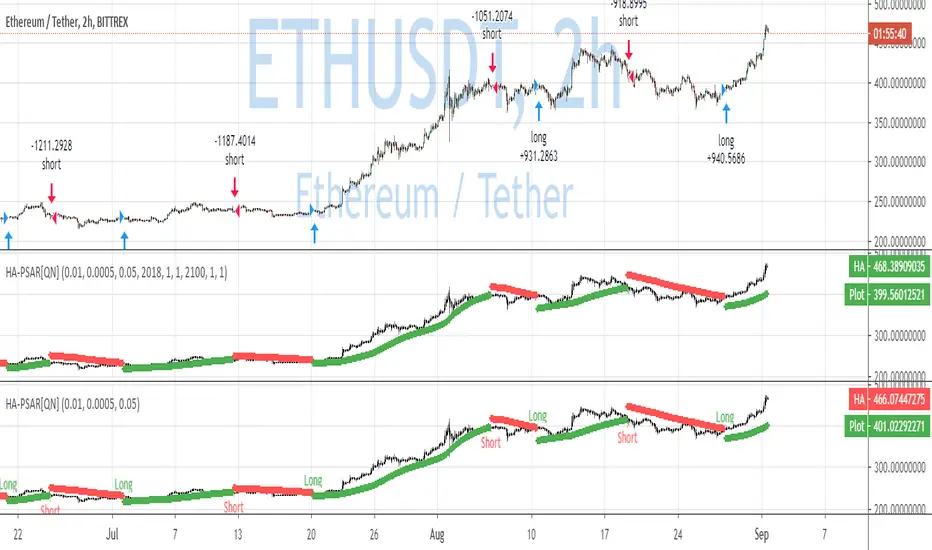
QuantNomad - Heikin-Ashi PSAR AlertsUsing this script you can create alerts for my Heikin-Ashi PSAR Strategy:
When creating alerts use "Once Per Bar Close" in parameters.
####################
Disclaimer
Please remember that past performance may not be indicative of future results.
Due to various factors, including changing market conditions, the strategy may no longer perform as good as in historical backtesting.
This post and the script don’t provide any financial advice.
Gastitan MA-cross/RSI/PSARThis script gives
moving average cross alert
RSI alert when change from bull to bear, and viceverse
Parabolic sar indicator
Also you have a panel with the current price and RSI values.

TEC_MapHack_Sub2_Chart_ver_2.0.0본 지표는 PSAR + Bollinger Bands 를 사용해 추세를 나타내는 지표입니다.
배경색이 붉은색이면 상승추세, 파란색이면 하락추세를 나타냅니다.
PSAR과 BollingerBands 중심선을 기준으로 추세를 알아냅니다.
These are indicators of trends using PSAR + Bollinger Bands.
A red background indicates an upward trend, while a blue one indicates a downward trend.
Identify trends based on the centerlines of PSAR and BollingerBands.

One-Stop Trading SetupOne-Stop Trading Setup:
This script designed to identify up, down, and sideways trends. 200 HMA, 9 EMA, PSAR, and ATR are used to identify the strength of any instrument.
Candle Colors - Simpler approach to follow:
Green color indicates for up side trade signals
Red color indicates for down side trade signals
Yellow color can be interpreted for stop, sideways, and counter trade trade signals
Multiple Trade Setups:
Green Zone - Trading green candles within green zone has better odds of long trades
Red Zone - Trading red candles within red zone has better odds of short trades
200 HMA - Candles above 200 HMA mostly for long trades. Candles below 200 HMA usually for short trades. But the zone also very important to consider
9 EMA - Cross over above 200 HMA in Green zone, look for long trades. Cross over below 200 HMA in red zone, look for short trades
PSAR - This can be used as potential initial warning sign. Also can be used to exit partial or wait for it goes to opposite side for taking trade decisions
Candle Above all - If Green candle and above all the indicators, then very good sign of long side. If red candle and below all indicators, then very good sign of short side.
Multiple Time Frame:
This works very well with any instrument and on any time frame. Always its better to do analysis on multi time frame before entry, exit, and trade execution. Back test it with this setup and also observe it on live market. That will give edge in taking trade decisions. All the best and happy trading.
Disclaimer:
This script and setup is written with the sole purpose of identifying the strength of any instrument. Interpretation, trade decisions, and changing inputs are up to each individual users/trades.
Jackrabbit.modulus.ParabolicSARThis is the Parabolic SAR (stop and reverse) for the Jackrabbit suite and modulus framework.
This indicator supports differential timeframe analysis and confirmational bias. Dynamic timeframes are supported.
The main indicatior and the confirmational indicator can both be individually tuned for the following:
Start, the starting value for the acceleration factor.
Increment,m, determines how fast to increase the acceleration factor.
Maximum, the maximum value of the acceleration factor.
The Jackrabbit modulus framework is a plug in play paradigm built to operate through TradingView's indicator on indicatior (IoI) functionality. As such, this script receives a signal line from the previous script in the IoI chain, and evaluates the buy/sell signals appropriate to the current analysis. The results are either combined with the signal line, or used as confirmation to the signal line. A new signal line is generated for the next script in the link.
This script is not designed or meant to function outside my framework.
By default, the signal line is visible and the charts are turned off. Signal line visibility is controlled by the Style tab, and the charts display is controlled by the indicator settings tab.
This script is by invitation only. To learn more about accessing this script, please see my signature or send me a PM. Thank you.

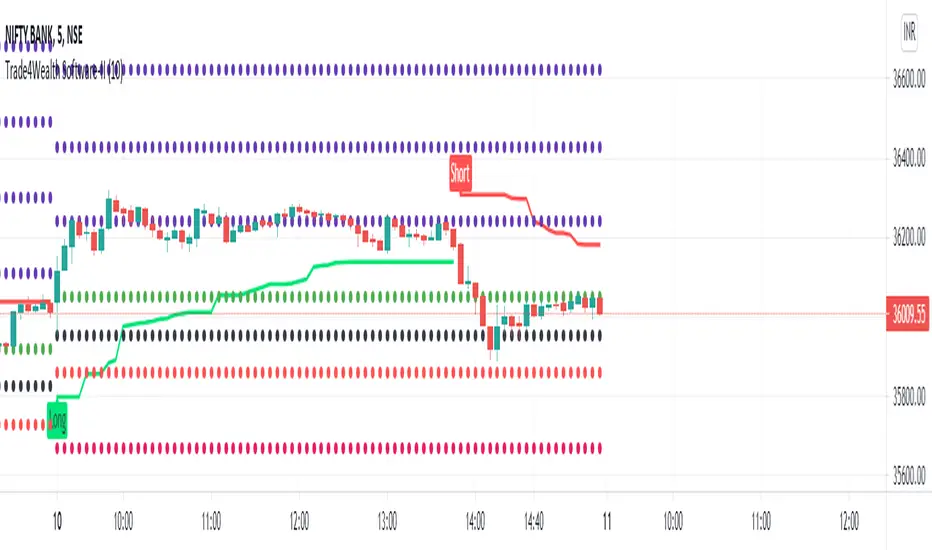
Trade4Wealth Software-IITrade4wealth Software-II
DESCRIPTION:
This Alert indicator utilizes the Heiken Ashi with non-lag EMA was a scalping and intraday trading. There is also included filtering on MACD direction and trend direction as indicated by two MA: SMA (20) and EMA (50). The Heiken Ashi candles are great as price action trending indicator, they shows smooth strong and clear price fluctuations with price.
Financial Markets: NSE/BSE/MCX
> Optimised settings for 3 min, 5 min and 15 min Time Frame.
Indicators used in calculations:
> MACD 2 colour (5,9,3)
> EMA, period 50
> SMA, period 20
> Non lag EMA , period 20
Generate Alerts use the following Trading Rules:
> Heiken Ashi with non-lag dot
> Trade only in direction of the trend.
> UP trend : MA 20 period is above EMA 50 period.
> Down trend : MA 20 period is below EMA 50 period.
How to use:
> Use software with Default Settings.
For Buy :
> If 20 SMA (i.e. Green Line) Crosses 50 EMA (i.e. Red Line) from lower to upper side than Buy.
> Zone & Parabolic Sar both must be Green for Buy.
For Sell :
> If 20 SMA (i.e. Green Line) Crosses 50 EMA (i.e. Red Line) from upper to lower side than Sell.
> Zone & Parabolic Sar both/ must be Red for Sell.
HINTS:
- Good positions occur when MACD crosses the Zero line.
- Large Heikin Ashi candles with small wicks in direction of trend are good strong trends.
How to get access:
Please click on the link in the signature or send me a private message to get access.
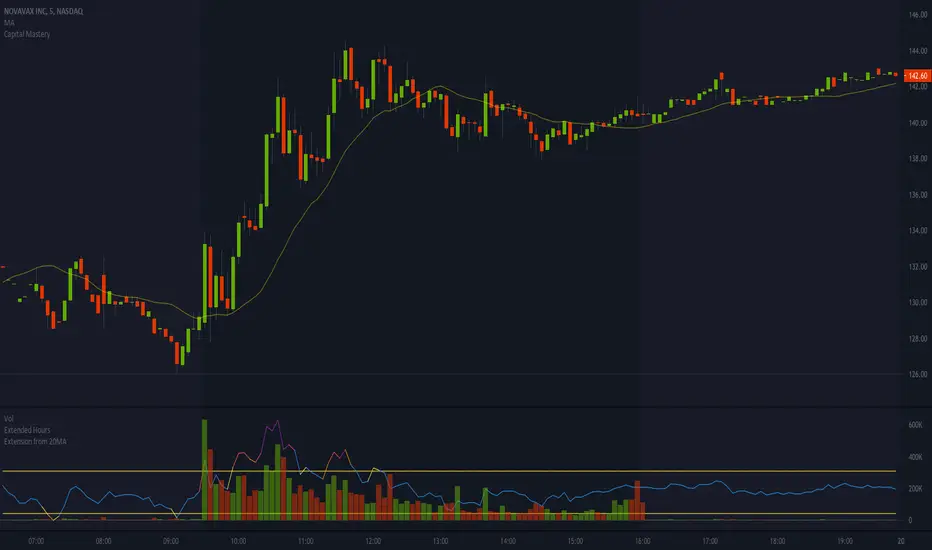
Extension from 20 Period Simple Moving AverageSimple indicator to help show when stocks are over extended intraday. It's based on the distance between a stock and it's moving average. The thesis being that, the farther away a stock is from it's 20 period simple moving average, the move extended it is. I've found that when a stock is more than 2-3% extended from it's 5min 20 period moving average, it's typically getting over extended, and can be a great time to start considering a short.
I primarily use this indicator when shorting intraday parabolic moves, while the stock is still on the frontside of the move. Note that this works best when the indicator is showing overextended AND there's a volume spike/mountain matching the overextension. In the attached example, you can see that I overlay this indicator on top of the volume panel because it helps me better visualize when the stock is getting over extended on heavy/elevated volume.
Hope this helps; any feedback is appreciated!
P.S. This works best on a 5min chart, but I'm sure it could be helpful on other timeframes, but may need to tweak the default outer bounds percentage.
mForex - 3 Moving Average - Parabolic SARScript identifies the uptrend and downtrend according to the average price of the MA and PSAR lines.
Rules of sale:
- Open short positions when:
MA12 cuts MA26 and MA52 from the top.
PSAR dots on the price line
- Stop loss:
At the dots of PSAR and use Trailing Stop facing up
On the nearest peak
- Profit-taking: Corresponding ratio of R: R (1: 2)
- Open long positions when:
MA12 cuts MA26 and MA52 from the bottom.
PSAR dots below the price line
- Stop loss:
At the dots of PSAR and use Trailing Stop facing down
Below the nearest peak
- Profit-taking: Corresponding ratio of R: R (1: 2)

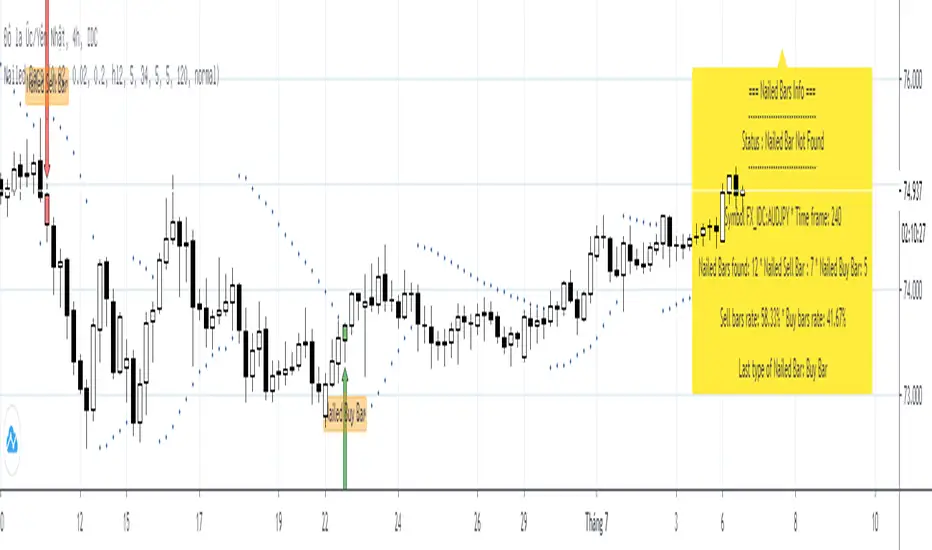
Nailed BarsNailed bars was introduced by Joy22 in an article "Pip Nailer Trading System" submit on forexstrategiesresources on 06/01/2012
Rule of Nailed Bars is below:
1. Nailed Sell Bar:
* PSAR appears above the bar
* The Awesome Oscillator (AO) turns red
* The Accelerator Oscillator (AC) turns red
2. Nailed Buy Bar:
* PSAR appears below the bar
* The Awesome Oscillator (AO) turns green
* The Accelerator Oscillator (AC) turns green
=== About this indicator: Nailed Bars ===
This indicator is detecting all nailed bars was appeared on chart and display infomations in a panel. So traders who are using "Pip Nailer Trading System" can easily control the trade.
Candle Color GeneratorCandle Color Generator:
This indicator is designed to highlight the candle colors based on the combinations of Parabolic SAR (PSAR) and 2 Hull Moving Averages (HMA).
Colors:
Yellow, Red, and Green colors are used to describe the candle colors depends on its position to PSAR and 2 HMAs.
PSAR:
PSAR position above or below candle position is differentiated by Red and Green colors
HMAs:
As default settings 20 HMA is considered as lower period and 50 HMA is considered period for the calculation
Trade What You See:
This indicator will help to see how the setup of particular instrument coming up. Users/Traders can use and trade based on what they see and interpret from it.
Disclaimer:
Idea of publishing this script is to identify the strength of the instrument using multiple confirmation.
Using this indicator, changing inputs (show/hide/change period), and trading decisions are up to the users/traders.
Courtesy:
Thanks to inventors of HMA (Alan Hull), PSAR(Welles Wilder) as these inputs are used to make some calculations
