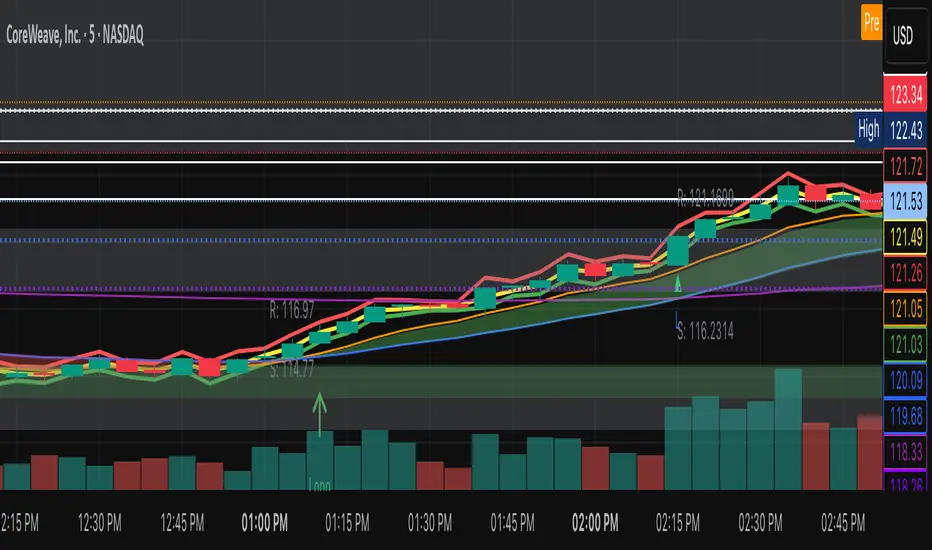
Pullback Finder AutoPullback Finder Auto — Intraday Momentum Cooling Detector
Pullback Finder Auto is designed to find stocks that have made a strong intraday run from the open and are now cooling off while still positive — the classic pullback zone where continuation entries often form.
It automatically measures the percentage change from today’s open and highlights bars where:
the stock has already run at least a chosen amount (for example +10 % above its open), and
the current price is still up but within a defined pullback range (for example between +3 % and +8 % above the open).
When those two conditions are met, you’ll see green graphics on your chart:
Green triangle markers under the candle.
Optionally, small green PB labels such as “PB 5.2 %” showing the exact percentage from open when the setup occurs.
A green highlight in the sub‑window or line plot if you left the “Change from Open %” plot active.
These are your visual cues that a pullback has formed — a stock that previously ran and is now pulling back while holding strength.
How it works
The script continuously monitors:
• High % from Open = (high − open) / open × 100
• Current % from Open = (close − open) / open × 100
A “Pullback” condition triggers only if:
the high % is greater than or equal to your minimum run threshold, and
the current % sits between your minimum and maximum pullback percentages.
When both are true, the indicator plots the green triangle and optional label.
Default parameters
Min Run % = 10
Min Current % = 3
Max Current % = 8
Session Start = 09:30 – 16:00 US Eastern
All can be changed to fit different volatility levels.
Lower values catch smaller moves; higher values restrict signals to explosive runners.
Using it in real time
During live trading, Pullback Finder Auto updates with each candle.
When a bar first enters the target zone, a green triangle and PB label will appear immediately under that candle.
These are dynamic: if price moves out of the valid zone on the same bar, the marker may disappear.
You can create an alert on “Pullback Finder Auto – Pullback Candidate” to be notified whenever new triangles appear across your active symbols.
This works on any timeframe:
use shorter timeframes such as 1‑minute or 5‑minute charts for fast, intraday detection,
use longer timeframes for a broader view of the day’s market structure.
Using it on past data (scanning backwards)
When you scroll back through history, past green triangles remain visible at every bar where the condition was true at that time.
The PB labels next to those candles show exactly how far above the open the stock was trading during the historical setup.
Use this for visual back‑testing: study how price reacted after these pullback points, adjust the thresholds, and refine your criteria for different markets.
The grey or teal line under the chart (if enabled) shows the percent‑from‑open curve so you can see the full run‑and‑cool pattern leading into each triangle signal.
If you convert the indicator into a strategy, the same condition becomes historical entry points you can test with the Strategy Tester.
Summary
1. Pullback Finder Auto paints green triangles and PB labels whenever an intraday pullback fits your criteria.
2. It runs dynamically in real‑time and also preserves markers for historical review.
3. Adjust the thresholds to match volatility or timeframe.
4. Ideal for visual scanning, watchlist alerts, or integration into a lightweight screening strategy.
ピボットポイントと水準

Daily Pivot Points LEVELS S-RThis indicator plots daily pivot points based on the previous day’s high, low, and close. It displays the main pivot line, as well as the first levels of support (S1) and resistance (R1), with optional second levels (R2, S2) for additional reference. Ideal for
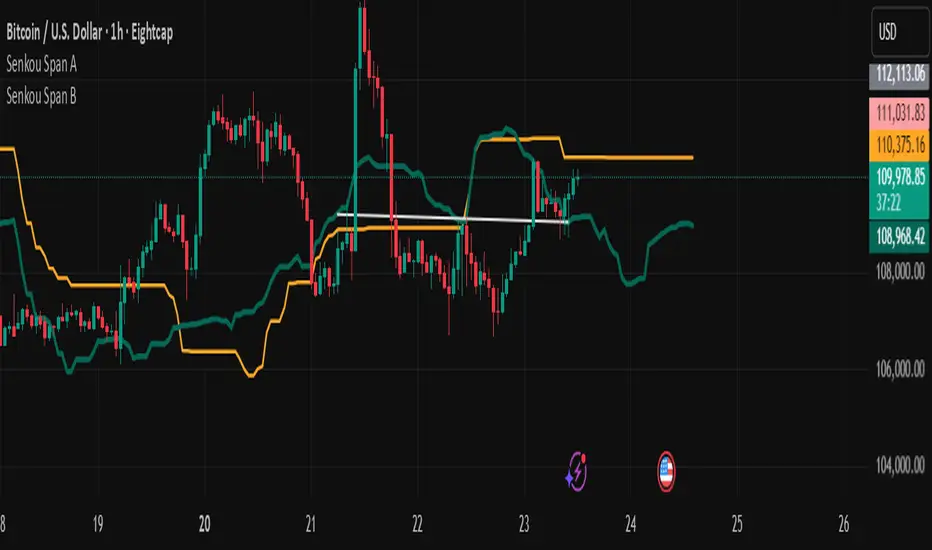
Senkou Span BUsing in conjunction with Senkou Span A to create effective kumo alert signals when kumo changes direction: bullish or bearish.
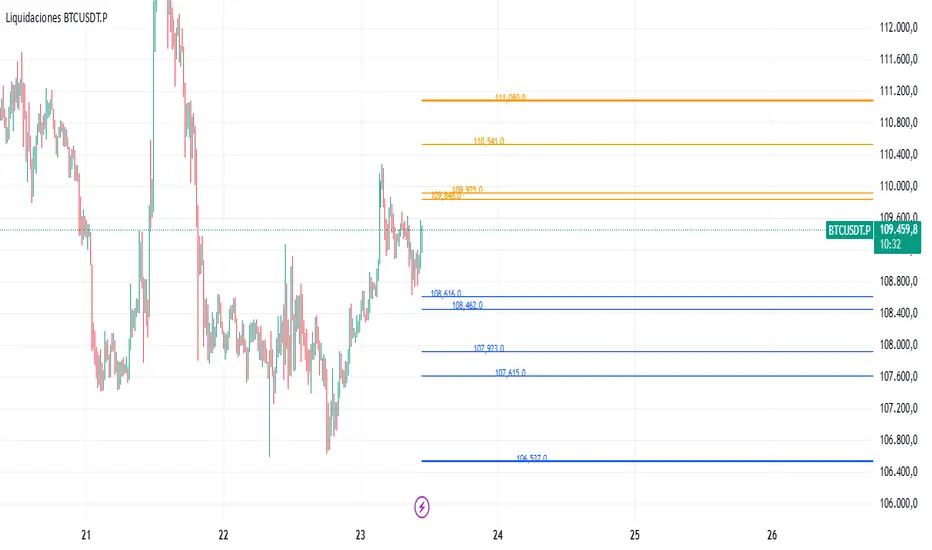
Liquidaciones BTCUSDT.PAllows you to manually record liquidation prices for both short and long positions, which are then displayed on the chart:
Orange: Short liquidations
Blue: Long liquidations
Optionally, a specific liquidation price can be highlighted to indicate higher-volume liquidations
Note: All liquidation prices must be entered manually.
RSI Breakout Zones█ OVERVIEW
“RSI Breakout Zones” is a technical analysis tool that identifies significant zones on the chart based on the Relative Strength Index (RSI). The indicator maps overbought (OB) and oversold (OS) zones using boxes, then extends them until the next zone of the same type is detected, highlighting breakout points to aid in trade entry decisions. These zones often serve as areas of consolidation, support, or resistance.
█ CONCEPTS
The indicator identifies overbought (above 70) and oversold (below 30) zones, drawing boxes that extend until the next zone of the same type (OB for OB, OS for OS) is detected. Breakout signals are generated when the price crosses the zone boundaries, indicating potential shifts in market momentum.
Why are RSI zones important? These zones represent areas of extreme market sentiment, often leading to corrections or reversals. Overbought zones suggest potential selling pressure, while oversold zones indicate buying opportunities. After a breakout, a zone may switch roles, e.g., from support to resistance or vice versa, making it a key element in price action analysis. Larger zones, formed during high volatility, may attract price for retests due to stronger imbalances in buyer/seller dynamics. Consolidation often occurs within these zones as the market seeks equilibrium before further moves. However, in strong trends, zones may be decisively broken without immediate pullbacks, and their significance depends on their position relative to key support and resistance levels.
█ FEATURES
- RSI Zone Detection: Calculates RSI with a customizable length (default 14) and identifies overbought/oversold zones based on user-defined levels (default 70/30), drawing boxes that dynamically adjust to price action within the zone.
- Customizable Boxes: Zones extend until the next zone of the same type is detected. The indicator draws zones with adjustable colors for overbought (red) and oversold (green) areas, with options for box and zone transparency.
- Breakout Signals: Generates upward (green triangle) and downward (red triangle) breakout signals when the price crosses the top or bottom of a zone. Signals appear below or above the bar, indicating potential trade entry points.
- Midline: Automatically draws a dashed line at the midpoint of each zone, helping traders assess price behavior within the zone and potential halfway retests.
- Box Management: Option to remove outdated boxes.
- Alerts: Built-in support for alerts on breakout signals, enabling traders to receive notifications for key zone crossings.
█ HOW TO USE
Add to Chart: Apply the indicator to your TradingView chart via the Pine Editor or Indicators menu.
Configure Settings:
- RSI Settings: Adjust RSI Length (default 14), Overbought Level (default 70), and Oversold Level (default 30) to tailor zone detection sensitivity—higher lengths smooth signals for longer-term analysis.
- Box Settings: Configure colors and transparency for overbought (red) and oversold (green) zones, including box transparency (default 90) and zone transparency (default 90).
- Signal Settings: Customize breakout signal colors (green for upward, red for downward) and enable/disable keeping boxes after RSI normalization.
Interpreting Signals:
- Upward Breakout Signal: A green triangle below the bar indicates a breakout, suggesting potential bullish momentum and trend continuation or reversal.
- Downward Breakout Signal: A red triangle above the bar indicates a breakout, suggesting potential bearish momentum.
- RSI Zones: If the price re-enters a zone after a breakout, it may signal a false breakout or consolidation; persistent zones can act as future support/resistance levels. Consolidation often occurs within these zones as the market seeks equilibrium.
- Use signals alongside other technical analysis tools for confirmation, such as moving averages (to confirm trend direction), Fibonacci levels (to identify key price zones), or volume indicators (to validate breakout strength). Analyze RSI zones on higher timeframes for stronger signals due to broader market context.
█ APPLICATIONS
- Momentum Trading: Use RSI zones as overbought/oversold filters. In an uptrend, look for buying opportunities on upward breakouts, and in a downtrend, on downward breakouts. Combining with MACD crossovers, Fibonacci levels, or pivot points enhances zone significance.
- Inter-Zone Trading: Utilize breakouts from one RSI zone and hold the position until reaching the next zone, which may act as a target level or reversal point.
█ NOTES
- Test the indicator across different timeframes and markets (stocks, forex, crypto) to optimize RSI length and levels for your trading style.
- For best results, use in trending markets where RSI extremes are more predictive; in ranging markets, additional filters are recommended to reduce false signals.
- Always combine with risk management; RSI zones alone do not guarantee reversals, and false breakouts may occur in low-liquidity environments.

Adaptive Trend 1m ### Overview
The "Adaptive Trend Impulse Parallel SL/TP 1m Realistic" strategy is a sophisticated trading system designed specifically for high-volatility markets like cryptocurrencies on 1-minute timeframes. It combines trend-following with momentum filters and adaptive parameters to dynamically adjust to market conditions, ensuring more reliable entries and risk management. This strategy uses SuperTrend for primary trend detection, enhanced by MACD, RSI, Bollinger Bands, and optional volume spikes. It incorporates parallel stop-loss (SL) and multiple take-profit (TP) levels based on ATR, with options for breakeven and trailing stops after the first TP. Optimized for realistic backtesting on short timeframes, it avoids over-optimization by adapting indicators to market speed and efficiency.
### Principles of Operation
The strategy operates on the principle of adaptive impulse trading, where entry signals are generated only when multiple conditions align to confirm a strong trend reversal or continuation:
1. **Trend Detection (SuperTrend)**: The core signal comes from an adaptive SuperTrend indicator. It calculates upper and lower bands using ATR (Average True Range) with dynamic periods and multipliers. A buy signal occurs when the price crosses above the lower band (from a downtrend), and a sell signal when it crosses below the upper band (from an uptrend). Adaptation is based on Rate of Change (ROC) to measure market speed, shortening periods in fast markets for quicker responses.
2. **Momentum and Trend Filters**:
- **MACD**: Uses adaptive fast and slow lengths. In "Trend Filter" mode (default when "Use MACD Cross" is false), it checks if the MACD line is above/below the signal for long/short. In cross mode, it requires a crossover/crossunder.
- **RSI**: Adaptive period RSI must be above 50 for longs and below 50 for shorts, confirming overbought/oversold conditions dynamically.
- **Bollinger Bands (BB)**: Depending on the mode ("Midline" by default), it requires the price to be above/below the BB midline for longs/shorts, or a breakout in "Breakout" mode. Deviation adapts to market efficiency.
- **Volume Spike Filter** (optional): Entries require volume to exceed an adaptive multiple of its SMA, signaling strong impulse.
3. **Volatility Filter**: Entries are only allowed if current ATR percentage exceeds a historical minimum (adaptive), preventing trades in low-volatility ranges.
4. **Risk Management (Parallel SL/TP)**:
- **Stop-Loss**: Set at an adaptive ATR multiple below/above entry for long/short.
- **Take-Profits**: Three levels at adaptive ATR multiples, with partial position closures (e.g., 51% at TP1, 25% at TP2, remainder at TP3).
- **Post-TP1 Features**: Optional breakeven moves SL to entry after TP1. Trailing SL uses BB midline as a dynamic trail.
- All levels are calculated per trade using the ATR at entry, making them "realistic" for 1m charts by widening SL and tightening initial TPs.
The strategy enters long on buy signals with all filters met, and short on sell signals. It uses pyramid margin (100% long/short) for full position sizing.
Adaptation is driven by:
- **Market Speed (normSpeed)**: Based on ROC, tightens multipliers in volatile periods.
- **Efficiency Ratio (ER)**: Measures trend strength, adjusting periods for trending vs. ranging markets.
This ensures the strategy "adapts" without manual tweaks, reducing false signals in varying conditions.
### Main Advantages
- **Adaptability**: Unlike static strategies, parameters dynamically adjust to market volatility and trend strength, improving performance across ranging and trending phases without over-optimization.
- **Realistic Risk Management for 1m**: Wider SL and tiered TPs prevent premature stops in noisy short-term charts, while partial profits lock in gains early. Breakeven/trailing options protect profits in extended moves.
- **Multi-Filter Confirmation**: Combines trend, momentum, and volume for high-probability entries, reducing whipsaws. The volatility filter avoids flat markets.
- **Debug Visualization**: Built-in plots for signals, levels, and component checks (when "Show Debug" is enabled) help users verify logic on charts.
- **Efficiency**: Low computational load, suitable for real-time trading on TradingView with alerts.
Backtesting shows robust results on volatile assets, with a focus on sustainable risk (e.g., SL at 3x ATR avoids excessive drawdowns).
### Uniqueness
What sets this strategy apart is its **fully adaptive framework** integrating multiple indicators with real-time market metrics (ROC for speed, ER for efficiency). Most trend strategies use fixed parameters, leading to poor adaptation; here, every key input (periods, multipliers, deviations) scales dynamically within bounds, creating a "self-tuning" system. The "parallel SL/TP with 1m realism" adds custom handling for micro-timeframes: tightened initial TPs for quick wins and adaptive min-ATR filter to skip low-vol bars. Unlike generic mashups, it justifies the combination—SuperTrend for trend, MACD/RSI/BB for impulse confirmation, volume for conviction—working synergistically to capture "trend impulses" while filtering noise. The post-TP1 breakeven/trailing tied to BB adds a unique profit-locking mechanism not common in open-source scripts.
### Recommended Settings
These settings are optimized and recommended for trading ASTER/USDT on Bybit, with 1-minute chart, x10 leverage, and cross margin mode. They provide a balanced risk-reward for this volatile pair:
- **Base Inputs**:
- Base ATR Period: 10
- Base SuperTrend ATR Multiplier: 2.5
- Base MACD Fast: 8
- Base MACD Slow: 17
- Base MACD Signal: 6
- Base RSI Period: 9
- Base Bollinger Period: 12
- Bollinger Deviation: 1.8
- Base Volume SMA Period: 19
- Base Volume Spike Multiplier: 1.8
- Adaptation Window: 54
- ROC Length: 10
- **TP/SL Settings**:
- Use Stop Loss: True
- Base SL Multiplier (ATR): 3
- Use Take Profits: True
- Base TP1 Multiplier (ATR): 5.5
- Base TP2 Multiplier (ATR): 10.5
- Base TP3 Multiplier (ATR): 19
- TP1 % Position: 51
- TP2 % Position: 25
- Breakeven after TP1: False
- Trailing SL after TP1: False
- Base Min ATR Filter: 0.001
- Use Volume Spike Filter: True
- BB Condition: Midline
- Use MACD Cross (false=Trend Filter): True
- Show Debug: True
For backtesting, use initial capital of 30 USD, base currency USDT, order size 100 USDT, pyramiding 1, commission 0.1%, slippage 0 ticks, long/short margin 0%.
Always backtest on your platform and use risk management—risk no more than 1-2% per trade. This is not financial advice; trade at your own risk.

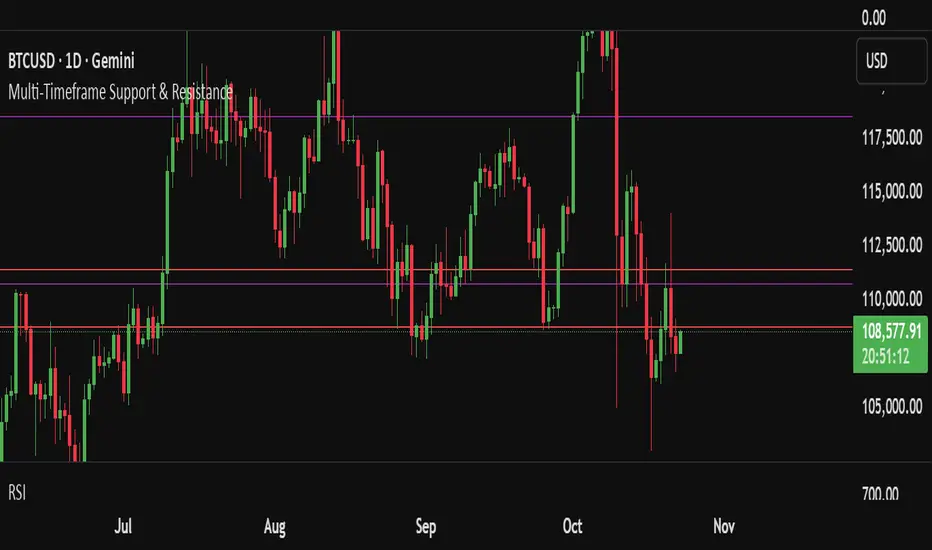
Multi-Timeframe Support & ResistanceThis indicator automatically plots dynamic support and resistance levels across multiple timeframes — including 1H, 4H, 1D, 1W, 1M, and the current chart timeframe. Each level is color-coded for clarity and extends across the chart to highlight key price zones.
**Key Features:**
- ⏱ Multi-timeframe analysis: 6 configurable timeframes
- 🎨 Custom color and style settings for each timeframe
- 📏 Adjustable number of levels per timeframe
- 🧼 Clean chart layout with no duplicate lines
- 🔄 Auto-refresh every 10 bars for up-to-date levels
Support and resistance levels are calculated using historical high/low ranges and evenly distributed across the selected lookback period. This helps traders identify confluence zones, breakout targets, and reversal areas with precision.
Metallic Retracement ToolI made a version of the Metallic Retracement script where instead of using automatic zig-zag detection, you get to place the points manually. When you add it to the chart, it prompts you to click on two points. These two points become your swing range, and the indicator calculates all the metallic retracement levels from there and plots them on your chart. You can drag the points around afterwards to adjust the range, or just add the indicator to the chart again to place a completely new set of points.
The mathematical foundation is identical to the original Metallic Retracement indicator. You're still working with metallic means, which are the sequence of constants that generalize the golden ratio through the equation x² = kx + 1. When k equals 1, you get the golden ratio. When k equals 2, you get silver. Bronze is 3, and so on forever. Each metallic number generates its own set of retracement ratios by raising alpha to various negative powers, where alpha equals (k + sqrt(k² + 4)) / 2. The script algorithmically calculates these levels instead of hardcoding them, which means you can pick any metallic number you want and instantly get its complete retracement sequence.
What's different here is the control. Automatic zig-zag detection is useful when you want the indicator to find swings for you, but sometimes you have a specific price range in mind that doesn't line up with what the zig-zag algorithm considers significant. Maybe you're analyzing a move that's still developing and hasn't triggered the zig-zag's reversal thresholds yet. Maybe you want to measure retracements from an arbitrary high to an arbitrary low that happened weeks apart with tons of noise in between. Manual placement lets you define exactly which two points matter for your analysis without fighting with sensitivity settings or waiting for confirmation.
The interactive placement system uses TradingView's built-in drawing tools, so clicking the two points feels natural and works the same way as drawing a trendline or fibonacci retracement. First click sets your starting point, second click sets your ending point, and the indicator immediately calculates the range and draws all the metallic levels extending from whichever point you chose as the origin. If you picked a swing low and then a swing high, you get retracement levels projecting upward. If you went from high to low, they project downward.
Moving the points after placement is as simple as grabbing one of them and dragging it to a new location. The retracement levels recalculate in real-time as you move the anchor points, which makes it easy to experiment with different range definitions and see how the levels shift. This is particularly useful when you're trying to figure out which swing points produce retracement levels that line up with other technical features like previous support or resistance zones. You can slide the points around until you find a configuration that makes sense for your analysis.
Adding the indicator to the chart multiple times lets you compare different metallic means on the same price range, or analyze multiple ranges simultaneously with different metallic numbers. You could have golden ratio retracements on one major swing and silver ratio retracements on a smaller correction within that swing. Since each instance of the indicator is independent, you can mix and match metallic numbers and ranges however you want without one interfering with the other.
The settings work the same way as the original script. You select which metallic number to use, control how many power ratios to display above and below the 1.0 level, and adjust how many complete retracement cycles you want drawn. The levels extend from your manually placed swing points just like they would from automatically detected pivots, showing you where price might react based on whichever metallic mean you've selected.
What this version emphasizes is that retracement analysis is subjective in terms of which swing points you consider significant. Automatic detection algorithms make assumptions about what constitutes a meaningful reversal, but those assumptions don't always match your interpretation of the price action. By giving you manual control over point placement, this tool lets you apply metallic retracement concepts to exactly the price ranges you care about, without requiring those ranges to fit someone else's definition of a valid swing. You define the context, the indicator provides the mathematical framework.

Scalp BTC/ETH — Reversal & Continuation (v1, Pine v6)Scalp BTC/ETH — Reversal & Continuation (1m à 10m)
Cet indicateur détecte des opportunités de micro-scalping sur futures (BTC/ETH) basées sur deux mécaniques courtes validées par structure de prix :
A) Reversal de pression (contre-mouvement contrôlé)
Détection d’une sur-extension brutale suivie d’une absorption sur la bougie suivante.
Objectif : capturer la première respiration après un excès de prix (rejet court).
B) Continuation courte (momentum + reprise)
Détection de 3 bougies directionnelles consécutives suivies d’un pullback léger, puis signal sur la reprise du mouvement initial.
Gestion intégrée (scénario standard TP dynamique)
TP1 → 50% de la position à un gain fixe (% adaptable au timeframe)
Stop déplacé au Break-Even sur le restant
Sortie finale sur bougie inverse significative
(correction ≥ X% du corps précédent) ou timeout (max bars en trade)
Scalp BTC/ETH — Reversal & Continuation (1m to 10m)
This indicator detects short-term futures scalping setups on BTC & ETH using two mechanical price-action models designed for fast execution:
A) Reversal Compression (counter-move entry)
Identifies a sharp impulse (overextension) followed by absorption / failure to extend on the next candle.
Objective: capture the first corrective pullback after exhaustion.
B) Controlled Continuation (momentum follow-through)
Identifies 3 consecutive trend candles, then a shallow pullback, and triggers an entry on the resumption of the main leg.
Built-in trade logic (dynamic TP structure)
TP1 → scale out 50% of the position at a fixed percentage (auto-scaled per timeframe)
Stop moved to Break-Even after TP1
Final exit on either:
• a meaningful opposite candle (≥ X% correction of prior body), or
• a timeout (max bars in trade)
Technical characteristics
Designed for 1m / 3m / 5m / 7m / 10m
No repainting (bar-close confirmed logic)
Works for both LONG & SHORT
Built-in alert events:
ENTRY_LONG / ENTRY_SHORT / TP1 / EXIT_STOP / EXIT_INVERSE / EXIT_TIMEOUT
Suitable for manual execution, semi-automation (alerts) or full bot integration (webhook JSON)
Purpose
Provide a repeatable, rule-based, non-subjective framework to harvest micro-moves with controlled risk, without relying on lagging indicators or long-term prediction.
(A Strategy / backtesting version is planned as a next iteration.)

Levels[cz]Description
Levels is a proportional price grid indicator that draws adaptive horizontal levels based on higher timeframe (HTF) closes.
Instead of relying on swing highs/lows or pivots, it builds structured support and resistance zones using fixed percentage increments from a Daily, Weekly, or Monthly reference close.
This creates a consistent geometric framework that helps traders visualize price zones where reactions or consolidations often occur.
How It Works
The script retrieves the last HTF close (Daily/Weekly/Monthly).
It then calculates percentage-based increments (e.g., 0.5%, 1%, 2%, 4%) above and below that reference.
Each percentage forms a distinct “level group,” creating layered grids of potential reaction zones.
Levels are automatically filtered to avoid overlap between different groups, keeping the chart clean.
Visibility is dynamically controlled by timeframe:
Level 1 → up to 15m
Level 2 → up to 1h
Level 3 → up to 4h
Level 4 → up to 1D
This ensures the right amount of structural detail at every zoom level.
How to Use
Identify confluence zones where multiple levels cluster — often areas of strong liquidity or reversals.
Use the grid as a support/resistance map for entries, targets, and stop placement.
Combine with trend or momentum indicators to validate reactions at key price bands.
Adjust the percentage increments and reference timeframe to match the volatility of your instrument (e.g., smaller steps for crypto, larger for indices).
Concept
The indicator is based on the idea that markets move in proportional price steps, not random fluctuations.
By anchoring levels to a higher-timeframe close and expanding outward geometrically, Levels highlights recurring equilibrium and expansion zones — areas where traders can anticipate probable turning points or consolidations.
Features
4 customizable percentage-based level sets
Dynamic visibility by timeframe
Non-overlapping level hierarchy
Lightweight on performance
Fully customizable colors, styles, and widths

Inside SwingsOverview
The Inside Swings indicator identifies and visualizes "inside swing" patterns in price action. These patterns occur when price creates a series of pivots that form overlapping ranges, indicating potential consolidation or reversal zones.
What are Inside Swings?
Inside swings are specific pivot patterns where:
- HLHL Pattern: High-Low-High-Low sequence where the first high is higher than the second high, and the first low is lower than the second low
- LHLH Pattern: Low-High-Low-High sequence where the first low is lower than the second low, and the first high is higher than the second high
Here an Example
These patterns create overlapping price ranges that often act as:
- Support/Resistance zones
- Consolidation areas
- Potential reversal points
- Breakout levels
Levels From the Created Range
Input Parameters
Core Settings
- Pivot Lookback Length (default: 5): Number of bars on each side to confirm a pivot high/low
- Max Boxes (default: 100): Maximum number of patterns to display on chart
Extension Settings
- Extend Lines: Enable/disable line extensions - this extends the Extremes of the Swings to where a new Swing Started or Extended Right for the Latest Inside Swings
- Show High 1 Line: Display first high/low extension line
- Show High 2 Line: Display second high/low extension line
- Show Low 1 Line: Display first low/high extension line
- Show Low 2 Line: Display second low/high extension line
Visual Customization
Box Colors
- HLHL Box Color: Color for HLHL pattern boxes (default: green)
- HLHL Border Color: Border color for HLHL boxes
- LHLH Box Color: Color for LHLH pattern boxes (default: red)
- LHLH Border Color: Border color for LHLH boxes
Line Colors
- HLHL Line Color: Extension line color for HLHL patterns
- LHLH Line Color: Extension line color for LHLH patterns
- Line Width: Thickness of extension lines (1-5)
Pattern Detection Logic
HLHL Pattern (Bullish Inside Swing)
Condition: High1 > High2 AND Low1 < Low2
Sequence: High → Low → High → Low
Visual: Two overlapping boxes with first range encompassing second
Detection Criteria:
1. Last 4 pivots form High-Low-High-Low sequence
2. Fourth pivot (first high) > Second pivot (second high)
3. Third pivot (first low) < Last pivot (second low)
LHLH Pattern (Bearish Inside Swing)
Condition: Low1 < Low2 AND High1 > High2
Sequence: Low → High → Low → High
Visual: Two overlapping boxes with first range encompassing second
Detection Criteria:
1. Last 4 pivots form Low-High-Low-High sequence
2. Fourth pivot (first low) < Second pivot (second low)
3. Third pivot (first high) > Last pivot (second high)
Visual Elements
Boxes
- Box 1: Spans from first pivot to last pivot (larger range)
- Box 2: Spans from third pivot to last pivot (smaller range)
- Overlap: The intersection of both boxes represents the inside swing zone
Extension Lines
- High 1 Line: Horizontal line at first high/low level
- High 2 Line: Horizontal line at second high/low level
- Low 1 Line: Horizontal line at first low/high level
- Low 2 Line: Horizontal line at second low/high level
Line Extension Behavior
- Historical Patterns: Lines extend until the next pattern starts
- Latest Pattern: Lines extend to the right edge of chart
- Dynamic Updates: All lines are redrawn on each bar for accuracy
Trading Applications
Support/Resistance Levels
Inside swing levels often act as:
- Dynamic support/resistance
- Breakout confirmation levels
- Reversal entry points
Pattern Interpretation
- HLHL Patterns: Potential bullish continuation or reversal
- LHLH Patterns: Potential bearish continuation or reversal
- Overlap Zone: Key area for price interaction
Entry Strategies
1. Breakout Strategy: Enter on break above/below inside swing levels
2. Reversal Strategy: Enter on bounce from inside swing levels
3. Range Trading: Trade between inside swing levels
Technical Implementation
Data Structures
type InsideSwing
int startBar // First pivot bar
int endBar // Last pivot bar
string patternType // "HLHL" or "LHLH"
float high1 // First high/low
float low1 // First low/high
float high2 // Second high/low
float low2 // Second low/high
box box1 // First box
box box2 // Second box
line high1Line // High 1 extension line
line high2Line // High 2 extension line
line low1Line // Low 1 extension line
line low2Line // Low 2 extension line
bool isLatest // Latest pattern flag
Memory Management
- Pattern Storage: Array-based storage with automatic cleanup
- Pivot Tracking: Maintains last 4 pivots for pattern detection
- Resource Cleanup: Automatically removes oldest patterns when limit exceeded
Performance Optimization
- Duplicate Prevention: Checks for existing patterns before creation
- Efficient Redraw: Only redraws lines when necessary
- Memory Limits: Configurable maximum pattern count
Usage Tips
Best Practices
1. Combine with Volume: Use volume confirmation for breakouts
2. Multiple Timeframes: Check higher timeframes for context
3. Risk Management: Set stops beyond inside swing levels
4. Pattern Validation: Wait for confirmation before entering
Common Scenarios
- Consolidation Breakouts: Inside swings often precede significant moves
- Reversal Zones: Failed breakouts at inside swing levels
- Trend Continuation: Inside swings in trending markets
Limitations
- Lagging Indicator: Patterns form after completion
- False Signals: Not all inside swings lead to significant moves
- Market Dependent: Effectiveness varies by market conditions
Customization Options
Visual Adjustments
- Modify colors for different market conditions
- Adjust line widths for visibility
- Enable/disable specific elements
Detection Sensitivity
- Increase pivot length for smoother patterns
- Decrease for more sensitive detection
- Balance between noise and signal
Display Management
- Control maximum pattern count
- Adjust cleanup frequency
- Manage memory usage
Conclusion
The Inside Swings indicator provides a systematic approach to identifying consolidation and potential reversal zones in price action. By visualizing overlapping pivot ranges
The indicator's strength lies in its ability to:
- Identify key price levels automatically
- Provide visual context for market structure
- Offer flexible customization options
- Maintain performance through efficient memory management

PRO Scalper(EN)
## What it is
**PRO Scalper** is an intraday price–action and liquidity map that helps you see where the market is likely to move **now**, not just where it has been.
It combines five building blocks that professional scalpers often watch together:
1. **Session Volume-Weighted Average Price (VWAP)** — the intraday “fair value” anchor.
2. **Opening Range** — the first minutes of the session that set the day’s balance.
3. **Trend filter** — higher-timeframe bias using **Exponential Moving Averages (EMA)** and optional **Average Directional Index (ADX)** strength.
4. **Two independent Supply/Demand zone engines** — zones are drawn from confirmed swing pivots, with midlines and **touch counters**.
5. **Order-flow style visuals**:
* **Delta bubbles** (green/red circles) show where buying or selling pressure was unusually strong, using a safe **delta proxy** (no external feeds).
* **Liquidity densities** (subtle rectangular bands) highlight clusters of large activity that often act as magnets or barriers and disappear when “eaten” by strong moves.
This mix gives you a **complete intraday picture**: the mean (VWAP), the day’s initial balance (Opening Range), the higher-timeframe push (trend filter), the nearby fuel or brakes (zones), and the live pressure points (bubbles and densities).
---
## Why these components
* **VWAP** tracks where the bulk of traded value sits. Price tends to rotate around it or accelerate away from it — a perfect compass for scalps.
* **Opening Range** frames the early auction. Many intraday breaks, fades and retests start at its boundaries.
* **EMA bias + ADX strength** separates trending conditions from chop, so you can keep only the zones that agree with the bigger push.
* **Pivot-based zones (two pairs at once)** are simple, objective and fast. Midlines help with confirmations; touch counters quantify how many times the zone was tested.
* **Bubbles and densities** add the “effort” layer: where the push appeared and where liquidity is concentrated. You see **where** a move is likely to continue or fail.
Together they reduce ambiguity: **context + level + effort** — all on one screen.
---
## How it works (plain language)
* **VWAP** resets each day and is calculated as the cumulative sum of typical price multiplied by volume divided by total volume.
* **Opening Range** is either automatic (a multiple of your chart timeframe) or a manual number of minutes. While it is forming, the highest high and lowest low are captured and plotted as the range.
* **Trend filter**
* **EMA Fast** and **EMA Slow** define directional bias.
* **ADX (optional)** adds “trend strength”: only when the Average Directional Index is above the chosen threshold do we treat the move as strong. You can source this from a higher timeframe.
* **Zones**
* There are **two independent pairs** of pivots at the same time (for example 10-left 10-right and 5-left 5-right).
* Each detected pivot creates a **Supply** (from a swing high) or **Demand** (from a swing low) box. Box depth = **zone depth × Average True Range** for adaptive sizing; the boxes **extend forward**.
* Midline (optional dashed line inside the box) is the “balance” of the zone.
* **“Only in trend”** mode can hide boxes that go against the higher-timeframe bias.
* The **touch counter** increases when price revisits the box. Labels show the pair name and the number of touches.
* **Bubbles**
* A safe **delta proxy** measures bar pressure (for example, range-weighted close vs open).
* A **quantile filter** shows only unusually large pressure: choose lookback and percentile, and the script draws a circle sized by intensity (green = bullish pressure, red = bearish).
* **Densities**
* The script marks heavy activity clusters as **subtle bands** around price (depth = fraction of Average True Range).
* If price **breaks** a density with volume above its moving average, the band **disappears** (“eaten”), which often precedes continuation.
---
## How to use — practical playbooks
> Recommended chart: crypto or index futures, one to five minutes. Use **one hour** or **fifteen minutes** for the higher-timeframe bias.
### 1) Trend pullback scalp (continuation)
1. Enable **Only in trend** zones.
2. In an uptrend: wait for a pullback into a **Demand** zone that overlaps with VWAP or sits just below the Opening Range midpoint.
3. Look for **green bubbles** near the zone’s bottom or a fresh **density** under price.
4. Enter on a candle closing **back above the zone midline**.
5. Stop-loss: below the bottom of the zone or a small multiple of Average True Range.
6. Targets: previous swing high, Opening Range high, fixed risk multiples, or VWAP.
Mirror the logic for downtrends using Supply zones, red bubbles and densities above price.
### 2) Reversion with liquidity sweep (fade)
1. Bias neutral or countertrend allowed.
2. Price **wicks through** a zone boundary (or an Opening Range line) and **closes back inside** the zone.
3. The bubble color often flips (absorption).
4. Enter toward the **inside** of the zone; stop beyond the sweep wick; first target = zone midline, second = opposite side of the zone or VWAP.
### 3) Opening Range break and retest
1. Wait for the Opening Range to complete.
2. A break with a large bubble suggests intent.
3. Look for a **retest** into a nearby zone aligned with VWAP.
4. Trade continuation toward the next zone or the session extremes.
### 4) Density “eaten” continuation
1. When a density band **disappears** on high volume, it often means the resting liquidity was consumed.
2. Trade in the direction of the break, toward the nearest opposing zone.
---
## Settings — quick guide
**Core**
* *ATR Length* — used for zone and density depths.
* *Show VWAP / Show Opening Range*.
* *Opening Range*: Auto (multiple of timeframe minutes) or Manual minutes.
**Trend Filter**
* *Mode*: Off, EMA only, or EMA with ADX strength.
* *Use higher timeframe* and its value.
* *EMA Fast / EMA Slow*, *ADX Length*, *ADX threshold*.
* *Plot EMA filter* to display the moving averages.
**Zones (two pairs)**
* *Pivot A Left / Right* and *Pivot B Left / Right*.
* *Zone depth × ATR*, *Extend bars*.
* *Show zone midline*, *Only in trend zones*.
* Labels automatically show the touch counters.
**Bubbles**
* *Show Bubbles*.
* *Quantile lookback* and *Quantile percent* (higher percent = stricter filter, fewer bubbles).
**Densities**
* *Metric*: absolute delta proxy or raw volume.
* *Quantile lookback / percent*.
* *Depth × ATR*, *Extend bars*, *Merge distance* (in ATR),
* *Break condition*: volume moving average length and multiplier,
* *Midline for densities* (optional dashed line).
---
## Tips and risk management
* This script **does not use external order-flow feeds**. Delta is a **proxy** suitable for TradingView; tune quantiles per symbol and timeframe.
* Do not trade every bubble. Combine **context (trend + VWAP + Opening Range)** with **level (zone)** and **effort (bubble/density)**.
* Set stop-losses beyond the zone or at a fraction of Average True Range. Predefine risk per trade.
* Backtest your rules with a strategy script before using real funds.
* Markets differ. Parameters that work on Bitcoin may not transfer to low-liquidity altcoins or stocks.
* Nothing here is financial advice. Scalping is high-risk; slippage and over-trading can quickly damage your account.
---
## What makes PRO Scalper unique
* Two **independent** zone engines run in parallel, so you can see both **larger structure** and **fine intraday levels** at the same time.
* Clean **“only in trend” rendering** — zones and midlines against the bias can be hidden, reducing clutter and hesitation.
* **Touch counters** convert “feel” into numbers.
* **Self-contained order-flow visuals** (bubbles and densities) that require no extra data sources.
* Careful defaults: subtle colors for densities, clearer zones, and responsive auto Opening Range.
---
(RU)
## Что это такое
**PRO Scalper** — это индикатор для внутридневной торговли, который показывает **контекст и ликвидность прямо сейчас**.
Он объединяет пять модулей, которыми профессиональные скальперы пользуются вместе:
1. **VWAP** — средневзвешенная по объему цена за сессию, «справедливая стоимость» дня.
2. **Opening Range** — первая часть сессии, задающая баланс дня.
3. **Фильтр тренда** — направление старшего таймфрейма по **экспоненциальным средним** и при желании по силе тренда **Average Directional Index**.
4. **Две независимые системы зон спроса/предложения** — зоны строятся от подтвержденных экстремумов (пивотов), имеют **среднюю линию** и **счетчик касаний**.
5. **Визуализация «ордер-флоу»**:
* **Пузыри дельты** (зеленые/красные круги) — места повышенного покупательного/продажного давления, рассчитанные через безопасный **прокси-дельты**.
* **Плотности ликвидности** (ненавязчивые прямоугольные ленты) — скопления объема, которые нередко притягивают цену или удерживают ее и исчезают, когда «разъедаются» сильным движением.
Итог — **полная картинка момента**: среднее (VWAP), баланс дня (Opening Range), старшая сила (фильтр тренда), ближайшие уровни топлива/тормозов (зоны), текущие точки усилия (пузыри и плотности).
---
## Почему именно эти элементы
* **VWAP** показывает, где сосредоточена стоимость; цена либо вращается вокруг него, либо быстро уходит — идеальный ориентир скальпера.
* **Opening Range** фиксирует ранний аукцион — от его границ часто начинаются пробои, возвраты и ретесты.
* **EMA + ADX** отделяют тренд от «пилы», позволяя оставлять на графике только зоны по направлению старшего таймфрейма.
* **Зоны от пивотов** просты, объективны и быстры; средняя линия помогает подтверждать разворот, счетчик касаний переводит субъективность в цифры.
* **Пузыри и плотности** добавляют слой «усилия»: где именно возник толчок и где сконцентрирована ликвидность.
Комбинация **контекста + уровня + усилия** уменьшает двусмысленность и ускоряет принятие решения.
---
## Как это работает (простыми словами)
* **VWAP** каждый день стартует заново: сумма «типичной цены × объем» делится на суммарный объем.
* **Opening Range** — автоматический (кратный минутам вашего таймфрейма) или вручную заданный период; пока он формируется, фиксируются максимум и минимум.
* **Фильтр тренда**
* Две экспоненциальные средние задают направление.
* **ADX** (по желанию) добавляет «силу». Источник можно взять со старшего таймфрейма.
* **Зоны**
* Одновременно работает **две пары** пивотов (например 10-лево 10-право и 5-лево 5-право).
* От пивота строится зона **предложения** (от максимума) или **спроса** (от минимума). Глубина зоны = **коэффициент × Average True Range**; зона тянется вперед.
* Внутри рисуется **средняя линия** (по желанию).
* Режим **«только по тренду»** скрывает зоны против старшего направления.
* **Счетчик касаний** увеличивается, когда цена снова входит в зону; подпись показывает пару и количество касаний.
* **Пузыри**
* Используется безопасный **прокси-дельты** — измерение «напряжения» внутри свечи.
* Через **квантильный фильтр** выводятся только необычно сильные места: настраиваются окно и процент квантиля; размер кружка — сила, цвет: зеленый покупатели, красный продавцы.
* **Плотности**
* Крупные активности отмечаются **ненавязчивыми прямоугольниками** (глубина — доля Average True Range).
* Если плотность **пробивается** объемом выше среднего, она **исчезает** — часто это предвещает продолжение.
---
## Как пользоваться — практические схемы
> Рекомендация: крипто или фьючерсы, таймфрейм 1–5 минут. Для старшего фильтра удобно взять **1 час** или **15 минут**.
### 1) Скальп на откат по тренду
1. Включите **«только по тренду»**.
2. В восходящем тренде дождитесь отката в **зону спроса**, желательно рядом с **VWAP** или серединой **Opening Range**.
3. Подтверждение — **зеленые пузыри** у нижней границы зоны или свежая **плотность** под ценой.
4. Вход после закрытия свечи **выше средней линии** зоны.
5. Стоп-лосс: за нижнюю границу зоны или небольшой множитель Average True Range.
6. Цели: предыдущий максимум, верх Opening Range, фиксированные R-множители, либо VWAP.
Для нисходящего тренда зеркально: зоны предложения, красные пузыри и плотности над ценой.
### 2) Контрдвижение с «выбиванием ликвидности»
1. Нейтральный или контртрендовый режим.
2. Цена **выносит хвостом** границу зоны (или линию Opening Range) и **закрывается обратно внутри**.
3. Цвет пузыря часто меняется (поглощение).
4. Вход внутрь зоны; стоп — за хвост выбивания; цели: средняя линия, противоположная граница зоны или VWAP.
### 3) Пробой Opening Range + ретест
1. Дождитесь завершения диапазона.
2. Сильный пробой с крупным пузырем — признак намерения.
3. Ищите **ретест** в зоне по тренду рядом с линией диапазона и VWAP.
4. Торгуйте продолжение к следующей зоне.
### 4) Продолжение после «съеденной» плотности
1. Когда прямоугольник плотности **исчезает** на повышенном объеме, это значит, что ликвидность поглощена.
2. Торгуйте в сторону пробоя к ближайшей противоположной зоне.
---
## Настройки — краткая шпаргалка
**Core**
— Длина Average True Range (для размеров зон и плотностей).
— Включение VWAP и Opening Range.
— Длина Opening Range: автоматическая (кратная минутам ТФ) или ручная.
**Trend Filter**
— Режим: выкл., только средние, либо средние + ADX.
— Источник со старшего таймфрейма и его значение.
— Длины средних, длина ADX и порог силы.
— Показать/скрыть линий средних.
**Zones (две пары одновременно)**
— Пара A: лев/прав; Пара B: лев/прав.
— Глубина зоны × Average True Range, продление по барам.
— Средняя линия, режим **«только по тренду»**.
— Подписи со счетчиком касаний.
**Bubbles**
— Вкл./выкл., окно поиска и процент квантиля (чем выше процент — тем реже пузыри).
**Densities**
— Метрика: абсолютная прокси-дельты или чистый объем.
— Окно/квантиль, глубина × Average True Range, продление,
— Порог объединения (в Average True Range),
— Условие «разъедания» по объему,
— Средняя линия плотности (по желанию).
---
## Советы и риски
* Индикатор **не использует внешние потоки ордер-флоу**. Дельта — **прокси**, подходящая для TradingView; подбирайте квантили под инструмент и таймфрейм.
* Не торгуйте каждый пузырь. Склейте **контекст (тренд + VWAP + Opening Range)** с **уровнем (зона)** и **усилием (пузырь/плотность)**.
* Стоп-лосс — за границей зоны или по Average True Range. Риск на сделку задавайте заранее.
* Перед реальными деньгами протестируйте правила в стратегии.
* Разные рынки ведут себя по-разному; настройки из Биткоина могут не подойти малоликвидным альткоинам или акциям.
* Это не инвестиционная рекомендация. Скальпинг — высокий риск; проскальзывание и переизбыток сделок быстро наносят ущерб капиталу.
---
## Чем уникален PRO Scalper
* Две **одновременные** системы зон показывают и **крупную структуру**, и **точные локальные уровни**.
* Режим **«только по тренду»** чистит экран от лишних уровней и ускоряет решение.
* **Счетчики касаний** дают количественную опору.
* **Самодостаточные визуализации усилия** (пузыри и плотности) — без сторонних источников данных.
* Аккуратная цветовая схема: плотности — мягко, зоны — ясно; Opening Range — адаптивный.
Пусть он станет вашей «картой местности» для быстрых и дисциплинированных решений внутри дня.

High-Low-Avg Plot (1D)This script aims to plot the High, Low, Average (of High+Low+Close) for past 14 days of an index/a stock to provide certain levels in trading

Buying Climax + Spring [Darwinian]Buying Climax + Spring Indicator
Overview
Advanced Wyckoff-based indicator that identifies potential market reversals through **Buying Climax** patterns (exhaustion tops) and **Spring** patterns (accumulation bottoms). Designed for traders seeking high-probability reversal signals with strict uptrend validation.
---
Method
🔴 Buying Climax Detection
Identifies exhaustion patterns at market tops using multi-condition analysis:
**Base Buying Climax (Red Triangle)**
- Volume spike > 1.8x average
- Range expansion > 1.8x average
- New 20-bar high reached
- Close finishes in lower 30% of bar range
- **Strict uptrend validation**: Price must be 30%+ above 20-day low
**Enhanced Buying Climax (Maroon Triangle)**
- All Base BC conditions PLUS:
- Gap up from previous high
- Intraday fade (close < open and below midpoint)
- **Higher confidence reversal signal**
🟢 Wyckoff Spring Detection
Identifies accumulation patterns at support levels:
- Price breaks below recent pivot low (false breakdown)
- Close recovers above pivot level (rejection)
- Occurs at trading range low
- Optional volume confirmation (1.5x+ average)
- Limited to 3 attempts per pivot (prevents over-signaling)
✅ Uptrend Validation Filter
**Four-condition composite filter** prevents false signals in sideways/downtrending markets:
1. Close-to-close rise ≥ 5% over lookback period
2. Price structure: Close > MA(10) > MA(20)
3. Swing low significantly below current price
4. **Primary requirement**: Current high ≥ 30% above 20-day low
---
Input Tuning Guide
Buying Climax Settings:
**Volume & Range Thresholds**
- `Volume Spike Threshold`: Default 1.8x
- Lower (1.5x) = More signals, more noise
- Higher (2.0-2.5x) = Fewer but stronger exhaustion signals
- `Range Spike Threshold`: Default 1.8x
- Adjust parallel to volume threshold
- Higher values = extreme volatility required
**Pattern Detection**
- `New High Lookback`: Default 20 bars
- Shorter (10-15) = Recent highs only
- Longer (30-50) = Major breakout detection
- `Close Off High Fraction`: Default 0.3 (30%)
- Lower (0.2) = Stricter rejection requirement
- Higher (0.4-0.5) = Allow weaker intraday fades
- `Gap Threshold`: Default 0.002 (0.2%)
- Increase (0.005-0.01) for stocks with wider spreads
- Decrease (0.001) for tight-spread instruments
- `Confirmation Window`: Default 5 bars
- Shorter (3) = Faster confirmation, more false positives
- Longer (7-10) = Wait for deeper automatic reaction
Uptrend Filter Settings
**Critical for Signal Quality**
- `Minimum Rise from 20-day Low`: Default 0.30 (30%)
- **Most important parameter**
- Lower (0.20-0.25) = More signals in moderate uptrends
- Higher (0.40-0.50) = Only extreme parabolic moves
- `Pole Lookback`: Default 30 bars
- Shorter (20) = Recent momentum focus
- Longer (40-50) = Longer-term trend validation
- `Minimum Rise % for Pole`: Default 0.05 (5%)
- Adjust based on market volatility
- Higher in strong bull markets (7-10%)
Wyckoff Spring Settings
- `Pivot Length`: Default 6 bars
- Shorter (3-4) = More frequent pivots, more signals
- Longer (8-10) = Major support/resistance only
- `Volume Threshold`: Default 1.5x
- Higher (1.8-2.0x) = Stronger conviction required
- Disable volume requirement for low-volume stocks
- `Trading Range Period`: Default 20 bars
- Match to consolidation timeframe being traded
- Shorter (10-15) for intraday patterns
- Longer (30-40) for weekly consolidations
---
Recommended Workflow
1. **Start with defaults** on daily timeframe
2. **Adjust uptrend filter** first (30% rise parameter)
- Too many signals? Increase to 35-40%
- Too few? Decrease to 25%
3. **Fine-tune volume/range multipliers** based on instrument volatility
4. **Enable alerts** for real-time monitoring:
- Base BC → Initial warning
- Enhanced BC → High-priority reversal
- Confirmed BC (AR) → Strong follow-through
- Spring → Accumulation opportunity
---
Alert System
- **Base Buying Climax**: Standard exhaustion pattern detected
- **Enhanced BC (Gap+Fade)**: Higher confidence reversal setup
- **Confirmed BC (AR)**: Automatic reaction validated (price drops below BC midline)
- **Wyckoff Spring**: Accumulation pattern at support
---
Best Practices
- Combine with support/resistance analysis
- Watch for BC clusters (multiple timeframes)
- Spring patterns work best after Buying Climax distribution
- Backtest parameters on your specific instruments
- Higher timeframes (daily/weekly) = higher reliability
---
Technical Notes
- Built with Pine Script v6
- No repainting (signals finalize on bar close)
- Minimal CPU usage (optimized calculations)
- Works on all timeframes and instruments
- Overlay indicator (displays on price chart)
---
*Indicator follows classical Wyckoff methodology with modern volatility filters*

Bitgak [Osprey]🟠 INTRODUCTION
Bitgak , translated as "Oblique Angle" in Korean, is a strategy used by multi-hundred-million traders in Korea, sometimes more heavily than Fibonacci retracement.
It is a concept that by connecting two or more pivot points on the chart and creating equidistant parallel lines, we can spot other pivot points. As seen in the example, a line at a different height but with the same angle spots many pivot points.
This indicator spots pivot points on the chart and tests all different possible Bitgak lines with a brute-force method. Then it shows the parallel line configuration with the most pivots hitting it. You may use the lines drawn on the chart as possible reversal points.
It is best to use on Day and Week candles . In the very short range of time, the noise makes it hard to capture meaningful data.
🟠 HOW TO USE
The orange dots are the major pivot points (you can set the period of the long-term pivot) upon which the lines are built.
Change the "Manual Lookback Bars" from 300 to a meaningful period upon your inspection.
"Hit Tolerance %" means how close a pivot needs to be to the line to be considered as having touched the line.
If the line is too narrow, which is not very useful, you may consider increasing the "Long-term Pivot Bars" and experimenting with different settings for Channel Lines and Heuristics.
The result:
"Top Anchors to Test (L)" is how many L highest peaks and L lowest troughs should be weighed heavily when testing the lines. That is, with L = 1, the algorithm will reward the Bitgak lines that touch 1 highest peak and 1 lowest trough. It doesn't make much intuitive sense, so I suggest just testing it out.
🟠 HOW IT WORKS
Step 1: Pivot Detection
The indicator runs two parallel detection systems:
Short-term pivots (default: 7 bars on each side) - Captures minor swing highs/lows for detailed analysis
Long-term pivots (default: 17 bars on each side) - Identifies major structural turning points
These pivots form the foundation for all channel calculations.
Step 2: Anchor Point Selection
From the detected long-term pivots, the algorithm identifies:
The L highest peaks (default L=1, meaning the single highest peak)
The L lowest troughs (default L=1, meaning the single lowest trough)
These become potential "anchor points" for channel construction. Higher L values test more combinations but increase computation time.
Step 3: Channel Candidate Generation
For support channels: Every pair of troughs becomes a potential base line (A-B)
For resistance channels: Every pair of peaks becomes a potential base line (A-B)
The algorithm then tests each peak (for support) or trough (for resistance) as pivot C.
Step 4: Optimal Spacing Calculation
For each A-B-C combination, the algorithm calculates:
Unit Spacing = (Distance from C to A-B line) / Multiplier
It tests multipliers from 0.5 to 4.0 (or your custom range), asking: "If pivot C sits on the 1.0 line, what spacing makes the most pivots hit other lines?"
Step 5: Scoring & Selection
Each configuration is scored by counting how many pivots fall within tolerance (default 1% of price) of any parallel line in the range . The highest-scoring channel is drawn on your chart.

Volume Profile, Pivot Anchored by DGT - reviewedVolume Profile, Pivot Anchored by DGT - reviewed
This indicator, “Volume Profile, Pivot Anchored”, builds a volume profile between swing highs and lows (pivot points) to show where trading activity is concentrated.
It highlights:
Value Area (VAH / VAL) and Point of Control (POC)
Volume distribution by price level
Pivot-based labels showing price, % change, and volume
Optional colored candles based on volume strength relative to the average
Essentially, it visualizes how volume is distributed between market pivots to reveal key price zones and volume imbalances.

Leverage & Liquidations (Margins) Plotter - [SANIXLAB]Leverage & Liquidations (Margins) Plotter —
This indicator visualises liquidation zones across multiple leverage tiers and helps traders manage margin exposure .
It dynamically plots the liquidation ranges for 5x → 100x positions, highlighting where leveraged traders could get wiped out.
Add manual long / short markers , choose leverage and margin size, and the script calculates your exact liquidation prices — buffered for realism.
A clean control panel shows entries, liquidation levels, and percentage distance to liquidation.
Features
Visual leverage zones (5x → 100x)
Manual Long / Short marker system
Margin-based liquidation math with buffer
Toggleable entry & liq lines
Compact top-right control panel
Floating mid-zone leverage labels
Fully customizable colors
Use Case
Quickly see:
Where 10x / 20x traders get squeezed
How far your own trade can move before margin burn
Where cascading liquidations might begin
Perfect for futures & leverage traders who want to keep one eye on price … and the other on survival.
— MR.L ☕
Brewed with caffeine, coded with care.

Equinox Wolf - ICT MacrosEquinox Wolf – ICT Macros plots the key ICT session macro windows on your chart so you can focus on how price behaves inside each time range. The script anchors every session to America/New_York time, updates live or in backtesting, and only keeps the current trading day on screen, avoiding clutter from prior sessions. Each window can be toggled individually, the box fill, borders, and high/low/equilibrium levels share global color and style controls, and the levels extend forward until the next macro begins. Use it to highlight the ICT LND, NYAM, lunch, afternoon, and final-hour ranges and monitor how price reacts around their highs, lows, and midpoints.

Khusan Pullback & Mean-Reversion (Manual ADX, Clean)Description
The indicator combines two logics in one tool:
Trend Pullback: Entries in the direction of the dominant trend after a short-term pullback to the EMA.
Return to the mean (Mean-Reversal): countertrend trades from external Bollinger bands with an RSI filter.
Key Features
Manual ADX (Wilder calculation): more precisely, it controls the strength of the trend without hidden smoothing.
There is a clear separation of market modes: the background of the chart highlights the condition: trend up/down or sideways (range).
Signal tags: Long TPB / Short TPB for pullbacks in the trend, Long MR / Short MR for a return to the average.
A minimum of “noise": neat colors, clear captions, without unnecessary graphics.
How to read signals
Trend Pullback
Long TPB — ADX ≥ threshold, price returns above fast EMA, RSI > 45.
Short TPB — ADX ≥ threshold, price goes below fast EMA, RSI < 55.
Mean-Reversion
Long MR — sideways (ADX < threshold), price below lower BB, RSI < 30, confirmation of reversal.
Short MR — sideways (ADX < threshold), price above upper BB, RSI > 70, reversal confirmation.
Parameters (Inputs)
EMA fast / EMA slow — fast and slow EMA (default 20/50).
ADX length / threshold — period and trend strength threshold.
BB length / mult — period and Bollinger Bands multiplier.
RSI length — RSI period.
Show labels/background — enable mode signatures and highlighting.
Recommendations for use
Timeframes: from M15 to H4. On lower TF, add a filter by the higher trend (e.g. H1/H4 EMA).
Instruments: XAUUSD, FX majors, indices, liquid futures and crypto pairs.
Risk management: for TPB, use SL behind the local swing extremum/below the EMA zone; for MR, use SL behind the external BB.
Filters: avoid entering against strong news; prioritize MR when volatility is low, and TPB when volatility is high.
Alerts
Create standard alerts based on the appearance of Long/Short TPB and Long/Short MR labels — the indicator provides clear conditions for auto-entry/notifications.
Important
The indicator is not

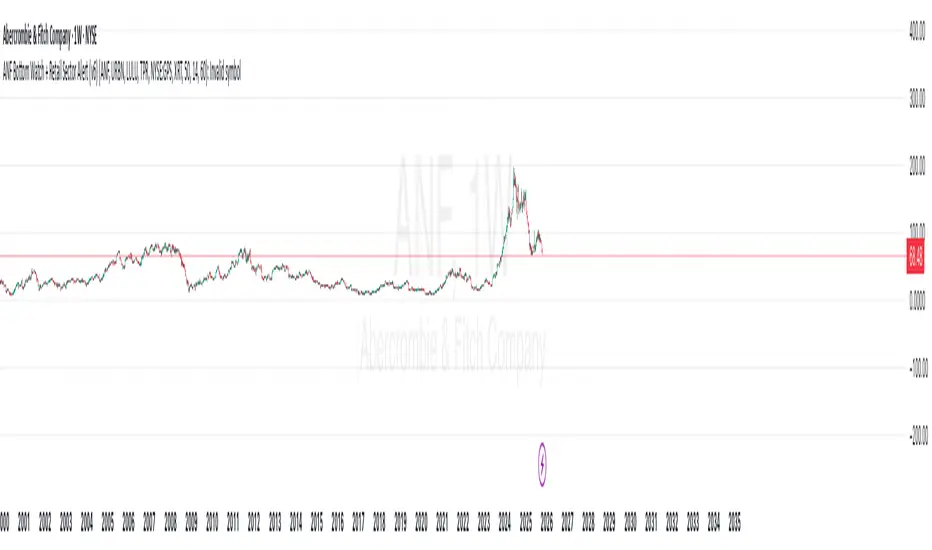
ANF Bottom Watch + Retail Sector Alert (v6) Detect when ANF crosses above its 50-day moving average (technical recovery signal).
Show visual + alert when RSI recovers above 40 (momentum bottom confirmation).
Track peer strength (URBN, LULU, TPR, GPS) — if 3+ peers are trading above their own 50-day MA, the script flags a sector rotation (bullish context).
Give a “Bottom Watch Active” label when all three signals align.
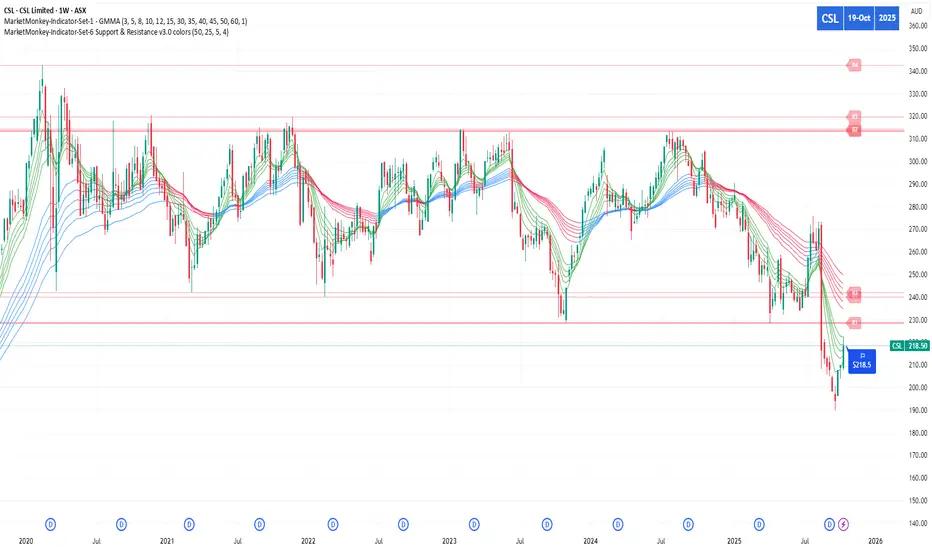
MarketMonkey-Indicator-Set-6 Support & Resistance v3.0 colorsMarketMonkey-Indicator-Set-6 Support & Resistance v3.0 colors
Automatically detects and plots up to four recent support and resistance levels using pivot highs and lows. Lines update dynamically with adaptive colours, highlighting key price zones in real time. Optional R1–R4 and S1–S4 labels keep charts clean yet informative. Ideal for identifying trend reversals, breakout points, and areas where buyers or sellers are likely to act.
________________________________________
🔍 What It Does
The script uses pivot highs and pivot lows to detect recent swing points — the moments where price has clearly turned.
• Resistance levels are drawn at recent pivot highs (red lines).
• Support levels are drawn at recent pivot lows (blue lines).
• Each level automatically updates as new price data forms, keeping your analysis current.
The indicator displays up to four recent resistance and support levels on each side (R1–R4, S1–S4), with labels and colours that adapt to whether the line is above or below current price.
________________________________________
🎨 Features
• Dynamic Detection: Automatically identifies and updates support and resistance using pivot logic.
• Multi-Level Display: Shows up to four most recent highs and lows for a broader market view.
• Customisable Inputs: Adjust the number of bars used to confirm pivots and control how many levels are displayed.
• Colour-Coded Clarity:
o Resistance lines = soft red tone (indicating potential ceiling levels).
o Support lines = soft blue tone (indicating price floors).
• Optional Labels: Toggle on/off “R1–R4” and “S1–S4” tags for quick reference.
• Strong Level Highlighting: The nearest (most recent) levels are drawn thicker for emphasis.
Simple CPR for intraday index tradingSimple CPR is an indicator that displays the Central Pivot Range (CPR) and Support-Resistance pivots. It offers granular customization across CPR, Floor pivots, Developing CPR, and Session High/Low levels.
Original concept from Larry Williams, Mark Fisher & Frank Ochoa
Modified from " CPR (Central Pivot Range)" script by ajithcpas
What is CPR (Central Pivot Range)?
The Central Pivot Range (CPR) is calculated from the previous period’s High (H), Low (L), and Close (C). It forms three levels:
• Pivot (P) = (H + L + C) / 3
• Top Central (TC) = ( P - BC) + P
• Bottom Central (BC) = ( H + L)/2
Together, these levels form a central zone representing the market’s “value area.” Price trading above the CPR typically indicates bullish sentiment, while trading below the CPR reflects bearish bias. A narrow CPR often precedes strong trending moves, whereas a wider CPR signals potential consolidation.
How Pivot Levels are Calculated
Beyond CPR, the indicator supports multiple pivot calculation models, including Traditional, Classic, Fibonacci, and Camarilla
For example, in the traditional model:
• R1 = ( 2 × P ) − L
• S1 = ( 2 × P ) − H
• Higher levels (R2, R3…) scale proportionally by the prior range (H-L).
These levels serve as dynamic intraday support-resistance zones and breakout targets.
Key Features
⦿ Multi-Formula CPR : Select Traditional, Classic, Fibonacci, or Camarilla pivots.
⦿ Multi-Timeframe Control : Auto-detect or manually set CPR timeframe (Daily → Yearly).
⦿ Complete Pivot Suite : Extending to five resistance and five support levels (R1–R5, S1–S5) with optional midpoints (R0.5, R1.5, R2.5, R3.5, R4.5, S0.5, S1.5, S2.5, S3.5, S4.5).All levels can be individually toggled on or off, giving traders complete control over the level of chart detail they prefer.
⦿ Full Customization : Independently toggle lines, fills, price labels, and level names.
⦿ Developing CPR & S/R : Real-time projection of next-session CPR, R1, and S1 with separate visibility controls.
⦿ Session High/Low Tracking : Plot Previous-Session High (PH) & Low (PL) with optional labels and prices.
⦿ Look-Back Flexibility : Display any number of historical CPR/pivot periods.
⦿ Styling Precision : Choose line width, style (solid, dashed, dotted), and individual colors.
⦿ Optional Fills : Visualize the CPR zone or CPR–R1/S1 bands with semi-transparent shading.
⦿ Optimized Performance : Efficient array-based drawing for smooth chart performance even with a long history.
Use Case
CPR analysis helps identify trend bias, volatility contraction/expansion, and key support-resistance zones. This indicator is ideal for intraday indices traders who need a structured yet customizable price-action framework.
Disclaimer
This script is for educational and technical analysis purposes only. It does not constitute financial advice or a recommendation. Always perform independent analysis and manage risk appropriately before placing trades.

Europe Session LinesThis simple script marks the start of the European trading sessions:
08:00 a.m. London trading session
09:00 a.m. Frankfurt trading session
The settings of the lines can be changed. (thickness, colour, type).
It can be used on Futures and CFDs for example for FDAX, FTSE100 but also for GOLD, Silver and EURO- and GBP based FX pairs as supply or demand zone with the change of character trading setup.
