Retracement Strategy [OmegaTools]Retracement Strategy is a systematic trend–retracement framework designed to identify directional opportunities after a confirmed momentum shift, and to manage exits using either trend reversals or overextension conditions. It is built around a smoothed RSI regime filter and a simple, price-based retracement trigger, making it applicable across a wide range of markets and timeframes while remaining transparent and easy to interpret.
The strategy begins by defining the underlying trend through a two-stage RSI signal. A standard RSI is computed over the user-defined Length input, then smoothed with a short moving average to reduce noise. Two symmetric thresholds are derived from the Threshold parameter: an upper band at 100 minus the threshold and a lower band at the threshold itself. When the smoothed RSI crosses above the upper band, the environment is classified as bullish and the internal trend state is set to uptrend. When the smoothed RSI crosses below the lower band, the environment is classified as bearish and the trend state becomes downtrend. When RSI moves back into the central zone between the two bands, the trend is considered neutral. In addition to the current trend, the strategy tracks the last non-neutral trend direction, which is used to detect genuine trend changes rather than transient oscillations.
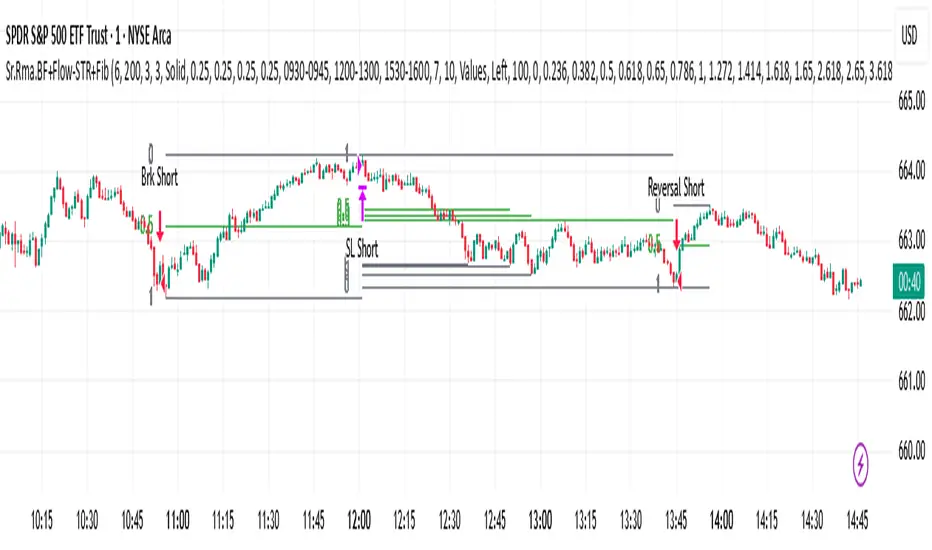
Once a trend is established, the strategy looks for retracement entries in the direction of that trend. For long setups in an uptrend, it computes the lowest low over the previous Length minus one bars, excluding the current bar. A long signal is generated when price dips below this recent low while the trend state remains bullish. Symmetrically, for short setups in a downtrend, it computes the highest high over the previous Length minus one bars and enters short when price spikes above this recent high while the trend state remains bearish. This logic is designed to capture pullbacks against the prevailing RSI-defined trend, entering when the market tests or slightly violates recent extremes, rather than chasing breakouts. The candles are visually coloured to reflect the detected trend, highlighting bullish and bearish environments while keeping neutral phases distinguishable on the chart. An ATR-based measure is used solely to position the “UP” and “DN” labels on the chart for clearer visualisation of entry points; it does not directly influence position sizing or stop calculation in this implementation.
Take profit and stop loss behaviour are fully parameterized through the “Take Profit” and “Stop Loss” inputs, each offering three modes: None, Trend Change and Extension. When “Trend Change” is selected for the take profit, the strategy will only exit profitable positions when a confirmed trend reversal occurs. For a long position, this means that the strategy will close the trade when the trend state flips from uptrend to downtrend, and the last recorded trend direction validates that this is a genuine reversal rather than a neutral fluctuation; the same logic applies symmetrically for short positions. When “Extension” is selected as the take profit mode, the strategy closes profitable long trades when the smoothed RSI reaches or exceeds the upper threshold, interpreted as an overbought extension within the bullish regime, and closes profitable short trades when the smoothed RSI falls to or below the lower threshold, interpreted as an oversold extension within the bearish regime. When “None” is chosen, the strategy does not apply any explicit take profit logic, leaving trades to be managed by the stop loss settings or by user discretion in backtesting.
The stop loss parameter works in a parallel way. With “Trend Change” selected as stop loss, any open long position is closed when the trend flips from uptrend to downtrend, regardless of whether the trade is currently in profit or loss, and any open short is closed when the trend flips from downtrend to uptrend. This turns the RSI trend regime into a hard invalidation rule: once the underlying momentum structure reverses, the position is exited. With “Extension” selected for stop loss, long positions are closed when RSI falls back below the upper band and moves towards the opposite side of the range, while short positions are closed when RSI rises above the lower band and moves towards the upper side. In practice, this acts as a dynamic exit based on the oscillator moving out of a favourable context for the existing trade. Selecting “None” for stop loss disables these automatic exits, leaving only the take profit logic, if any, to manage the position. Because take profit and stop loss configuration are independent, the user can construct different profiles, such as pure trend-change exits on both sides, pure overextension exits, or a mix (for example, take profit on overextension and stop loss on trend reversal).
This strategy is designed as an analytical and backtesting framework rather than a finished plug-and-play trading system. It does not include position sizing, risk-per-trade controls, multi-timeframe confirmation, volatility filters or instrument-specific fine-tuning. Its primary purpose is to provide a clear, rule-based structure for testing retracement logic within RSI-defined trends, and to allow users to explore how different exit regimes (trend-change based versus extension based) affect performance on their instruments and timeframes of interest.
Nothing in this script or its description should be interpreted as financial advice, investment recommendation or solicitation to buy or sell any financial instrument. Past performance on backtests does not guarantee future results. The behaviour of this strategy can vary significantly across symbols, timeframes and market conditions, and correlations, volatility and liquidity can change without warning. Before considering any live application, users should thoroughly backtest and forward test the strategy on their own data, adjust parameters to their risk profile and instrument characteristics, and integrate proper money management and trade management rules. Use of this script is entirely at the user’s own risk.
Pine Script® ストラテジー