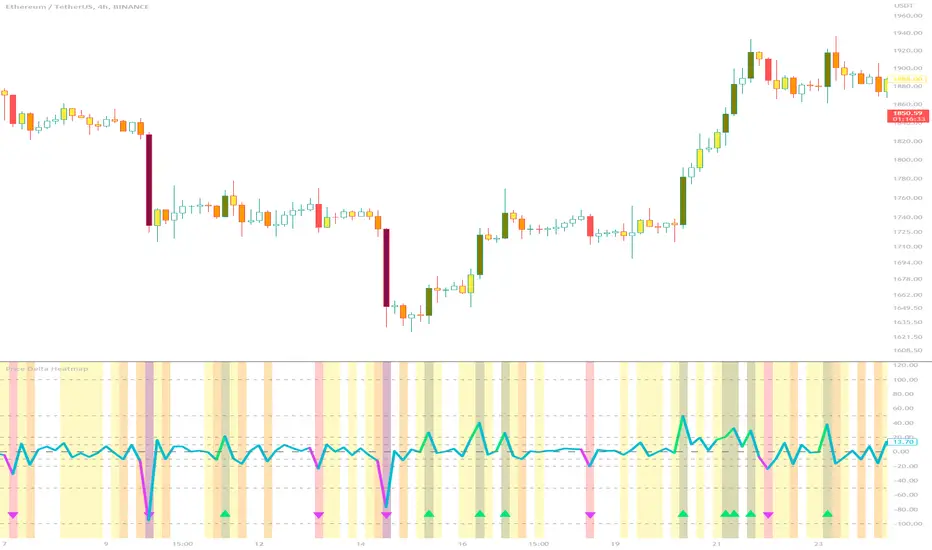
Price Delta HeatmapThe Price Delta Heatmap is an indicator designed to visualize the price changes of an asset over time. It helps traders identify and analyze significant price movements and potential volatility. The indicator calculates the price delta, which is the difference between the current close price and the previous close price. It then categorizes the price deltas into different color ranges to create a heatmap-like display on the chart.
The indicator uses user-defined thresholds to determine the color ranges. These thresholds represent the minimum price change required for a specific color to be assigned. The thresholds are adjustable to accommodate different asset classes and trading strategies. Positive price deltas are associated with bullish movements, while negative price deltas represent bearish movements.
The indicator plots bars color-coded according to the price delta range it falls into. The color ranges can be customized to match personal preferences or specific trading strategies. Additionally, the indicator includes signal shapes below the bars to highlight significant positive or negative price deltas. Traders can adjust the threshold values based on their preferred sensitivity to price changes. Higher threshold values may filter out minor price movements and focus on more significant shifts, while lower threshold values will capture even minor fluctuations.
****The default settings have the thresholds set to levels of 100, 50, 20, 10, 0, -10, -20, -50, and -100. These numbers are well-suited for assets such as Ethereum or Bitcoin which are larger in price than an asset that has a price of $1.50, for example. To compensate, adjust the thresholds in the settings to reflect the price delta on the desired asset. All coloration and horizontal line plots will adjust to reflect these changes.****
Traders can interpret the Price Delta Heatmap as follows:
-- Bright green bars indicate the highest positive price deltas, suggesting strong bullish price movements.
-- Green bars represent positive price deltas above the third threshold, indicating significant bullish price changes.
-- Olive bars indicate positive price deltas above the second threshold, suggesting moderate bullish price movements.
-- Yellow bars represent positive price deltas above the lowest threshold, indicating minor bullish price changes. This color is reflected on the negative side as well. Yellow bars below zero indicate negative price deltas below the lowest threshold, suggesting minor bearish price changes.
-- White bars represent zero price deltas, indicating no significant price movement.
-- Orange bars represent negative price deltas below the second threshold, indicating moderate bearish price movements.
-- Red bars indicate negative price deltas below the third threshold, suggesting significant bearish price changes.
-- Maroon bars represent the lowest negative price deltas, indicating strong bearish price movements.
The coloration of the Price Delta line itself is determined by the line's relation to the second positive and second negative thresholds (default +/- 20) - if the line is above the second positive threshold, the line is colored lime (and is reflected in a lime arrow at the bottom of the indicator); if the line is below the second negative threshold, the line is colored fuchsia (also reflected as an arrow); if the line is between thresholds, it is colored aqua.
The Price Delta Heatmap can be used in various trading strategies and applications. Some potential use cases include:
-- Trend identification : The indicator helps traders identify periods of high volatility and potential trend reversals.
-- Volatility analysis : By observing the color changes in the heatmap, traders can gauge the volatility of an asset and adjust their risk management strategies accordingly.
-- Confirmation tool : The indicator can be used as a confirmation tool alongside other technical indicators, such as trend-following indicators or oscillators.
-- Breakout trading : Traders can look for price delta bars of a specific color range to identify potential breakout opportunities.
However, it's important to note that the Price Delta Heatmap has certain limitations. These include:
-- Lagging nature : The indicator relies on historical price data, which means it may not provide real-time insights into price movements.
-- Sensitivity to thresholds : The choice of threshold values affects the indicator's sensitivity and may vary depending on the asset being traded. It requires experimentation and adjustment to find optimal values.
-- Market conditions : The indicator's effectiveness may vary depending on market conditions, such as low liquidity or sudden news events.
Traders should consider using the Price Delta Heatmap in conjunction with other technical analysis tools and incorporate risk management strategies to enhance their trading decisions.
Priceactionanalysis
Candle Color OverlayDescription:
The Candle Color Overlay (CCO) indicator is a powerful tool for visualizing price movements on a chart. It overlays the chart with customizable colors, highlighting bullish and bearish candles based on their open and close values. This indicator helps traders quickly identify the direction of price movements and assess market sentiment.
How it Works:
The Candle Color Overlay indicator performs the following steps:
1. Calculation of the OHLC (Open, High, Low, Close) values for each candle based on the selected timeframe.
2. Classification of each candle as bullish or bearish:
- A bullish candle is when the closing price is greater than or equal to the opening price.
- A bearish candle is when the closing price is lower than the opening price.
3. Overlaying colors on the chart:
- The indicator applies a bullish color to the background when candles are classified as bullish and a bearish color to the background when candles classified as bearish. This overlay provides a visual representation of price movements.
4. Optional display of price movement labels:
- If enabled, the indicator shows a text label at the bottom of the current candle, indicating the percentage increase or decrease in price during a bullish or bearish background period.
Usage:
To effectively use the Candle Color Overlay indicator, follow these steps:
1. Add the indicator to your chart from the list of available indicators.
2. Configure the indicator's inputs:
- Choose the desired color for bullish candles using the "Bullish Color" input.
- Select the preferred color for bearish candles using the "Bearish Color" input.
- Specify the timeframe for analysis using the "Time Frame" input (default is 1 hour).
- Optionally enable the "Show Background Price Movement" input to display the percentage increase or decrease in price during each background period.
3. Analyze the colored overlay:
- Bullish colors represent candles where the closing price is greater than or equal to the opening price, indicating bullish sentiment.
- Bearish colors represent candles where the closing price is lower than the opening price, indicating bearish sentiment.
4. If enabled, observe the price movement labels
5. Combine the insights from the colored overlay and the price movement labels with other technical analysis tools, such as trend lines, support and resistance levels, or candlestick patterns, to make well-informed trading decisions.

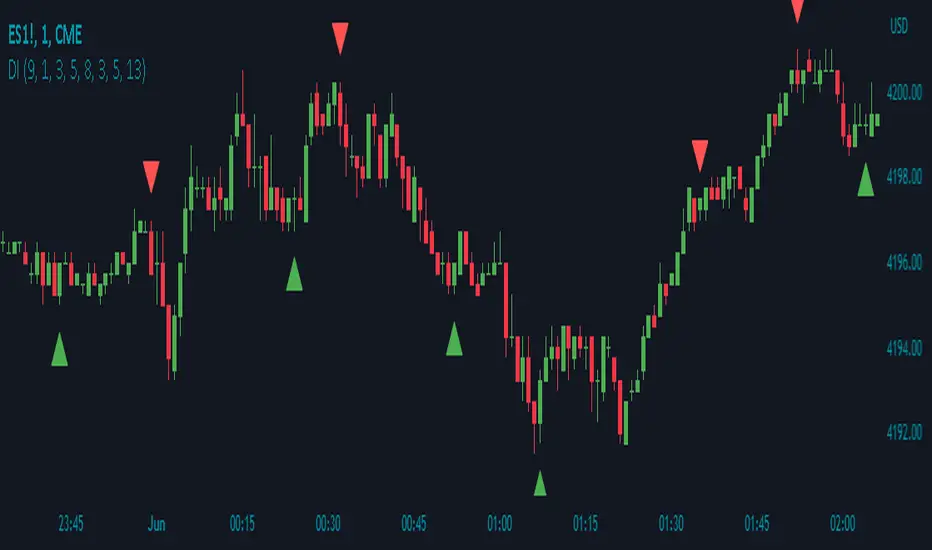
Divergence IndicatorDescription:
The Divergence Indicator (DI) is a powerful technical analysis tool designed to identify potential bullish and bearish signals based on multiple indicators, including RSI, Stochastic Oscillator, MACD, and EMA. It helps traders spot divergences between price and these indicators, indicating potential trend reversals or continuations.
How it Works:
The Divergence Indicator compares various indicators and their relationships with price to identify bullish and bearish signals. It considers conditions such as rising or falling values of the Stochastic Oscillator (%K), RSI, and MACD lines, as well as the crossover and crossunder of the MACD Line and Signal Line. Additionally, it evaluates the relationship between fast and slow Exponential Moving Averages (EMA) to detect divergences. When a bullish or bearish condition is met, circles are plotted on the chart to highlight the signals.
Usage:
To effectively utilize the Divergence Indicator, follow these steps:
1. Apply the DI indicator to your chart by adding it from the available indicators.
2. Customize the color settings to suit your preferences. The bullish and bearish colors determine the colors of the plotted circles.
3. Observe the circles plotted on the chart:
- Bullish circles indicate potential bullish signals.
- Bearish circles indicate potential bearish signals.
4. Interpret the signals provided by the indicator:
- A bullish signal may occur when there is price divergence accompanied by rising values of the Stochastic Oscillator (%K), RSI, and MACD lines, or when the MACD Line crosses above the Signal Line. Additionally, a histogram value close to zero may strengthen the signal.
- A bearish signal may occur when there is price divergence accompanied by falling values of the Stochastic Oscillator (%K), RSI, and MACD lines, or when the MACD Line crosses below the Signal Line. A histogram value close to zero may also strengthen the signal.
5. Be cautious of false signals by considering additional factors such as the relationship between the fast and slow Exponential Moving Averages (EMA). If the EMAs or MACD values do not support the identified divergence, the signal may be less reliable.
6. Combine the signals from the Divergence Indicator with other technical analysis tools, such as support and resistance levels, trend lines, or candlestick patterns, to confirm potential trade setups.
7. Implement appropriate risk management strategies, including setting stop-loss orders and position sizing, to manage your trades effectively and protect your capital.
Note: The Divergence Indicator provides valuable insights into potential trend reversals or continuations based on divergences between price and multiple indicators. However, it is recommended to use this indicator in conjunction with other technical analysis tools and perform thorough analysis before making trading decisions.
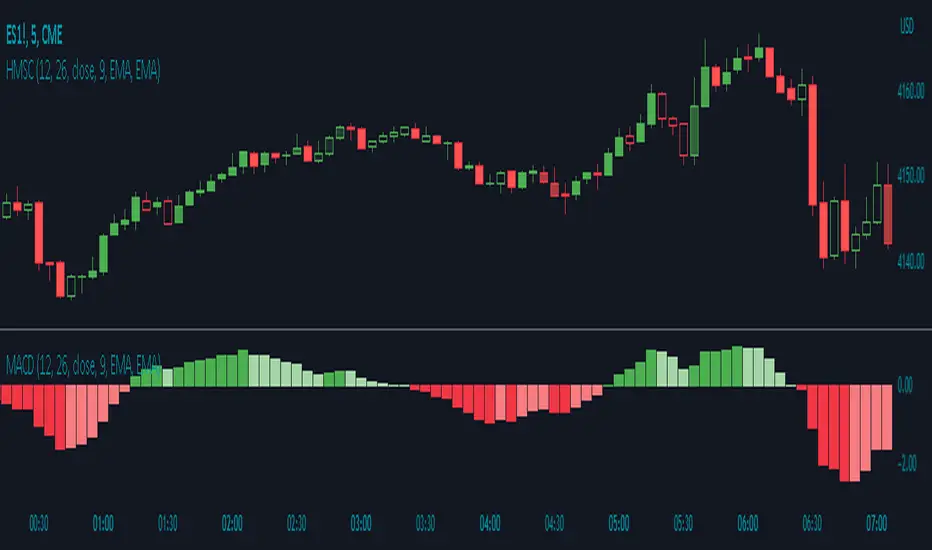
Histogram Momentum Shaded CandlesDescription:
The Histogram Momentum Shaded Candles indicator (HMSC) is a powerful technical analysis tool that combines the concepts of the MACD (Moving Average Convergence Divergence) indicator and shaded candlestick visualization. It provides insights into momentum and trend strength by representing the MACD histogram as shaded candles on the chart.
How it Works:
The HMSC indicator calculates the MACD (Moving Average Convergence Divergence) using user-defined parameters such as the fast length, slow length, source, signal smoothing, and moving average types. It then calculates the MACD histogram by subtracting the signal line from the MACD line. The indicator transforms the histogram values into transparency levels for the shaded candles, representing bullish and bearish momentum.
Usage:
To effectively utilize the Histogram Momentum Shaded Candles indicator, follow these steps:
1. Apply the HMSC indicator to your chart by adding it from the available indicators.
2. Customize the MACD settings such as the fast length, slow length, source, signal smoothing, and moving average types according to your trading preferences.
3. Observe the shaded candles plotted on the chart:
- Bullish shaded candles (green by default) indicate positive momentum and potential buying pressure.
- Bearish shaded candles (red by default) indicate negative momentum and potential selling pressure.
4. Assess the intensity of the shaded candles:
5. Shading intensity is determined by the magnitude of the MACD histogram, with higher values resulting in more opaque candles.
6. The shading intensity reflects the strength of momentum and can help identify significant shifts in price action.
7. Combine the analysis of shaded candles with traditional candlestick patterns, trend lines, support and resistance levels, and other technical indicators to validate potential trade setups.
8. Implement appropriate risk management strategies, including setting stop-loss orders and position sizing, to manage your trades effectively and protect your capital.
Breaker Blocks with Signals [LuxAlgo]The Breaker Blocks with Signals indicator aims to highlight a complete methodology based on breaker blocks. Breakout signals between the price and breaker blocks are highlighted and premium/discount swing levels are included to provide potential take profit/stop loss levels.
This script also includes alerts for each signal highlighted.
🔶 SETTINGS
🔹 Breaker Blocks
Length: Sensitivity of the detected swings used to construct breaker blocks. Higher values will return longer term breaker blocks.
Use only candle body: Only use the candle body when determining the maximum/minimum extremities of the order blocks.
Use 2 candles instead of 1: Use two candles to confirm the occurrence of a breaker block.
Stop at first break of center line: Do not highlight breakout signals after invalidation until reset.
🔹 PD Array
Only when E is in premium/discount zone: Only set breaker block if point E of wave ABCDE is within the corresponding zone.
Show premium discount zone: Show premium/discount zone.
Highlight Swing Break: Highlight occurrences of price breaking a previous swing level.
Show Swings/PD Arrays: Show swing levels/labels and pd areas.
🔶 USAGE
The Breaker Blocks with Signals indicator aims to provide users with a minimalistic display alongside optimal signals to be aware of for finding trade setups as shown below.
Here we can see a MSS occurred allowing the indicator to detect a Breaker Block (-BB) & display a red arrow to confirm this signal.
The signal(s) that can be used for potential entries are only during retests of the breaker blocks.
A potential strategy traders could use with this indicator is to target the corresponding Discount PD Arrays detected (for a short position) and Premium PD Arrays (for a long position).
In the image above we can see price generated the potential entry signals in orange & fell to the Discount PD Arrays as a logical setup to look for with this indicator.
As we can see in the image above, signals can be considered invalid when price closes above the 50% level in which it would be suggested to wait for another setup.
Users still looking for more potential setups based on the same breaker block can disable the "Stop at first break of center line" setting within the settings menu.
In the image above we can see a bullish example whereas price confirmed a bullish breaker block (+BB), had a quick pullback into it that was confirmed by the green arrow, and then reached the Premium PD Arrays.
While retests of breaker blocks can still function well if they occur later in the price action, it's most preferable for users to look for entry signals that are near confirmed breaker blocks (5-10 bars) opposed to waiting 20+ bars.
Additional take profits based on the occurence of the breaker blocks are given in order to provide targets after the occurence of a breaker block breakout.
🔶 DETAILS
Breaker blocks are formed after a mitigated order block, these can provide change of polarity opportunities, thus playing a role as a potential support/resistance. It is the re-test/retrace of price to a breaker block that will set the conditions to provide signals.
The above chart describes the creation of a breaker block.
The signal generation logic makes use of various rules described below:
Bullish Breaker Blocks:
opening price is within the breaker block, while the closing price is above the upper extremity of the breaker block.
Price did not cross the breaker block average in the interval since the previous breakout.
Bearish Breaker Blocks:
opening price is within the breaker block, while the closing price is below the lower extremity of the breaker block.
Price did not cross the breaker block average in the interval since the previous breakout.
When a new pattern is formed, all previous drawings are removed.
🔶 RELATED SCRIPTS

Advanced Price Direction bar colorsIn the advanced price direction algorithm situations of faltering price directions (fda) are identified.
These are very interesting, because this happens at tops, flags and trend turns.
I got the idea of coloring the bars with fda in a distinguishing color, reddish gray for fda down and blueish gray for faltering up.
The remaining bars retain standard color, but now this color 'confirms' the trend.
To show that this is true, I also plot a simple moving average (sma) with the same length in the chart.
It turns out that somehow the bars react to being above or below the sma, but also react to the direction of the sma.
Very interesting.
Have fun

Happy BarsThis script works to help the trader quickly visualize specific moments in time, where certain price action bars are taking place.
Highlighting:
- inside bars
- outside bars
- inside inside bars
- inside outside bars
- outside outside bars
and allowing the trader to set alerts once the bar patterns are confirmed.

Big 8 Intraday TICKAt the start of each trading day (0930 EST), this indicator calculates the intraday price difference between open and close for the eight largest market cap stocks (AAPL, AMZN, GOOGLE, META, MSFT, NFLX, NVDA, and TSLA), assigns a +/-1 for each, and then plots the cumulative change. An EMA has been added for smoothing purposes that is set to 5 but can be changed. Please note indicator is best used on lower timeframes (15 min or less) and has no applicability to time frames above 1 hour.
The thought behind this indicator is those eight major stocks drive a majority of intraday price change in indices like SPY and QQQ that are heavily weighted towards these stocks, therefore they should be a leading indicator in price change. You can often catch a move in SPY or QQQ one to two bars (on 1 min chart) ahead of the actual move because you see this indicator moving strong to one direction.
It's not perfect as there are divergences you will see when you compare historical charts, but oftentimes those divergences ultimately lead to significant price swings in the same direction as this indicator, so recommend being on watch to pull the trigger when you see those and price confirms.
You can use this indicator in a few ways:
1. Confirmation that your current trade is in the same direction as this indicator
2. Use the zero cross as a trigger for put or call entry
3. Focusing only on calls/longs if the value is above 0, or only puts/shorts if the value is below zero. Just be sure to keep an eye on reversals.
If you have recommendations on how to improve, let me know and I'll do my best to make changes.

Price Distance RatioThis study plots the ratio between current price and the price N days ago.
With N input that is configurable, users can find optimal long/short entries when price is in an established trend and price has diverge far from a given local peak or all time high.
With many years of stock trading the analysis indicates a connection between the distance of price and subsequent returns.
Portfolios of stocks with lower price to local highes ratios generally underperformed portfolios of stocks with higher prices to peaks reached similar N days ago.
The highest returns to previous peak are recorded when buying at the biggest dip.
For example, the purchase at 20% drawdown could generate 25% when price returns to the peak. The purchase at 50% drawdown could generate bigger, i.e. 100% return, when price returns to the peak. And the purchase at 90% drawdown could generate much bigger, i.e. 900% return, in a case the price returns to the peak.
However, buying very far below local peaks on almost all holding periods produces lower CAGR returns because of "timing adjustment". In simple words, typically the drawdown takes less time vs. further recovery.
For example:
👉 The largest BTC drawdown in 2013-2015 took 410 days (Peak-to-Valley) . And the recovery of BTC to new highs took 771 days (Valley-to-Peak) after that.
👉 The 3rd longest drawdown in BTC took 363 days (observed from December 17, 2017 to December 15, 2018). And further recovery in BTC to its new high took almost two years - 716 days .
👉The 4th longest drawdown in BTC took 162 days (observed from June 08, 2011 to November 17, 2011). And further recovery in BTC to its new high took more than a year - 469 days .
The concept of this study could recognizes at least 4 different modes of action.
👉 In a clearly established upward trend traders should be buying (following the trend) when Ratio is above 100% and reducing the size when Ratio turns below 100%.
👉 Conversely, in a clearly established downward trend traders should be shorted when Ratio is below 100% and covering when the Ratio turns back to 100%.
👉 In a sideways movement traders are advised to wait carefully if the Ratio near 100% for a long time, and take a position the trend is clear.
👉 Chartists can analyze the dynamic of the indicator - both in terms of trends and overall level. For example as it shown at the chart.
The understading of the study and rules of "timing adjustments" could genarate the awesome opportunities for stock options traders also, with strategies of selling uncovered call options and vertical call spreads.
// Many thanks to @HPotter and @Wheeelman wizards for their continious support and assistance.

RSI Accumulation/Distribution [M]Hello everyone,
After my long tests, I observed that the rate of change of direction of the price was high after the periods when the RSI spent a long time outside the band. As a result of my observations, I prepared this indicator.
This indicator shows you the accumulation and distribution areas that occur outside the rsi band.
There are 3 different levels available.
Level 1 = 5 Bars
Level 2 = 7 Bars
Level 3 = 9 Bars
For example, if the RSI spends more than 9 bars below the 30 level or above the 70 level, it will paint that area red. Levels can be changed from the indicator settings. The rsi is smoothed with simple moving average to reduce fake signals.
Using the RSI A/D indicator with different indicators or patterns will increase your success rate.
Examples:

((Bearish)) Candle Above EMASGood Morning from the UK.
Todays script is a simple vieweing of when candles close above a certain moving average - when the market is bearish conditions - candle which close above the moving average can be viewed as a bearish signal along with confluences such as price action. This script is best on the Daily and we can expect big price moves away from this area.
The below example, we have a bearish set up with a break of trendline and then a break of a base which would 1) strong area as price is unlikely to go past this area which would make this a supply zone.
This was then followed by the signal of the candle closing above the 100ema and the 50ema.
The script is likened to my one of my previous scripts which portrays the bullish ema candle closes.
I will be making a price action publish soon if that is of interest to the public.

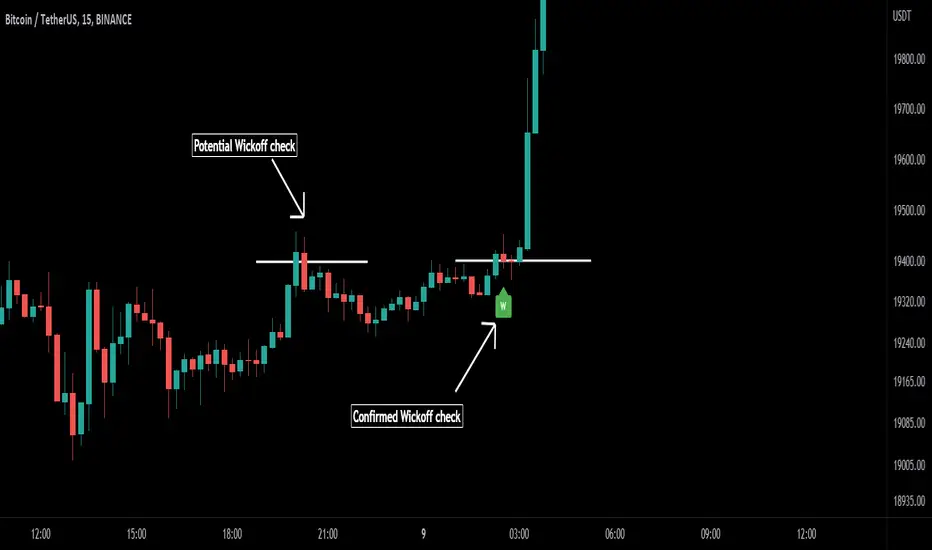
Wick-off Check Pattern [Misu]█ This Indicator shows a wick-off check pattern.
This pattern appears when a candle goes below a level (support or resistance) and closes above it OR when it goes above a level and finishes below it. This causes a wick to go through the level: a wick-off check .
This can confirm a pullback or a breakout.
█ Usages:
This indicator can be used to validate a resistance or support level.
It can also be used to validate breaking levels.
█ Parameters:
Deviation: Parameter used to calculate pivots.
Depth: Parameter used to calculate pivots.
Wickoff Mode: Mode used to detect Wickoff check pattern.
> counter pattern: only shows "pullback" wickoff check.
> breakout pattern: only shows "breakout moves" wickoff check.
> both: shows both.
Lenght Avg Body: Lenght used to calculate the average body size.
First Breakout Factor:
Lenght Avg Wick Validation: This factor multiplied by the "body avg" filters out the non-significant breakout.
Factor Avg Wick Validation: Lenght used to calculate the average wick size.
Max Bars Wickoff: This factor multiplied by the "wick avg", filters out the non-significant wickoff signals.
Price Action in action
What?
Price Action in Action is an indicator to help Price Action learners and practitioners to get everything related for Price Action in one place.
Price Action is:
Price + Volume = Action
In this indicator, we have the following features available:
Support/Resistance
Using the RSI with different periods in a multiple of 7 (7, 14, 21, 28), we first determine the overbought (above 70, customizable) and oversold (below 30, customizable) regions. Then we pick up the highest point and lowest point in the RSI values in the overbought and oversold regions, respectively. These are the point, historically supply/demand emerged for surety to push down/up the RSI indicator and the corresponding price. So, these are the most accurate way, we believe, to draw support/resistance (or demand/supply) in the chart. By default, the Support is green color and Resistance is red color. To give a visual representation, we differentiate the different shades of green and red. For example, for Level-1 (i.e. 7 by default) we use the darkest shade (0 transparency) and Level-4 (i.e. 28 by default) we use lighter shade (60 transparency). Note please: you can customize the color of support and resistance lines (say if you want resistance as green and support as red). The respective shades (transparency) will be automatically adjusted accordingly. But those shade (transparency) levels are not customizable, they are fixed (please bear with it for version-1 at least).
Strength of Support/Resistance
In the chart above/below the Resistance / Support lines you can see the tiny labels with some numbers like 1, 2.
We found out how many times a particular support/resistance is appearing across multiple RSI periods. E.g. if price P1 appears 2 times among 4 different RSI periods, the number will be 2 for that calculation, and so on.
There can be multiple presence of these numbers in a support/resistance line (i.e. multiple tiny labels). Something like: 1, 1, 2 (into different candles). This means the same support/resistance is tested so many times in different occasion (means there is a RSI max/min coincides in this level over multiple occasions) at different candles.
This will help you to intuitionally gauge the “strength” of a support/resistance line.
The more the marrier, unworthy to mention.
Candle Stick Patterns
Well: we don’t need to tell anything about the Candlestick. All of you know it better than us. And it’s a time proven, zero-lag mechanism to judge the Price-Action is unfolding in the market. We do not know if there is anything better possible than this time tested patterns to judge the prevailing sentiments of market.
Price-Action does not complete without finding out the Candlestick Patterns correctly.
And in this indicator your will get all of these: Single Candle such as Doji (default off), Marubozu, Spinner, hammers, inverted-hammer etc. ; 2 candles like Tweezer, Inside Candle, Engulfing; 3 candles like morning star/evening star.
In the multi candle patterns (2/3 candles), we are grouping the candles with a dotted rectangle such that it is clear which 2/3 candles are part of the pattern. E.g. Morning Star: 3 candles are grouped in a dotted rectangle and the Morning Star label will come to the latest candle (3rd most – as the pattern is detected reliably only on the completion of the 3rd final candle).
Of course, any program can not eliminate your trained eyes and brain to capture the patterns. But we have provided sufficient knobs to adjust various parameters to tweak the candle-pattern detection. Such as Strict Inside Candle(Harami) Boolean knob where the whole current candle including wicks will be inside the body part of the previous big candle. For non-strict mode, the current candle just inside the previous candle, possibly by wicks.
To make it better usable, for every such knobs (which are not obvious) we have added user-friendly tooltip (just mouse hover the question mark (?) besides the control/switch). There are plenty of it.
Volume
Here we have a rudimentary (yet effective) way to judge the volumes.
We find out the Volume Weighted Moving Average (VMWA) of the 20-period (default, but customizable) and the latest volume. If the latest volume is more than the 20 period vwma, we just add a grey diamond on the top of the candle to denote it’s attracting volumes. Of course, we provide a Weight coefficient (default is set to 1). So if the current bar’s volume on bar’s completion is more than the 20 period volume vmwa times the weigh-cofficient, we mark it with a tiny grey diamond.
Points to be noted:
In all places we mark the indication only on the completion of the bar (technically speaking we have checks, as far as possible, with barstate.isconfirmed). However, if you wish, you can turn it off for Candlestick (as some experts may want to check candlestick on the real time, even before the closing of bars).
In case if you see the chart looks cluttered (because of many information, specially in smaller timeframes like 5 min), there are controls given in the settings to toggle each and every features.
By default, we turn off Doji candles (all 3 types of Doji’s – normal, Gravestone & Dragonfly) as they are mainly indecision. However, you can toggle it to turn it on.
It does not give you any Buy/Sell call. The interpretation it does not have.
Why?
What’s unique in it?
As we already mentioned our intention is to include Price (in forms of Support / Resistance), Volume and Action (sentiments in terms of Candlestick patterns) into a single place. And so far, to the best of our knowledge, we could not come across a single indicator provides all of these.
There were works available to determine the RSI based support / resistance zones. Those are great piece works at that time (lets say 3 years back when PineScript was in earlier versions). To the best of our knowledge those does not cover up finding out the lowest / highest point of RSI and the corresponding price to get the simplistic and distinct support/resistance lines.
We have the intuitive support/resistance strength included which we could not found out in current set of available indicators.
To the best of our knowledge, there seems no indicator can detect 3-candle patterns which are extremely popular to detect trend reversals (such as Morning Star or Evening Star). Moreover for the multi-candle patterns we are grouping the candles part of the pattens (2-candles or 3-candles) using a dotted rectangle such that it’s visually clearly (and a well educative material for Price-Action learners also).
Mentions:
There are many works which inspire us along the way. Honestly: we sometimes forgot which all indicators we experimented with. We are sincerely apologetic in case we forgot to mention. A few note-worthy:
There is an indicator from user “repo32” named as “Candlestick Patterns Identified (updated 3/11/15)”. (We could not be able to contact “repo32”). We are inspired from his work that it’s feasible to detect Candlestick patterns.
There is an awesome work done by “RSI Based Automatic Demand and Supply” by user “shtcoinr”. The idea of consulting multiple RSI levels to find out the demand/supply zone we inspired from him. (We did contact “shtcoinr” and got his kind permission to use the concept.)
We are greatly thankful to these abovementioned wizards for their pioneering a-prior work in this front.
And of course, this TradingView platform to provide this abstraction, facilitates and felicitates collaborative contributions.
Ultimately, what’s for you?
That’s the main question. What’s for you?
Price-action comprises of following 3 tasks (at least):
Draw support/resistance lines in the chart.
Once price reaches at the support/resistance line, you fervently look out the candles’ formation to mentally map to the candle patterns. Your aim is divine: You want to judge if the price-action will continue or take a rejection/reversal.
Then you double-confirm with the volume (in a non-overlaid chart below).
Finally take a trade.
For a price-action newbie or seasoned, expert practitioner, you must be doing all the above tasks regularly and manually, in a mechanical, mundane way. There come the humanly subjectivity & the inevitable emotions . This indicator, being a piece of program/code in PineScript latest version v5 , eliminates (or at least, reduces to a great extend) that subjectivity & emotions out of the way of decision making . Thus resulting better yield.
Of course, you can argue that you draw slanted trend lines also. We recommend an already existing indicator by user LuxAlgo named as “Trendlines with Breaks ”, if you wish so.
Disclaimer:
This piece of software does not come up with any warrantee or any rights of not changing it over the future course of time.
We are not responsible for any trading/investment decision you are taking out of the outcome of this indicator.
Happy trading.

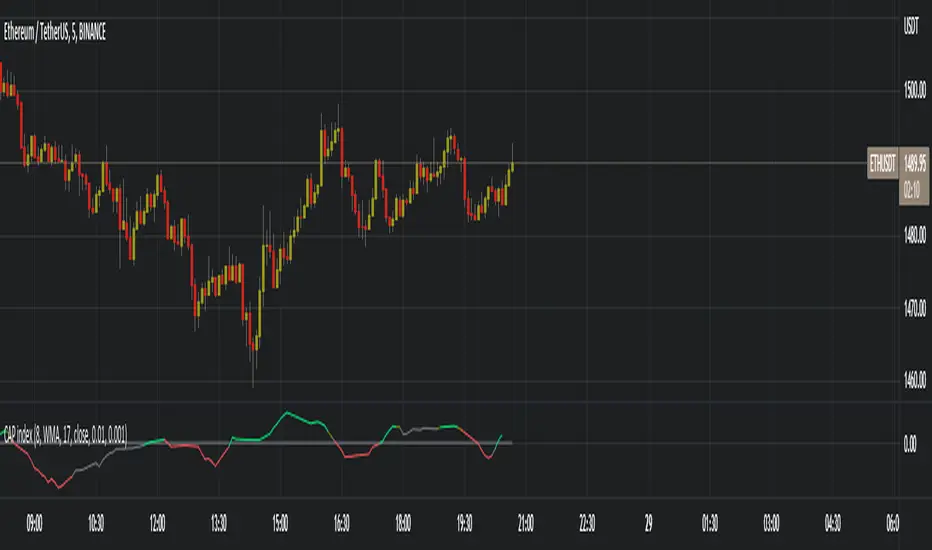
Constantly Applied Pressure Index (CAP index)BINANCE:ETHUSDT
The CAP index is my own homebrew trend indicator made to help traders see the slightly bigger picture, because we all know that as traders we can tend to hyper-focus in on a few candles and end up making a stupid trade because of it, or is it just me ? On a more serious note this indicator helps you find the short term trend by looking at bullish and bearish candles comparing their sizes, volumes and predominance.
The indicator has many technical settings for you to play around with but on the defaults it will render in a few colors which I will explain. Gray means no trend or that the current trend has died, bright green or red mean that a trend has formed, is playing out or that there is a good change a strong trend is about to form. Obviously green means bullish and red means bearish. Finally darker green and red mean a weak or weakening trend, this serves as a warning if you are about to take a trade in the trend direction.
The way I recommend using the indicator is the same way many trend indicators are used, as a filter to either a different indicator creating trading signals or to your own strategy's signals. I would add an illustration here that I prepared but I cannot because of tradingview's reputation rules
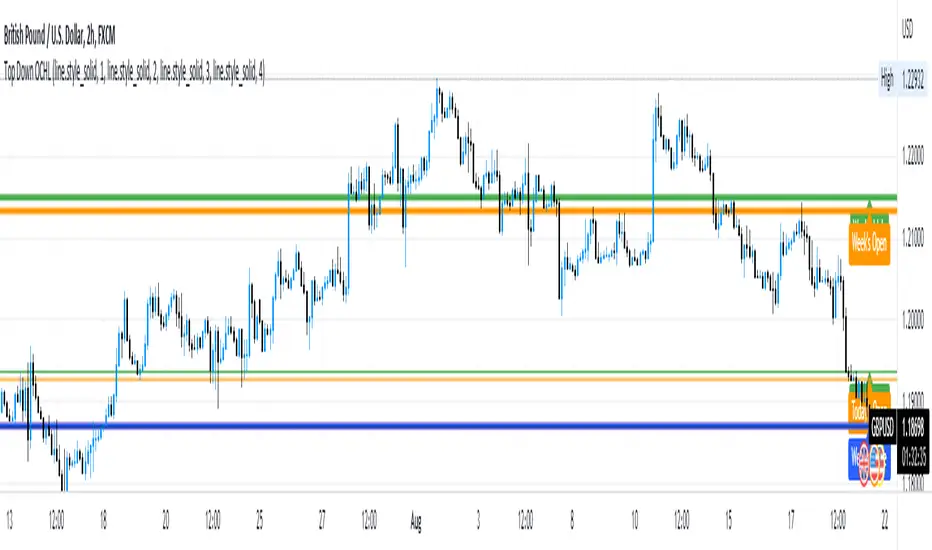
Opens, Closes, Highs and Lows.Hello Traders, the script below is designed to display the monthly, weekly, previous days' and current days' open, close, high and low.
I designed it to assist in top down analysis by knowing the monthly and weekly opens and closes it makes it a lot easier to make trading decisions on the lower timeframes.
As the user you can choose which price values you'd like displayed on the chart by selecting them in the user inputs.
Enjoy!!
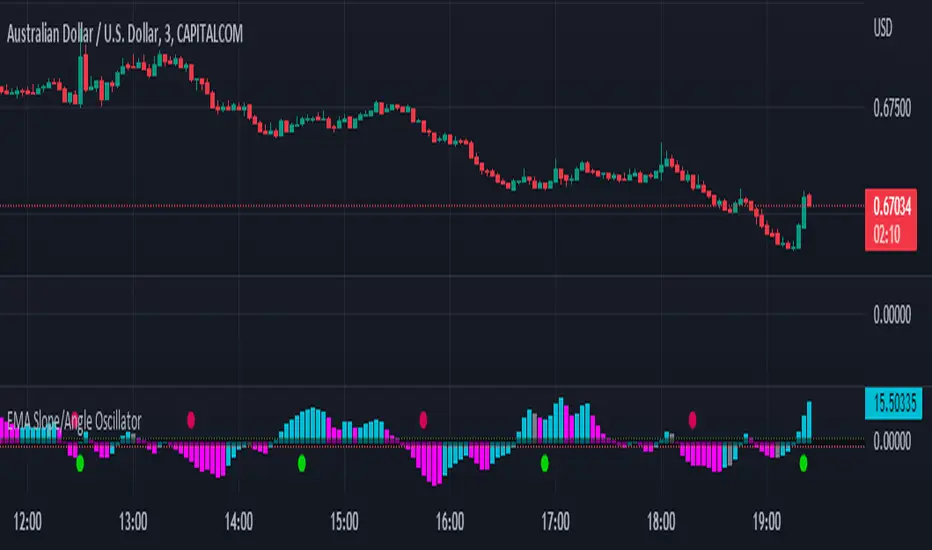
EMA Slope/Angle OscillatorEMA Slope/Angle Oscillator, Multiple Moving Average Oscillator, Multiple type
Moving Averages HMA,EMA,WMA,SMA, VWMA,VWAP provided.
The angle is calculated between the Slow MA and Fast MA and the difference between the angle is plotted as Histogram.
Additionally Buy Sell Signals are plotted as green and red Dots.
its very easy to judge the movement of price Bearish/Bullish.
Bearish if price below 0 line
Bullish if price above 0 line
Zero crossing is Moving Average Crossover.
Trend Filter is provided to filter opposite signals.
Angle Threshold is provided to filter low angle false signals.
Dead zone is plotted around Zero Line. Trades can be taken after Threshold angle or Dead zone is crossed
Its interesting to see how different Moving Averages move along with price Action.
Bobbin DetectorENGLISH
BOBBINS (cluster)
BOBBINs can also be called clusters. In the region where the price sees an up and down
similar to side-by-side BOBBINs formed by clustering. The decision is the region.
In the BOBBIN formation, the bars are not taken into account much at first. with BOBBINs
When using other formations, attention should be paid to the needles.
through
Sellers dominate from above, price falls; price with more buyers below
comes out again. Until either side gives up or one side of a buy or sell order
This go-and-go movement continues until it ends. When finished, the BOBBIN dissolves and destroys
The movement towards the shadow continues.
Often the BOBBINs are voluminous untied. A strong candle with momentum
bar is formed. This is where Supdems, that is, supply-demand drawings come into play.
TÜRKÇE
BOBİNLER
Bobinlere küme de denilebilir. Fiyatın bir yukarı bir aşağı doğru giderek aynı bölgede
kümelenmesiyle oluşur, yan yana dizilmiş bobinlere benzer. Karar bölgesidir.
Bobin oluşumunda barların iğneleri ilk başta çok dikkate alınmaz. Bobinler ile birlikte
başka formasyonlar kullanılırken iğnelere dikkat edilir.
Yukarıdan satıcılar baskın çıkar, fiyat düşer; aşağıda alıcıların fazla olmasıyla fiyat
tekrar çıkar. İki taraftan biri pes edinceye kadar ya da alış ya da satış emirlerinin bir tarafı
bitinceye kadar bu git-gel hareketi devam eder. Bittiği zaman bobin çözülür ve yok ettiği
gölgeye doğru hareket devam eder.
Çoğu zaman bobinler hacimli bir şekilde çözülür. Momentumlu, kuvvetli bir mum
çubuk oluşur. İşte burada da Supdem’ler yani arz-talep çizimleri devreye girer.
kaynak:
Price Action TR

HorseShoe - At NalıHorseShoe - At Nalı
English
HORSEHOE FORMATION
It is actually a kind of bobbin. As with the bobbin, the needles of the candles are not taken into account much.The difference is that there are only four candlesticks in this formation. There is no limit to this in the bobbin.In addition, it is important which of the bars forming the bobbin is longer or shorter than which.is not. This is very important in a horseshoe. There is a rule for the length and shortness of the bars.Candlesticks in a horseshoe showing the bearish sequentially rising, falling, rising and repeatingin the form of falling bars. Also the lengths of the first and fourth bars, i.e. price opening andThe differences between the closing must be longer than the second and third bar. So those on the sideshould be clearly larger than the middle ones. For the rise, the bars are falling-rising-falling in order.The rising candle should be in the form of a bar. Likewise the first and last barsshould be longer than the middle ones.Of the first and fourth bars, it is better if the fourth bar is longer than the first.was the signal. But the fact that they are equal or the first one is long does not mean this formation. Attentionthe first and last bars that need to be beat are clearly longer than the middle onesrequired. A millimeter long means a very weak signal.
It is valid for every price and parity. But this is not a magic wand, so every horseshoemay not be the correct signal. Trend, Supdem, Correlation and other similar components are alsois involved, a highly efficient signal is formed. Well reviewed onexperience must be gained. More like an indicator to show the direction of the price rather than a signalshould be used.
Turkish
AT NALI FORMASYONU
Aslında bir tür bobindir. Bobinde olduğu gibi mumların iğneleri çok dikkate alınmaz. Farkı, bu oluşumda sadece dört mum çubuk vardır. Bobinde bunun sınırı yoktur. Ayrıca bobini oluşturan barların hangisinin hangisinden uzun ya da kısa olduğu önemli değildir. At nalında bu çok önemlidir. Barların uzunluğu kısalığı ve sırasında bir kural vardır. Düşüşü gösteren at nalında mum çubuklar sırayla yükselen düşen yükselen ve tekrar düşen barlar şeklindedir. Ayrıca birinci ve dördüncü barların uzunlukları, yani fiyat açılış ve kapanışı arasındaki farkları, ikinci ve üçüncü bardan daha uzun olmalıdır. Yani kenardakiler ortadakilerden net bir şekilde büyük olmalı. Yükseliş için ise barlar sırayla düşen-yükselen düşen-yükselen mum çubuk şeklinde olmalıdır. Aynı şekilde ilk ve son barlar ortadakilerden uzun olmalıdır. Birinci ve dördüncü barlardan dördüncü barın birinciden uzun olması daha güze bir sinyaldi. Fakat eşit olmaları ya da birincinin uzun olması da bu oluşumu bozmaz. Dikkat edilmesi gereken ilk ve son barların açık bir şekilde ortadakilerden uzun olması gerekmektedir. Milim farkla uzun olması çok zayıf bir sinyal olması anlamına gelir.
kaynak:
Price Action TR

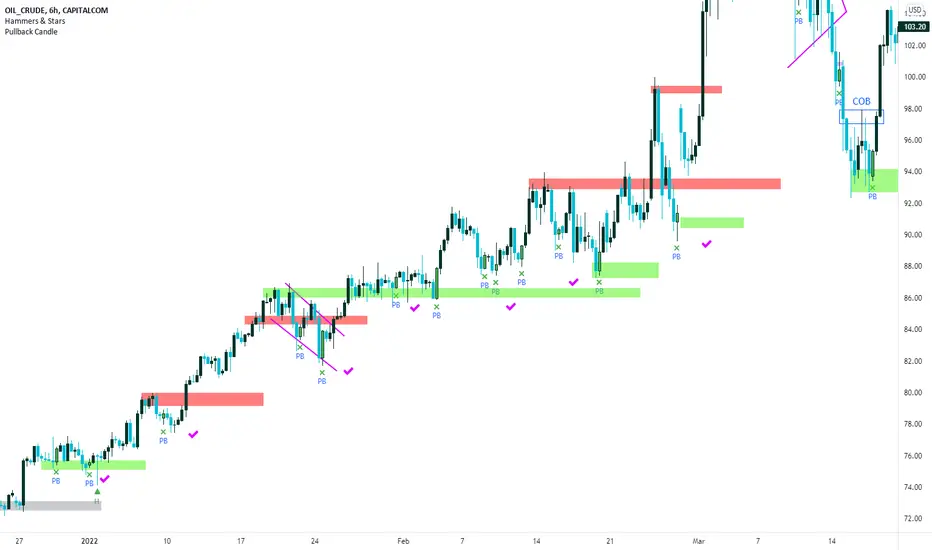
Pullback Candles (Candlestick Analysis) Guaranteed Winners!!!!Pullback Candle will signal when price is at the end of a pullback and entering a balance phase in the market (works on all markets)
Also we can expect a Pullback Candle during flash crashes as the theory of this script is when there is a turning point in momentum - this candle will appear and we can look long from this signal.
This candle will only work in Swing Low areas and appear when below an moving average which can be changed in the settings.
This candle will work on all timeframes - HTF provided very good rexpectancy whereas the LTF has a slightly less expectancy.
This candle can be alerted to signal the Pullback Candle when the bar is confirmed and not during.
The way i trade this candle is
1) Candle signal must be in probably area to increase efficiency.
2) Enter on the second candle after candle IS CONFIRMED
3) Set stop loss below Pullback Candle or use ATR value
4) Trade with the trend ie only bullish price action
5) This candle can catch falling knifes - we had one on LUNA before the rally to $7.50
6) Trading with a confluence along with the Pullback is better than solely trading this candle
Please leave a comment.
If we get to 100 likes i will publish the script.
Have a good weekend :)
DePriExchange weighted price for cryptocurrencies
DECENTRALIZED PRICE CHART FOR DECENTRALIZED WORLD
See non-manipulated , globally price action that comes from whole liquidity!
The main idea behind this script is that...
The value of each trading pair finally determined globally and the price displayed in exchanges is its own and not global! differences between exchanges, reduced to near zero gradually by market makers and arbitrages, so..
Every min tick price changes Must be backed by liquidity to be part of the global fluctuations
more liquidity gives it more credibility
more credibility give it more weight
..Against opposing movements.
This script can collect price of crypto pairs from 12 exchanges that listed on TV and have effective volume.
In the first step, summarizes the volume of all exchanges and creates the total volume
In the next step, divide each exchange volume to total volume to obtain relative weight of each exchange.
In the final step, multiply each exchange price to weight of itself and summarizes these numbers .. now, we have Exchange weighted price!
The results on high liquidity pairs like BTCUSDT, ETHUSDT, is not much differ then simple chart but when you apply it on lower liquidity, lower time frames of altcoins, you realize its benefits and usefulness. Altcoins chart in composite and simple mode is very differ, I hope you enjoy from TRUE CHART.
With this, also you can..
Filter and smooth candlestick chart with SMA or EMA
Plot a line chart of pair at your desired frame separate from the main chart for monitor important price levels
Get realtime report of whole volume of pair on included exchanges
Get realtime report of each exchange weight and share
Note.1:
some of pairs queted on more than one like BTCUSD, BTCUSDT, BTCUSDC and etc. In this pairs we choose the one that usually has more volume on that exchange.
Note.2:
At this time, supported queted currencies are BTC, ETH, USD, USDT, BUSD, USDC, USDK.
Note.3:
This script is relatively heavy! This is not cuz of bad coding.
Each bar compution contains at least one plot and some of security calls, so 10 to 15 seconds is normal load time.
Note.4:
You can combine this with your price action base scripts and use balanced OHLCV. The necessary explanations about this are available in the code.
Note.5:
You must only include exchanges that support your ticker, Otherwise you will receive an error.
I hope it comes useful to you.

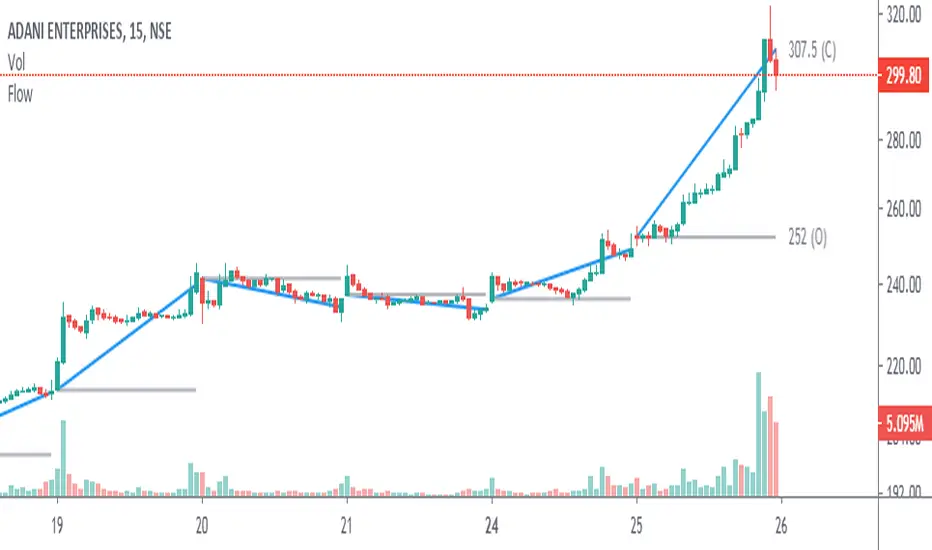
Angle & Price FlowThis is a simple end of the day indicator based on open and close values.
Angles:
Identifying narrow angles helps to find breakouts
Maximum angle = High chance of reversal
Minimum angle = Chance of breakouts on the next day or upcoming days.
Price Flow:
I personally use price flow to simplify the flow of candlestick chart and to identify breakouts using rounding bottoms and rounding top patterns, sharp corners for reversals.
Features:
Multi time frame
Labels
Hide previous period
Combine it with other indicators for better result.
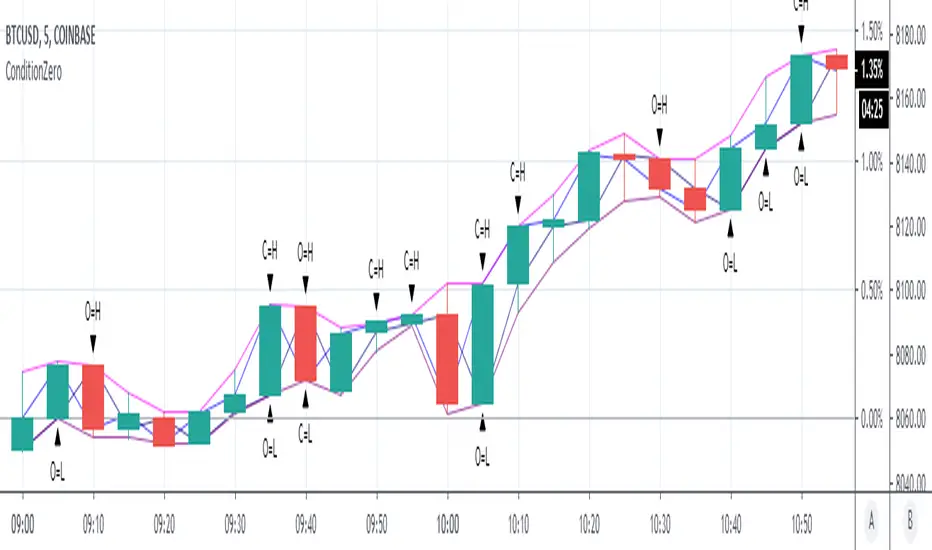
ConditionZeroThis study is a proof of concept analysis of situations that can lead to divide with zero or divide by zero conditions. Such situations can lead to mathematical errors, and can increase the potential for false alerts.
One common formula that is prone to this situation is:
pct=(high-close)/(high-low)
This is used to calculate percentage change of a candlestick.
Common outcomes are 0/0, 0/x, x/0, where x is a non zero value.
Visualizing this situation allows for more robust script development and deployment.
There are no user configurations.
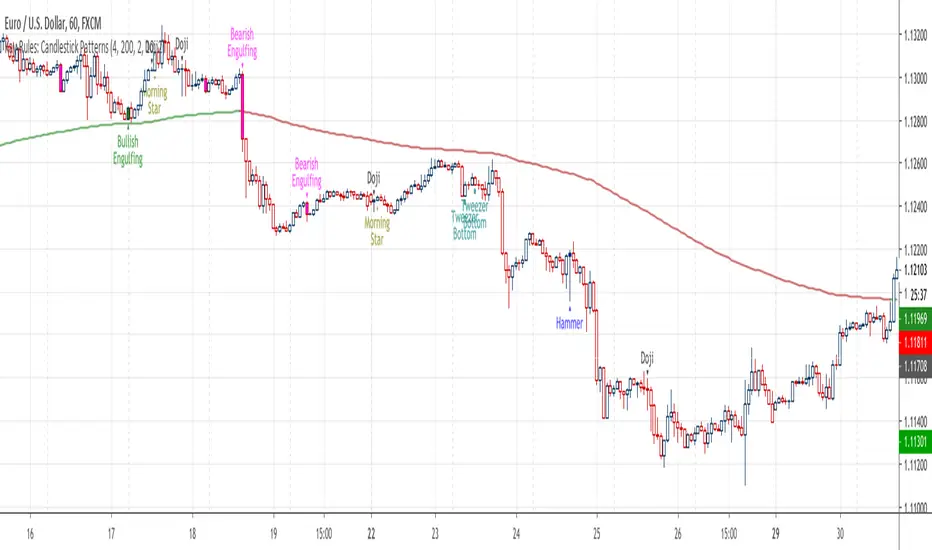
Kay-Rules: Candlestick PatternsThis indicator will mark 5 different candlestick patterns:
(1) bullish & bearish engulfing
(2) hammer & shooting star doji
(3) dragonfly & gravestone doji
(4) morning & evening star doji
(5) bottom & top tweezer
You may follow candlestick trading strategy by Rayner Teo here