PowerDelta Oscillator [FxScripts]PowerDelta Oscillator
The PowerDelta Oscillator measures real-time buying and selling pressure using the proprietary PowerDelta Algorithm. By quantifying order flow, it identifies whether the market conditions favor bullish or bearish activity, helping traders determine directional bias for both trend and countertrend setups.
Calculation Methodology
The PowerDelta computes the delta (difference) between buying and selling pressure by integrating both price movement and volume behavior rather than relying solely on volume or price-based approximations like other oscillators.
The PowerDelta Algorithm evaluates six core price-volume conditions:
Price advancing with increasing volume
Price advancing with decreasing volume
Price consolidating with increasing volume
Price consolidating with decreasing volume
Price declining with increasing volume
Price declining with decreasing volume
From these conditions, the algorithm derives:
Accumulation vs Distribution phases
Buyer/Seller exhaustion points
Effort vs No Result scenarios (volume pressure failing to move price)
Operational Use
The PowerDelta Oscillator has three operational modes:
Trend
Countertrend
Blended (Trend/Countertrend hybrid)
Trend Mode
In Trend Mode, the indicator plots an oscillator that fluctuates between positive and negative values:
Positive readings indicate dominant buying pressure
Negative readings indicate dominant selling pressure
The magnitude of the reading reflects the intensity of the pressure
Crossovers at the zero line provide directional shifts:
Negative → Positive: bullish transition
Positive → Negative: bearish transition
Additionally:
Sustained positive values indicate control by buyers, long bias is favoured
Sustained negative values indicate control by sellers, short bias is favoured
The magnitude of displacement from zero provides additional confirmation of market strength or weakness
Countertrend Mode
In Countertrend Mode, the primary use of the PowerDelta Oscillator is to locate divergences between price and the oscillator (as visualised on the chart above) which helps traders pinpoint potential reversals
The oscillator is much more sensitive in this mode, making highs, lows and hence divergences, easier to spot
Like Trend Mode, the magnitude of displacement from zero provides additional confirmation of market strength or weakness
The various Analytical Scenarios detailed below provide detailed use cases for both Trend and Countertrend Mode
Blended Mode
To provide maximum flexibility, there’s also a third Blended Mode
This mode combines elements of the two primary modes and can be used as part of a hybrid approach making it easier to spot both trends and reversals
Alternative Source
The PowerDelta algorithm utilises volume data therefore it’s best to use the most reliable source of volume data for the instrument being traded
For instance, whilst XAUUSD provides excellent results with most forex brokers, slightly better results may be achieved using GC futures data which comes direct from the exchange (data package required)
To use a third-party source, select 'Alternative' and input the relevant source
This can also be used as a way to monitor correlated pairs by adding two instances of the PowerDelta to the same chart, selecting pair 1 e.g. EURUSD as the first instance and the correlated pair e.g. USDCHF as the second instance
Thorough backtesting advised
Analytical Scenarios
Accumulation: High positive oscillator readings combined with upward price movement suggest active accumulation.
Optimal strategy: Monitor pullbacks for potential long entries or wait for a divergence with price and potential reversal.
Distribution: High negative oscillator readings with downward price movement indicate distribution.
Optimal strategy: Monitor pullbacks for potential short entries or wait for a divergence with price and potential reversal.
Buyer Exhaustion: Price forms higher highs while oscillator value declines. Indicates weakening buying strength and potential bearish reversal.
Seller Exhaustion: Price forms lower lows while oscillator value contracts. Indicates weakening selling strength and potential bullish reversal.
Effort / No Result (Buyers): Positive oscillator expansion without higher highs indicates aggressive buying without price confirmation, suggesting overbought conditions and a potential bearish reversal.
Effort / No Result (Sellers): Negative oscillator expansion without lower lows indicates aggressive selling without price confirmation, suggesting oversold conditions and a potential bullish reversal.
Alerts
To trigger alerts when market bias transitions across the zero line:
Right-click on chart → Add Alert on PowerDelta
Condition: PowerDelta → Select Mode
Type: Crossing
Value: 0
Execution: Once Per Bar Close
Adjust additional parameters as required
Performance and Optimization
Backtesting Results: The PowerDelta Oscillator has undergone extensive backtesting across various instruments, timeframes and market conditions, demonstrating strong performance in identifying strong trends and reversals. User backtesting is strongly encouraged as it allows traders to optimize settings for their preferred instruments and timeframes.
Optimization for Diverse Markets: The PowerDelta Oscillator can be used on crypto, forex, indices, commodities and stocks. The PowerDelta Oscillator's algorithmic foundation ensures consistent performance across a variety of instruments. The Trend, Countertrend and Blended Modes make it easy for the trader to set up based on their individual trading style.
Educational Resources and Support
Users of the PowerDelta Oscillator benefit from comprehensive educational resources and full access to FxScripts Support. This ensures traders can maximize the potential of the PowerDelta Oscillator and other tools in the Sigma Indicator Suite by learning best practices and gaining insights from an experienced team of traders.
Pricedelta

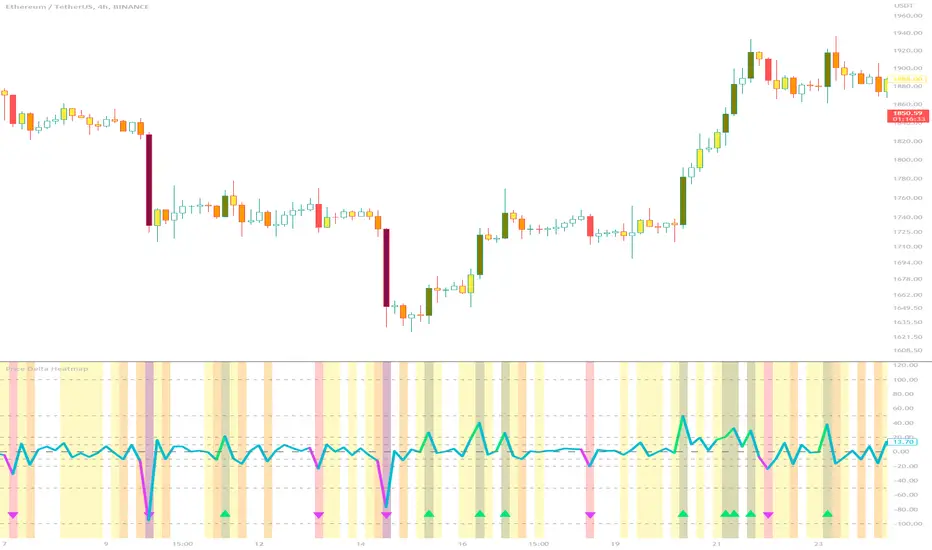
Price Delta HeatmapThe Price Delta Heatmap is an indicator designed to visualize the price changes of an asset over time. It helps traders identify and analyze significant price movements and potential volatility. The indicator calculates the price delta, which is the difference between the current close price and the previous close price. It then categorizes the price deltas into different color ranges to create a heatmap-like display on the chart.
The indicator uses user-defined thresholds to determine the color ranges. These thresholds represent the minimum price change required for a specific color to be assigned. The thresholds are adjustable to accommodate different asset classes and trading strategies. Positive price deltas are associated with bullish movements, while negative price deltas represent bearish movements.
The indicator plots bars color-coded according to the price delta range it falls into. The color ranges can be customized to match personal preferences or specific trading strategies. Additionally, the indicator includes signal shapes below the bars to highlight significant positive or negative price deltas. Traders can adjust the threshold values based on their preferred sensitivity to price changes. Higher threshold values may filter out minor price movements and focus on more significant shifts, while lower threshold values will capture even minor fluctuations.
****The default settings have the thresholds set to levels of 100, 50, 20, 10, 0, -10, -20, -50, and -100. These numbers are well-suited for assets such as Ethereum or Bitcoin which are larger in price than an asset that has a price of $1.50, for example. To compensate, adjust the thresholds in the settings to reflect the price delta on the desired asset. All coloration and horizontal line plots will adjust to reflect these changes.****
Traders can interpret the Price Delta Heatmap as follows:
-- Bright green bars indicate the highest positive price deltas, suggesting strong bullish price movements.
-- Green bars represent positive price deltas above the third threshold, indicating significant bullish price changes.
-- Olive bars indicate positive price deltas above the second threshold, suggesting moderate bullish price movements.
-- Yellow bars represent positive price deltas above the lowest threshold, indicating minor bullish price changes. This color is reflected on the negative side as well. Yellow bars below zero indicate negative price deltas below the lowest threshold, suggesting minor bearish price changes.
-- White bars represent zero price deltas, indicating no significant price movement.
-- Orange bars represent negative price deltas below the second threshold, indicating moderate bearish price movements.
-- Red bars indicate negative price deltas below the third threshold, suggesting significant bearish price changes.
-- Maroon bars represent the lowest negative price deltas, indicating strong bearish price movements.
The coloration of the Price Delta line itself is determined by the line's relation to the second positive and second negative thresholds (default +/- 20) - if the line is above the second positive threshold, the line is colored lime (and is reflected in a lime arrow at the bottom of the indicator); if the line is below the second negative threshold, the line is colored fuchsia (also reflected as an arrow); if the line is between thresholds, it is colored aqua.
The Price Delta Heatmap can be used in various trading strategies and applications. Some potential use cases include:
-- Trend identification : The indicator helps traders identify periods of high volatility and potential trend reversals.
-- Volatility analysis : By observing the color changes in the heatmap, traders can gauge the volatility of an asset and adjust their risk management strategies accordingly.
-- Confirmation tool : The indicator can be used as a confirmation tool alongside other technical indicators, such as trend-following indicators or oscillators.
-- Breakout trading : Traders can look for price delta bars of a specific color range to identify potential breakout opportunities.
However, it's important to note that the Price Delta Heatmap has certain limitations. These include:
-- Lagging nature : The indicator relies on historical price data, which means it may not provide real-time insights into price movements.
-- Sensitivity to thresholds : The choice of threshold values affects the indicator's sensitivity and may vary depending on the asset being traded. It requires experimentation and adjustment to find optimal values.
-- Market conditions : The indicator's effectiveness may vary depending on market conditions, such as low liquidity or sudden news events.
Traders should consider using the Price Delta Heatmap in conjunction with other technical analysis tools and incorporate risk management strategies to enhance their trading decisions.