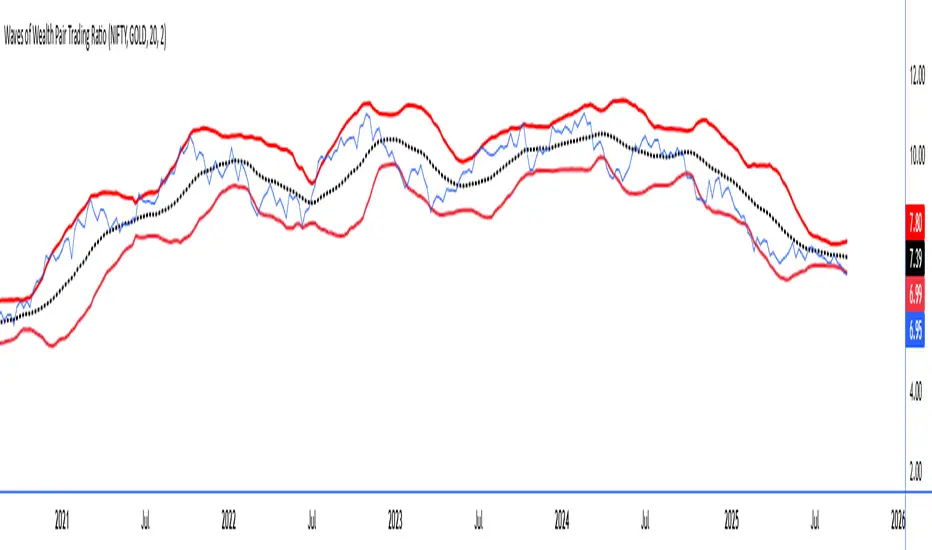
Waves of Wealth Pair Trading RatioThis versatile indicator dynamically plots the ratio between two user-selected instruments, helping traders visualize relative performance and detect potential mean-reversion or trend continuation opportunities.
Features include:
User inputs for selecting any two instrument symbols for comparison.
Adjustable moving average period to track the average ratio over time.
Customizable standard deviation multiplier to define statistical bands for overbought and oversold conditions.
Visual display of the ratio line alongside upper and lower bands for clear trading signals.
Ideal for pair traders and market analysts seeking a flexible tool to monitor inter-asset relationships and exploit deviations from historical norms.
Simply set your preferred symbols and parameters to tailor the indicator to your trading style and assets of interest.
How to Use the Custom Pair Trading Ratio Indicator
Select symbols: Use the indicator inputs to set any two instruments you want to compare—stocks, commodities, ETFs, or indices. No coding needed, just type or select from the dropdown.
Adjust parameters: Customize the moving average length to suit your trading timeframe and style. The standard deviation multiplier lets you control sensitivity—higher values mean wider bands, capturing only larger deviations.
Interpret the chart:
The ratio line shows relative strength between the two instruments.
The middle line represents the average ratio (mean).
The upper and lower bands indicate statistical extremes where price action is usually overextended.
Trading signals:
Look to enter pair trades when the ratio moves outside the bands—expecting a return to the mean.
Use the bands and mean to set stop-loss and profit targets.
Combine with other analysis or fundamental insight for best results.
Ratiotrading
Futures/Spot Ratiowhat is Futures /Spot Ratio?
Although futures and spot markets are separate markets, they are correlated. arbitrage bots allow this gap to be closed. But arbitrage bots also have their limits. so there are always slight differences between futures and spot markets. By analyzing these differences, the movements of the players in the market can be interpreted and important information about the price can be obtained. Futures /Spot Ratio is a tool that facilitates this analysis.
what it does?
it compresses the ratio between two selected spot and futures trading pairs between 0 and 100. its purpose is to facilitate use and interpretation. it also passes a regression (Colorful Regression) through the middle of the data for the same purpose.
about Colorful Regression:
how it does it?
it uses this formula:
how to use it?
use it to understand whether the market is priced with spot trades or leveraged positions. A value of 50 is the breakeven point where the ratio of the spot and leveraged markets are equal. Values above 50 indicate excess of long positions in the market, values below 50 indicate excess of short positions. I have explained how to interpret these ratios with examples below.
