5-0 Pattern ULTRA V6 [NXT2017]+Volume Profile +POC +SignalCounts5-0 Pattern ULTRA V6
This script is an advanced harmonic scanner designed specifically to detect the 5-0 Pattern. Unlike standard harmonic indicators, the "ULTRA" version scans across 9 different pivot lengths simultaneously (from 5 up to 233) to ensure no valid structure is missed, regardless of the timeframe.
It includes an integrated Volume Profile feature that automatically analyzes the volume distribution within the pattern to help validate the Point of Control (POC) near the reversal zone.
What is the 5-0 Pattern? The 5-0 is a unique 5-point harmonic structure (X, A, B, C, D) discovered by Scott Carney. It is distinct from other patterns like the Gartley or Bat because it relies heavily on specific reciprocal extensions. The completion point (D) is defined by a 50% retracement of the BC leg.
Pattern Rules used in this indicator:
The AB leg is a 1.13 to 1.618 extension of the XA leg.
The BC leg is a 1.618 to 2.618 extension of the AB leg.
The CD leg (Entry Zone) is a distinct 50% retracement of the BC leg.
Key Features of V6
Multi-Pivot Scanning: The indicator runs 9 separate scanners in the background (Pivot lengths: 5, 8, 13, 21, 34, 55, 89, 144, 233). You can toggle specific lengths on/off in the settings.
Auto Volume Profile: When a pattern is found, the script draws a Volume Profile over the structure and highlights the Point of Control (POC) line. This helps determine if there is volume support/resistance at the trade location.
Statistics Dashboard: A dashboard table displays historical data, showing how many Bullish and Bearish patterns have been detected for each pivot size on the current chart.
Smart History Filtering: Includes a mechanism to prevent duplicate patterns from cluttering the chart.
Interactive Guide: A built-in "Guide Mode" can be activated in the settings to hide signals and display a text tutorial on how to trade the pattern.
Settings & Customization
Tolerance: Adjust the inaccuracy percentage to make the scanner stricter or looser regarding Fibonacci ratios.
Visuals: Fully customizable colors for Bullish/Bearish patterns, Target lines, and Volume Profiles.
Labels: Choose between showing "XABCD" lettering or a simple "5-0" tag with the pattern size.
Alerts: Native alert conditions are set up. You can create alerts to be notified instantly when a new pattern is formed.
Risk Disclaimer: Trading harmonic patterns involves risk. The 5-0 pattern is a reversal setup; always use proper risk management and confirmation before entering a trade.
Made by NXT2017
This is a new creation of v1:
Retracement

Dynamic Swing Retracement TrackerThis indicator automatically identifies potential reversal zones within trending markets by combining momentum-based directional filters with geometric price swing analysis.
Methodology:
Directional Bias Filter: Utilizes two exponential moving averages (configurable periods, default 50 and 200) as a momentum comparison mechanism. When the faster average exceeds the slower average, bullish bias is established; the inverse confirms bearish bias.
Automated Swing Recognition: The script continuously scans for local price extremes using pivot analysis with a user-defined lookback window (default 36 bars). These extremes become anchor points for calculating potential retracement zones.
Geometric Retracement Zones: Between each pair of swing extremes, the script calculates key mathematical ratios (0.5 and 0.618) to identify zones where price is statistically likely to find support or resistance during pullbacks. These zones are used for signal generation but remain invisible on the chart.
Signal Generation Logic:
Long entry signals appear when price retraces into calculated zones during bullish bias conditions
Short entry signals appear when price retraces into zones during bearish bias conditions
All signals require full candle confirmation to eliminate intra-bar noise
A customizable cooldown mechanism prevents signal clustering
Automated Risk Visualization:
Invalidation level (traditionally called "stop loss") placed beyond the most recent swing extreme, with adjustable pip buffer for spread accommodation
Three progressive target zones calculated using geometric extensions (1.618x, 2.0x, and 2.618x multiples of the original swing range)
All price levels displayed as horizontal reference lines spanning 20 bars (10 before, 10 after the signal candle
Technical Implementation:
Swing detection uses TradingView's built-in pivot functions with symmetric lookback
Retracement calculations based on classical golden ratio mathematics
Label positioning dynamically adjusts using Average True Range to maintain visibility across different volatility conditions
All drawing objects are refreshed on each bar to comply with platform object limits
Practical Application:
This tool is designed for traders who want to systematically identify counter-trend entries within established trends. Rather than manually drawing retracement levels, the indicator automates the process and provides immediate visual feedback on potential entry zones with pre-calculated risk and reward parameters.
Customization Options:
Momentum filter periods (default 50/200)
Swing detection sensitivity
Signal spacing controls
Risk buffer adjustment
Individual component visibility toggles
Important Notes:
This indicator does not predict future price movements. It identifies historical swing patterns and mathematically-derived levels based on past price action. All trading decisions should be made in conjunction with proper risk management and market analysis.

XAUMO Gap RetraceXAUMO Gap Retrace
Educational description for TradingView (English)
📘 EDUCATIONAL ONLY — NOT FINANCIAL ADVICE
This script is for study, training and back-testing ideas. It does NOT give guaranteed
buy/sell signals and must NOT be used to promote any “risk-free” or “fixed return” schemes.
────────────────────────────────
1) What does XAUMO Gap Retrace do?
────────────────────────────────
This indicator tracks a very specific price behaviour:
» After a bar closes (and is NOT a tweezer with the previous bar),
it “arms” a target at the previous bar’s High or Low.
» It then watches to see if the market retraces to that level
on the next bar (or later, depending on your setting).
» When price touches that previous High/Low, it marks the fill,
updates a live label with distance and progress, and can fire an alert.
In simple terms:
“Every candle that closes away from the previous candle
gets a ‘magnet’ at the previous High or Low.
XAUMO Gap Retrace tells you if the very next candle comes back
to fill that gap to the previous bar.”
────────────────────────────────
2) Core logic step-by-step
────────────────────────────────
(1) Tweezer detection
• It calculates:
– prevH = previous bar’s High
– prevL = previous bar’s Low
– tol = toleranceTicks × syminfo.mintick
• If the current bar’s High or Low is within “tol” of the previous High or Low,
it is treated as a tweezer:
isTweezer = highs or lows almost equal to previous bar.
• Tweezer bars are ignored (no new target armed) to avoid noise.
(2) Target selection (Midline vs Nearest)
When a bar closes (barstate.isconfirmed) and it’s not a tweezer:
• Mode = "Midline"
– prevMid = (prevH + prevL) / 2
– If close >= prevMid → target = prevH (previous High)
– Else → target = prevL (previous Low)
• Mode = "Nearest"
– target = whichever is nearer to the close:
• prevH or prevL
The chosen level is stored in:
• lastTarget = the price level we are waiting to be filled
• lastSigIndex = bar_index of the signal candle
• needUp = true if close < target (price must go up to fill)
false if close > target (price must go down)
• baseDist = |close - target| at the signal bar
(used later to compute “progress”).
(3) Active state and fill detection
• isArmed = lastTarget is not na (we have a live target).
• isNextBar = bar_index == lastSigIndex + 1.
• isActive =
– if nextBarOnly = true → only the immediate next bar is allowed
– if nextBarOnly = false → any bar after the signal is active.
Price-touch rule:
• If needUp = true → fill when high >= lastTarget.
• If needUp = false → fill when low <= lastTarget.
This gives:
• fillNow = true on the bar where the previous High/Low is touched.
(4) Target line and fill marker
• plot() draws a line at lastTarget (with linebreak style) while armed.
• plotshape() draws a tiny circle at the touch price when fillNow is true,
labelled “fill”.
(5) Live distance / progress label
A single live label (liveLbl) shows live stats on the last bar:
• dist = |close - lastTarget|
• distTicks = dist / tick
• progress = how far the market has moved towards the target since the signal:
– 0% = no progress
– 100% = fully filled
(internally clamped between 0 and 1 with a custom clamp function).
If showLabel is ON, on the last bar:
• Old label is deleted,
• New label is created at (bar_index + liveLabelShift, close),
so it appears shifted to the right by N bars.
• Text includes:
– Target price
– Distance in price and ticks
– Progress %
– Direction text “↑ need up” or “↓ need down”.
(6) Alerts
• alertcondition(fillNow, ...) triggers when the previous High/Low
is touched according to the rules above.
• You can connect this to TradingView alerts to be notified when
the gap retrace happens.
(7) Auto-reset (when nextBarOnly = true)
• After the “next bar” closes, if the target is still armed,
the script clears:
– lastTarget
– baseDist
so that a new signal can be armed on future bars.
────────────────────────────────
3) Inputs summary
────────────────────────────────
• Tweezer tolerance (ticks)
– How close highs or lows can be to be considered a tweezer (skip signal).
• Target selection
– "Midline": choose High or Low based on whether close is above/below midpoint.
– "Nearest": choose whichever of prev High/Low is closer to the close.
• Only allow fill on the following bar
– If true: only the very next bar can fill the target.
– If false: any later bar can fill it.
• Show target line
– Draw/Hide the H/L target line.
• Show signal/fill markers
– Draw/Hide the small circle marker on fill.
• Show live distance label
– Turn the floating label ON/OFF.
• Live label → shift right (bars)
– Horizontal shift in bars for the live label (default 3 bars to the right).
────────────────────────────────
4) How to use it (educational view)
────────────────────────────────
XAUMO Gap Retrace is a study tool for:
• Testing how often a candle “comes back” to revisit the previous bar’s High/Low.
• Studying behaviour of retracements after a non-tweezer move.
• Combining gap-retrace logic with your own system:
– support/resistance
– VWAP / FVRP
– volume / delta
It is NOT meant to be traded blindly. It’s a microscope for one specific
price pattern: “does the next bar retrace to the previous bar’s H/L?”
────────────────────────────────
5) Risk & scam awareness
────────────────────────────────
• No script can guarantee profit or remove risk.
• Past retrace behaviour does not guarantee future behaviour.
• Never send money or account credentials to anyone claiming they can
use this indicator to give “fixed income” or “guaranteed returns”.
• Always test ideas, manage your own risk, and trade only money you
can afford to lose.
================================================
XAUMO Gap Retrace
وصف تعليمي بالعربي لمكتبة TradingView
📘 الاسكريبت تعليمي فقط — مش توصية شراء أو بيع
الهدف إنك تذاكر سلوك السعر وتعمل باك-تست، مش إنك تاخد منه أرباح مضمونة.
ممنوع استخدامه في أي دعاية نصب أو وعود كاذبة.
────────────────────────────────
١) الاسكريبت ده بيعمل إيه؟
────────────────────────────────
XAUMO Gap Retrace بيراقب سلوك معيّن:
• بعد ما الشمعة تقفل (وبتكون مش تويزر مع الشمعة اللي قبلها)
الاسكريبت “يسلّح” Target عند هاي أو لو الشمعة السابقة.
• بعد كده يبص: هل الشمعة اللي بعدها (أو اللي بعدهم لو حابب)
رجعت لمست الهاي/اللو بتوع الشمعة اللي فاتت ولا لأ؟
• لو اتلمس الهاي/اللو:
– بيحط علامة “fill”
– يحدّث ليبل حيّ بمسافة السعر والتقدّم
– ممكن يضرب Alert لو أنت فعّلتها.
يعني بالعربي:
“كل شمعة تقفل بعيد شوية عن اللي قبلها، بنحطلها مغناطيس
عند هاي أو لو الشمعة اللي قبلها، وبنشوف هل الشمعة الجاية
هترجع تلمسه ولا لأ.”
────────────────────────────────
٢) المنطق الداخلي خطوة بخطوة
────────────────────────────────
(أ) كشف الـ Tweezer
• بيحسب:
– prevH = هاي الشمعة اللي قبل
– prevL = لو الشمعة اللي قبل
– tol = toleranceTicks × حجم التكة
• لو الهاي أو اللو الحالي قريب من الهاي/اللو اللي قبل
بمقدار tol → تعتبر Tweezer:
isTweezer = true
• في الحالة دي بنعدّي ومابنسلّحش Target عشان نتفادى النويز.
(ب) اختيار الهدف (Midline أو Nearest)
لو الشمعة اتأكدت (barstate.isconfirmed) ومش تويزر:
• لو Mode = "Midline":
– prevMid = (prevH + prevL) / 2
– لو close ≥ prevMid → الهدف = prevH (هاي السابق)
– غير كده → الهدف = prevL (لو السابق)
• لو Mode = "Nearest":
– الهدف = الأقرب للـ close بين prevH و prevL.
وبعدين يخزن:
• lastTarget = مستوى السعر اللي مستنّين اللمسة عنده.
• lastSigIndex = bar_index للشمعة اللي سلّحت الإشارة.
• needUp = true لو التارجت فوق الكلوز (السعر محتاج يطلع).
false لو التارجت تحت الكلوز (السعر محتاج ينزل).
• baseDist = المسافة الأصلية |close - target| عند شمعة الإشارة.
(ج) حالة التسلّح والFill
• isArmed = في Target شغّال؟
• isNextBar = إحنا في الشمعة اللي بعد الإشارة مباشرة؟
• isActive =
– لو nextBarOnly = true → بس الشمعة اللي بعد الإشارة مسموح تملأ.
– لو false → أي شمعة بعد الإشارة مسموح.
شرط اللمس:
• لو needUp = true → fill لما high ≥ lastTarget.
• لو needUp = false → fill لما low ≤ lastTarget.
ده بيطلع:
• fillNow = true على الشمعة اللي لمست فيها الهاي/اللو بتاع الشمعة السابقة.
(د) خط الهدف وعلامة الـ Fill
• plot() يرسم خط عند lastTarget طول ما الإشارة متسلّحة.
• plotshape() يرسم دايرة صغيرة مكتوب عليها “fill” وقت ما الشرط يتحقق.
(هـ) ليبل المسافة والتقدّم (لايف)
ليبل واحد حيّ liveLbl يوضح إيه اللي بيحصل حاليًا:
• dist = |close - lastTarget|
• distTicks = dist ÷ حجم التكة
• progress = التقدم من ٠٪ لحد ١٠٠٪ من المسافة الأصلية:
– ٠٪ = لسه ما اتحركناش ناحية الهدف
– ١٠٠٪ = تم ملء الهدف
(محسوبة بـ clamp عشان نفضل بين ٠ و١).
لو showLabel شغّال وعلى آخر شمعة:
• يمسح الليبل القديم (لو موجود)
• يرسم ليبل جديد عند:
bar_index + liveLabelShift, close
يعني مزحزح الليبل كذا شمعة قدام على الشارت.
• النص بيعرض:
– Target
– Dist + Dist in ticks
– Progress٪
– سهم واتجاه: "↑ need up" أو "↓ need down".
(و) التنبيهات (Alerts)
• alertcondition(fillNow, ...) بتضرب لما الهدف (هاي/لو الشمعة السابقة)
يتلمس حسب القاعدة.
• تقدر توصلها بألارم على TradingView عشان يجيلك نوتيفيكيشن أول ما
يحصل Retrace.
(ز) إعادة ضبط أوتوماتيكي (لما nextBarOnly = true)
• بعد قفل الشمعة اللي بعد الإشارة، لو لسه فيه Target متسلّح:
– lastTarget = na
– baseDist = na
عشان يبقى جاهز يسلّح إشارة جديدة بعد كده.
────────────────────────────────
٣) أهم الإعدادات (Inputs)
────────────────────────────────
• Tweezer tolerance (ticks)
– مساحة التسامح في الهاي/اللو عشان نعتبرها تويزر ونسيبها.
• Target selection
– "Midline": يختار الهاي أو اللو حسب مكان الكلوز من منتصف الشمعة.
– "Nearest": يختار الأقرب للكلوز.
• Only allow fill on the following bar
– لو true: بس الشمعة اللي بعدها اللي تقول “اتملّى ولا لأ”.
– لو false: أي شمعة بعد كده ممكن تملّي الهدف.
• Show target line
– إظهار/إخفاء خط الهدف.
• Show signal/fill markers
– إظهار/إخفاء دائرة الـ fill.
• Show live distance label
– تشغيل/إيقاف الليبل اللايف.
• Live label → shift right (bars)
– تزحزح الليبل كام شمعة قدام (افتراضي ٣).
────────────────────────────────
٤) الاستخدام التعليمي
────────────────────────────────
مفيد لو عايز:
• تدرس: كام مرة الشمعة اللي بعد كده بترجع تلمس هاي/لو الشمعة اللي قبلها؟
• تشوف سلوك Retrace بعد حركة مش تويزر.
• تضيف المنطق ده لاستراتيجيتك:
– زونز، VWAP، FVRP، فوليوم، دلتا… إلخ.
مش معمول إنك تشتري/تبيع لوحده بمجرد ظهور إشارة.
────────────────────────────────
٥) مخاطر واحتيال
────────────────────────────────
• مفيش سكريبت بيشيل عنك المخاطرة.
• اللي حصل في الماضي مش ضمان للي جاي.
• إوعى حد يقول لك “ب XAUMO Gap Retrace هديك ربح ثابت”.
• ادير ريسكك بنفسك، جرّب الأول على ديمو، واتاجر بس بفلوس
تقدر تتحمل خسارتها.
================================================================
XAUMO Gap Retrace — Business Case (English)
Scenario: Post-selloff balance inside Implosion Box
📘 EDUCATIONAL ONLY — NOT FINANCIAL ADVICE
For TradingView idea / script description. Not a signal, not a promise of profit.
────────────────────────────────
1) What do we see on the chart?
────────────────────────────────
• Symbol: XAUUSD (gold CFD)
• TF: intraday (15m in the screenshot)
• XAUMO Implosion Box is active:
– Box High ≈ 4084.6
– Box Low ≈ 4065.5
Price is moving sideways inside this purple “implosion” range
after a strong Mega Bear waterfall.
• XAUMO Gap Retrace has armed a target at:
– Prev H/L Target ≈ 4077.12
– Live label says:
Target: 4077.12
Dist: 0.84 (64 ticks)
Progress: 71%
↓ need down
This means:
• The last “signal bar” closed ABOVE the chosen previous High/Low.
• The script selected 4077.12 as the magnet (previous H or L).
• Current price is still ABOVE that level, so we “need down”
for a full retrace.
• 71% of the original distance has already been eaten — most of
the gap has been retraced, a small part remains.
────────────────────────────────
2) What is the business case here?
────────────────────────────────
Context:
• We had aggressive selling (multiple Mega Bear tags) pushing price
from the upper green zone into the Implosion box.
• After the dump, price is no longer trending: it is compressing
between Box High and Box Low (implosion phase).
• Inside this box, XAUMO Gap Retrace is tracking small dislocations
between a bar’s close and the previous bar’s High/Low.
Current business case:
• The system is telling us:
“The last impulse away from the previous bar left a void at 4077.12.
The market has already retraced ~71% of that distance, but a
small downward move is still needed to fully ‘close the loop’.”
Educational interpretation:
• As long as price stays inside the Implosion Box, these small
retraces behave like micro mean-reversion trades: the market likes
to test old highs/lows inside the range before deciding whether to
break out (Explosion) or fully revert to the opposite side.
So the business case is:
> We are in a post-liquidation balance (Implosion box).
> XAUMO Gap Retrace shows an unfinished downside retrace to 4077.12.
> This supports a short-term mean-reversion idea INSIDE the box,
> not a blind breakout chase.
You still need:
• Your own trigger (price action / volume / order flow).
• Your own risk plan (SL, size, invalidation if Box High/Low breaks).
────────────────────────────────
3) Risk & scam awareness
────────────────────────────────
• XAUMO Gap Retrace does NOT guarantee that 4077.12 will be filled.
• Implosion boxes sometimes break violently without completing every
tiny retrace.
• Never sell this idea as “guaranteed fill” or “risk-free setup”.
• Always test, size properly, and trade only what you can afford to lose.
SHOW ME THE MONEY ya XAUMO…
but with discipline, risk limits, and zero tolerance for scams.
=========================================================
XAUMO Gap Retrace — الحالة دي بتقول إيه؟ (عربي)
📘 تنبيه مهم:
الشرح ده تعليمي بس، مش توصية شراء أو بيع، ومش وعد بأي ربح.
ممنوع استخدامه في دعاية نصب أو “أرباح مضمونة”.
────────────────────────────────
١) إيه اللي باين على الشارت؟
────────────────────────────────
• الأداة: XAUUSD
• الفريم: إنترادي (١٥ دقايق في الصورة)
• صندوق XAUMO Implosion شغّال:
– Box High حوالي 4084.6
– Box Low حوالي 4065.5
السعر بيتحرّك رايح جاي جوّه البوكس البنفسجي بعد نازلة
جامدة (Mega Bear) من المنطقة الخضرا فوق.
• XAUMO Gap Retrace مسلّح هدف عند:
– Prev H/L Target ≈ 4077.12
– الليبل كاتب:
Target: 4077.12
Dist: 0.84 (64 ticks)
Progress: 71%
↓ need down
يعني:
• شمعة الإشارة قفلت فوق الهاي/اللو اللي الاسكريبت اختاره.
• التارجت 4077.12 هو هاي أو لو الشمعة اللي قبلها.
• السعر دلوقتي لسه فوق التارجت، فـ “محتاج ينزل” عشان يكمّل الـ Retrace.
• ٧١٪ من المسافة الأصلية اتحركت بالفعل، فاضل جزء صغير من الجاب.
────────────────────────────────
٢) الـ Business Case هنا إيه؟
────────────────────────────────
الخلفية:
• كان فيه بيع عنيف من فوق (Mega Bear) نزّل السعر لحد جوّه
صندوق الـ Implosion.
• بعد النزلة، السوق دخل في حالة توازن/كومبريشن بين Box High و Box Low.
• جوّه البوكس، XAUMO Gap Retrace بيتابع كل مرة الشمعة تقفل
بعيد عن هاي/لو الشمعة اللي قبلها وبيشوف: هل الشمعة الجاية
هترجع تلمس المستوى ده ولا لأ.
في اللحظة دي:
• السيستم بيقول لك:
“فيه حركة طالعة فوق سببت فجوة صغيرة لحد 4077.12.
أغلب المسافة اتردّت (حوالي ٧١٪)، لسه ناقص نزلة بسيطة
عشان نقفل الدورة على الآخر.”
القراءة التعليمية:
• طول ما السعر جوّه صندوق الـ Implosion، الحركات دي غالبًا
Mean-Reversion جوّه الرينج: السوق يحب يختبر الهاي/اللوهات
القديمة جوّه البوكس قبل ما يقرر:
– يكسر لفوق (Explosion Up)
– أو يكمل نزلة لتحت.
فالـ Business Case:
> إحنا في توازن بعد نزلة قوية (Implosion Box).
> XAUMO Gap Retrace بيقول لسه فيه Retrace ناقص لتحت لحد 4077.12.
> الفكرة أقرب لتريدات رينج/Mean-Reversion جوّه البوكس،
> مش مطاردة بريك أوت عشوائي.
بس لسه محتاج:
• تأكيد دخول من طريقتك (برايس أكشن / فوليوم / فلو).
• خطة ريسك واضحة (ستوب، حجم عقد، إلغاء الفكرة لو Box High/Low اتكسر).
────────────────────────────────
٣) مخاطر واحتيال
────────────────────────────────
• مفيش ضمان إن السعر لازم يلمس 4077.12.
• ساعات صندوق الـ Implosion بيتكسّر بعنف من غير ما كل Retrace
صغير يكتمل.
• إوعى حد يقول لك “كل هدف Gap Retrace بيتملّي ١٠٠٪” — ده نصب.
• دايمًا جرّب، اتحكّم في حجمك، واتاجر بس بفلوس تقدر تستحمل خسارتها.
SHOW ME THE MONEY يا XAUMO…
بس بالعقل، وبريسـك مانجمنت، ومن غير ولا وعد كدب.

Metallic Retracement LevelsThere's something that's always bothered me about how traders use Fibonacci retracements. Everyone treats the golden ratio like it's the only game in town, but mathematically speaking, it's completely arbitrary. The golden ratio is just the first member of an infinite family of metallic means, and there's no particular reason why 1.618 should be special for markets when we have the silver ratio at 2.414, the bronze ratio at 3.303, and literally every other metallic mean extending to infinity. We just picked one and decided it was magical.
The metallic means are a sequence of mathematical constants that generalize the golden ratio. They're defined by the equation x² = kx + 1, where k is any positive integer. When k equals 1, you get the golden ratio. When k equals 2, you get the silver ratio. When k equals 3, you get bronze, and so on forever. Each metallic mean generates its own set of ratios through successive powers, just like how the golden ratio gives you 0.618, 0.382, 0.236 and so forth. The silver ratio produces a completely different set of retracement levels, as does bronze, as does any arbitrary metallic number you want to choose.
This indicator calculates these metallic means using the standard alpha and beta formulas. For any metallic number k, alpha equals (k + sqrt(k² + 4)) / 2, and we generate retracement ratios by raising alpha to various negative powers. The script algorithmically generates these levels instead of hardcoding them, which is how it should have been done from the start. It's genuinely silly that most fib tools just hardcode the ratios when the math to generate them is straightforward. Even worse, traditional fib retracements use 0.5 as a level, which isn't even a fibonacci ratio. It's just thrown in there because it seems like it should be important.
The indicator works by first detecting swing points using the Sylvain Zig-Zag . The zig-zag identifies significant price swings by combining percentage change with ATR adjustments, filtering out noise and connecting major pivot points. This is what drives the retracement levels. Once a new swing is confirmed, the script calculates the range between the last two pivot points and generates metallic retracement levels from the most recent swing low or high.
You can adjust which metallic number to use (golden, silver, bronze, or any positive integer), control how many power ratios to display above and below the 1.0 level, and set how many complete retracement cycles you want drawn. The levels extend from the swing point and show you where price might react based on whichever metallic mean you've selected. The zig-zag settings let you tune the sensitivity of swing detection through ATR period, ATR multiplier, percentage reversal, and additional absolute or tick-based reversal values.
What this really demonstrates is that retracement analysis is more flexible than most traders realize. There's no mathematical law that says markets must respect the golden ratio over any other metallic mean. They're all valid mathematical constructs with the same kind of recursive properties. By making this tool, I wanted to highlight that using fibonacci retracements involves an arbitrary choice, and maybe that choice should be more deliberate or at least tested against alternatives. You can experiment with different metallic numbers and see which ones seem to work better for your particular market or timeframe, or just use this to understand that the standard fib levels everyone uses aren't as fundamental as they appear.

Auto Hourly Deviations {Module+}Description
This indicator automatically calculates and visualizes the prior hour’s price structure and its deviation levels. By combining core reference lines (high, low, EQ, quarters, open) with dynamic deviation levels and shaded zones, it provides a framework for understanding intraday price behavior relative to the most recent hourly range.
The tool has three functional sections that work together:
Core Hourly Structure – Captures the prior hour’s high, low, EQ (50%), and quarter levels (25% and 75%), plus the current open.
Deviation Levels – Projects standardized deviation multiples (±0.33, ±0.5, ±0.66, ±1.0, ±1.33, ±1.66, ±2.0) above and below the prior hour’s range.
Shading & Anchoring – Fills zones between key deviation levels for visual emphasis, while allowing projection offsets and anchor line references for precise chart alignment.
Together, these layers give traders a structured map of price movement around hourly ranges, making it easier to track expansion, retracement, and trend continuation.
1. Core Hourly Structure
Plots the prior hour’s high and low as key reference points.
Automatically calculates EQ (midpoint), 25%, and 75% levels.
Tracks the open of the current hour for immediate orientation.
Optional anchor line marks the start of each hourly window for time alignment.
Use: Frames the “hourly box” and subdivides it for intraday structure analysis.
2. Deviation Levels
Uses the prior hour’s range as a baseline.
Projects deviation levels above and below: ±0.33, ±0.5, ±0.66, ±1.0, ±1.33, ±1.66, and ±2.0.
Each level can be individually toggled with full line/label styling.
Use: Quantifies how far price is moving relative to the last hour’s volatility — useful for spotting overextensions, retraces, and probable reaction zones.
3. Shading & Anchoring
Shaded zones between selected deviation bands (e.g., +0.33 to +0.66 or +1.33 to +1.66) highlight potential liquidity or reaction areas.
Projection offsets allow levels to extend forward into future bars for planning.
Labels and color controls make the chart highly customizable.
Use: Provides quick visual cues for potential trading ranges and deviations without clutter.
Intended Use
This is a visualization tool, not a buy/sell system. Traders can use it to:
Track how price interacts with the prior hour’s high/low.
Measure hourly expansion through deviation levels.
Spot retracements or continuation zones inside and beyond the prior hour’s range.
Limitations & Disclaimers
Levels are derived from completed hourly candles; they do not predict outcomes.
Deviations are static calculations and do not account for fundamentals or volatility shifts.
This indicator does not provide financial advice or trading signals.
For informational and educational purposes only.
Trading involves risk; always apply proper risk management.
Closed-source (Protected): Logic is accessible on charts, but the source code is hidden. A TradingView paid plan is required for protected indicators.

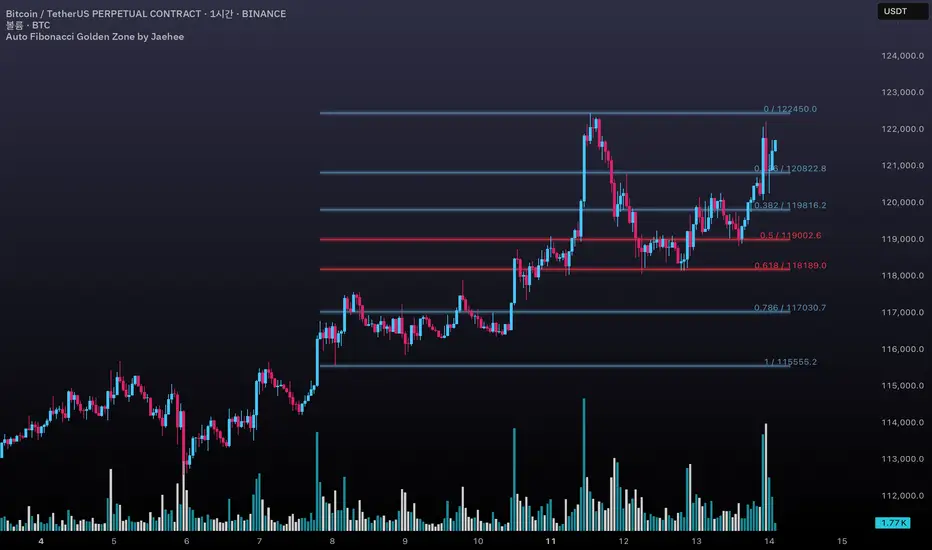
Auto Fibonacci Golden Zone by Jaehee📌 AUTO FIBONACCI GOLDEN ZONE — Auto Swing Detection with Key Level Highlights
WHAT THIS DOES
• Automatically detects the latest swing high and swing low within your chosen lookback range.
• Plots Fibonacci retracement levels: 1.000, 0.786, 0.618, 0.500, 0.382, 0.236, 0.000.
• Highlights 0.618 (“golden pocket”) and 0.500 as high-interest zones.
• Displays ratio + price labels to the right for quick reference without moving the cursor.
HOW IT WORKS
• Scans the last N bars (default 150) to locate the highest high and lowest low.
• Determines swing direction automatically: if the low forms first → up-leg, if the high forms first → down-leg.
• Calculates retracement prices and plots each level with a thin core line plus two glow layers (opacity adjustable).
• Clears and redraws lines and labels whenever a new swing is found — keeping the chart clean.
WHY THIS SETUP
• Saves time compared to manually anchoring Fib tools for each new swing.
• Highlights the golden pocket (0.618) and midpoint (0.500) — zones many traders watch for pullbacks or reactions.
• Positions labels to the right so they never overlap active candles.
HOW IT’S DIFFERENT FROM THE STANDARD FIB TOOL
• Automatic swing detection — no manual point selection.
• Built-in highlight logic for key levels.
• Clean redraw to prevent leftover lines or labels.
• Right-side label offset for readability in volatile price zones.
HOW TO READ IT (CONTEXT ONLY)
• In an up-leg, the 0.382–0.618 zone is often monitored for pullback reactions; 0.500 can act as a midpoint marker.
• In a down-leg, retracements into the 0.382–0.618 zone can be watched for selling pressure.
• Always confirm with structure, volume, and momentum tools — this indicator is not a standalone trade signal.
INPUTS
• Lookback Bars — swing detection range.
• Fib Line Color / Highlight Line Color — control standard vs. key level colors.
• Label Offset Bars — shift labels away from current price.
• Glow 1 & Glow 2 Opacity — adjust background glow visibility.
DESIGN NOTES
• Thin lines for precision, glow layers for visibility without overpowering candles.
• Overlay display — no extra panel needed.
• All elements clear and redraw automatically to avoid clutter.
LIMITATIONS & BEST PRACTICES
• Levels update whenever a new swing forms within the lookback range — historical lines are not fixed.
• Fib retracements are reference zones only, not guarantees of reversal.
• Best used with confluence factors like S/R flips, market structure, and volume analysis.
• No alerts, no performance claims — purely a market context tool.
DEFAULTS & SCOPE
• Works on all OHLCV instruments and timeframes.
• No repainting after swing confirmation.
AUTHOR’S NOTE FOR REVIEW
This is not a repackaged Fib tool. It combines automatic swing detection, golden pocket highlighting, and a clean redraw process to make retracement analysis faster and clearer. It provides context only, with no predictive or performance claims.
Smart Directional Fib Zone (Selectable Session)🎯 Overview
This indicator plots a dynamic Fibonacci zone between the 0.5 and 0.618 levels , calculated from the previous day’s price action , and is designed specifically for intraday traders.
It visually highlights key retracement or reaction areas where the market often pauses or reverses.
🔍 How it works
At the start of each day, the script automatically captures:
the previous day’s open (pdo),
high (pdh),
low (pdl),
and close (pdc).
It then determines if the previous day was bullish (Close > Open) or bearish (Close < Open).
Based on that:
If the previous day was bullish, it projects the Fibonacci levels down from the high (typical for expecting retracements).
If bearish, it projects them up from the low.
The two key levels are:
0.5 (50%) retracement / projection
0.618 (61.8%) retracement / projection
A colored zone is plotted between these levels to act as a leading guide for intraday setups.
⏰ Time filtering & session customization
A unique feature is the dynamic session filtering:
By default, the zone is only plotted during active market hours, keeping your chart clean outside trading hours.
The script provides a dropdown selector so you can quickly switch between:
India session (9:15 to 15:30)
Europe session (9:00 to 17:30)
US session (9:30 to 16:00)
Or even define your own custom session times.
This makes it ideal for intraday traders in any region.
🎨 Visual features
The fill zone changes color based on the previous day’s sentiment:
Green zone if the previous day was bullish
Red zone if the previous day was bearish
🚨 Alerts
The script includes an alert condition, so you can easily set up TradingView alerts to notify you when:
Price enters the Fibonacci zone.
This is extremely helpful for catching retracements or reversals without staring at the screen all day.
⚙️ How to use
✅ Works on any intraday timeframe (1 min, 5 min, 15 min, etc.).
✅ Simply add it to your chart, pick your session in the dropdown, and watch the Fibonacci zone automatically adjust to your selected market hours.
Use it as a confluence tool alongside other indicators like VWAP, EMAs, Bollinger Bands, or price action patterns to time entries and exits.
💪 Why this is powerful
This is more than a simple Fib retracement tool:
It dynamically adapts to the previous day’s sentiment, helping you trade in alignment with recent market psychology.
The session filtering ensures your charts are focused only on the periods

IDKFAIDKFA - Advanced Order Blocks & Volume Profile with Market Structure Analysis
Why IDKFA?
Named after the legendary DOOM cheat code that gives players "all weapons and full ammo," IDKFA provides traders with a comprehensive arsenal of market analysis tools. Just as the cheat code arms players with everything needed for combat, this indicator equips traders with essential market structure tools: Order Blocks, Volume Profile, LVN/HVN areas, Fibonacci retracements, and intelligent buy/sell signals - all in one unified system.
Core Features
Order Blocks Detection
Automatically identifies institutional order blocks using pivot high/low analysis
Extends blocks dynamically until price interaction occurs
Bullish blocks (demand zones) and bearish blocks (supply zones)
Customizable opacity and extend functionality
Advanced Volume Profile
Real-time volume profile calculation for multiple session types
Point of Control (POC), Value Area High (VAH), and Value Area Low (VAL)
Mode 1: Side-by-side bull/bear volume display
Mode 2: Overlapped volume display with percentage analysis
Shows buying vs selling pressure at each price level
LVN/HVN Area Detection
Low Volume Nodes (LVN): Areas below VAL where price moves quickly
High Volume Nodes (HVN): Areas above VAH with strong resistance
NPOC (Naked Point of Control): Single print areas within Value Area
Volume-based gradient coloring shows relative activity levels
Smart Fibonacci Retracements
Auto-detects trend direction for proper fibonacci orientation
Dynamic color coding: Red levels in uptrends, Gold in downtrends
Special 88.6% level turns lime green in downtrends
Key levels: 23.6%, 38.2%, 50%, 61.8%, 65%, 78.6%, 88.6%
Intelligent Signal System
Works best on higher timeframes
Identifies high-probability reversal setups at key levels
Buy signals: Large bearish rejection followed by bullish reclaim
Sell signals: Large bullish rejection followed by bearish breakdown
Signals only trigger near significant support/resistance areas
Signal Analysis & Usage Guidelines
Buy Signal Mechanics
The buy signal triggers when:
Previous candle shows significant bearish movement (minimum ATR multiplier)
Current candle reclaims a configurable percentage of the previous candle's range
Price is near a key support level (order blocks, fibonacci, volume levels)
Sell Signal Mechanics
The sell signal triggers when:
Previous candle shows significant bullish movement (minimum ATR multiplier)
Current candle rejects below a configurable percentage of the previous candle's range
Price is near a key resistance level (order blocks, fibonacci, volume levels)
When to TAKE Signals
High Probability Buy Signals:
Signal appears AT or BELOW the VAL (Value Area Low)
Signal occurs at bullish order block confluence
Price is in LVN area below VAL (momentum acceleration zone)
Signal aligns with fibonacci 61.8% or 78.6% support
Multiple session POC levels provide support confluence
Previous session's VAL acting as current support
High Probability Sell Signals:
Signal appears AT or ABOVE the VAH (Value Area High)
Signal occurs at bearish order block confluence
Price is in HVN area above VAH (heavy resistance zone)
Signal aligns with fibonacci 61.8% or 78.6% resistance
Multiple session POC levels provide resistance confluence
Previous session's VAH acting as current resistance
When to AVOID Signals
Avoid Buy Signals When:
Signal appears ABOVE the VAH (buying into resistance)
Price is in HVN red zones (high volume resistance areas)
No clear support structure below current price
Volume profile shows heavy selling pressure (high bear percentages)
Signal occurs during low-volume periods between major sessions
Multiple bearish order blocks exist below current price
Avoid Sell Signals When:
Signal appears BELOW the VAL (selling into support)
Price is in LVN green zones (momentum could continue)
No clear resistance structure above current price
Volume profile shows heavy buying pressure (high bull percentages)
Signal occurs during Asian session ranges without clear direction
Multiple bullish order blocks exist above current price
Volume Profile Context for Signals
Understanding Bull/Bear Percentages:
70%+ Bull dominance at a level = Strong support expected
70%+ Bear dominance at a level = Strong resistance expected
50/50 Split = Neutral zone, less predictable
Use percentages to gauge conviction behind moves
POC (Point of Control) Interactions:
Signals above POC in uptrend = Higher probability
Signals below POC in downtrend = Higher probability
Signals against POC bias require extra confirmation
POC often acts as magnetic level for price return
Trading Strategies
Strategy 1: VAL/VAH Bounce Strategy
Wait for price to approach VAL (support) or VAH (resistance)
Look for signal confirmation at these critical levels
Enter with tight stops beyond the Value Area
Target opposite boundary or next session's levels
Strategy 2: Order Block + Volume Confluence
Identify order block alignment with VAL/VAH
Wait for signal within the confluence zone
Enter on signal with stop beyond order block
Use LVN areas as acceleration zones for targets
Strategy 3: LVN/HVN Strategy
LVN (Green) Areas: "Go Zones" - expect quick price movement through low volume
HVN (Red) Areas: "Stop Zones" - expect resistance and potential reversals
NPOC Areas: "Fill Zones" - price often returns to fill single print gaps
Strategy 4: Multi-Session Analysis
Use Daily/Weekly for major structure context
Use 4H for intermediate levels
Use 1H for precise entry timing
Ensure all timeframes align before taking signals
Strategy 5: Fibonacci + Volume Profile
Buy signals at 61.8% or 78.6% fibonacci near VAL
Sell signals at 61.8% or 78.6% fibonacci near VAH
Use 88.6% level as final support/resistance before major moves
50% level often aligns with POC for confluence
Signal Quality Assessment
Grade A Signals (Highest Probability):
Signal at VAL/VAH with order block confluence
Fibonacci level alignment (61.8%, 78.6%)
Volume profile shows 70%+ dominance in signal direction
Multiple timeframe structure alignment
Signal occurs during high-volume sessions (London/NY)
Grade B Signals (Moderate Probability):
Signal near POC with some confluence
Fibonacci 50% or 38.2% alignment
Mixed volume profile readings (50-70% dominance)
Some timeframe alignment present
Signal during overlap sessions
Grade C Signals (Lower Probability):
Signal with minimal confluence
Weak fibonacci alignment or none
Volume profile neutral or against signal
Conflicting timeframe signals
Signal during low-volume periods
Risk Management Guidelines
Position Sizing Based on Signal Quality:
Grade A: Standard position size
Grade B: Reduced position size (50-75%)
Grade C: Minimal position size (25%) or skip entirely
Stop Loss Placement:
Beyond order block boundaries
Outside Value Area (VAL/VAH)
Below/above fibonacci confluence levels
Account for session volatility ranges
Profit Targets:
First target: Opposite VAL/VAH boundary
Second target: Next session's key levels
Final target: Major order blocks or fibonacci extensions
Credits & Attribution
Original components derived from:
Market Sessions & Volume Profile by © Leviathan (Mozilla Public License 2.0)
Volume Profile elements inspired by @LonesomeTheBlue's volume profile script
Pivot Order Blocks by TradingWolf / © MensaTrader (Mozilla Public License 2.0)
Auto Fibonacci Retracement code (public domain)
Significant enhancements and modifications include:
Advanced LVN/HVN detection and visualization
Bull/Bear percentage analysis for Mode 2/3
Comprehensive alert system with market context
Integrated buy/sell signals at key levels
Performance optimizations and extended session support
Enhanced Mode 2/3 with percentage pressure analysis
Important Disclaimers
This indicator is a technical analysis tool designed for educational purposes. It does not provide financial advice, investment recommendations, or trading signals that guarantee profits. All trading involves substantial risk of loss, and past performance does not guarantee future results. Users should conduct their own research, understand the risks involved, and consider consulting with qualified financial advisors before making trading decisions. The signals and analysis provided are based on historical price patterns and volume data, which may not predict future market movements accurately.
Best Practices
Never trade signals blindly - always consider volume profile context
Wait for confluence between multiple tools before entering
Respect the Value Area - avoid buying above VAH or selling below VAL
Use session context - Asian ranges vs London/NY breakouts
Practice proper risk management - position size based on signal quality
Understand the bigger picture - use multiple timeframes for context
Remember: Like the IDKFA cheat code, having all the tools doesn't guarantee success. The key is learning to use them together effectively and understanding when NOT to take a signal is often more important than knowing when to take one.

Price Range Retrace statisticks [HERMAN]📈 Price Range Retrace Stats
This indicator is designed to help traders quantify how often price retraces to a selected equilibrium level (e.g., 50%) after sweeping the high/low of a defined time-based range.
It is especially useful for modeling sessions such as the London Opening Range (e.g., 02:00–03:00 NY time), checking if price sweeps that range in a subsequent window (e.g., 03:00–04:00), and returns to its 50% level.
✅ What does it do?
Lets you define multiple time ranges (e.g. London, NY Open, custom ranges).
Draws the range box for the selected session time.
Calculates and plots the retracement level (default 50%).
Checks if price sweeps the high/low of the range before retracing.
Tracks success rate, average distance, sample size and displays these stats in a table.
⚙️ Key Features:
Fully customizable time windows (range box time and retracement check time).
-Configurable retracement % (default 50% equilibrium).
-Optional sweep condition (only count retracements if price sweeps the high/low first).
-Clean, theme-adaptive stats table with success rates and averages.
-Supports two independent levels (e.g. London and NY sessions).
📊 Why use it?
This tool turns session-based setups into statistical models:
Backtest session strategies over many days.
Quantify edge with % success over time.
Validate trading ideas with data.
Use probabilities instead of gut feeling.
Example insight you can track:
“Between 3–4 AM NY time, price swept the high/low of the 2–3 AM London Opening Range and returned to its 50% equilibrium level in 64% of 234 sessions.”
📌 Ideal for:
ICT concepts (Opening Range, Sweep, Equilibrium Return).
Algo developers wanting probabilities.
Anyone who wants data-driven confirmation for session range mean-reversion.
Instructions:
1️⃣ Enable the desired Price Range (1 or 2).
2️⃣ Set your Range Time (e.g. 02:00–03:00).
3️⃣ Set your Retracement Check Time (e.g. 03:00–04:00).
4️⃣ Choose retracement % (e.g. 50%).
5️⃣ Watch the box and retrace line plot on chart.
6️⃣ Review the success statistics in the table.

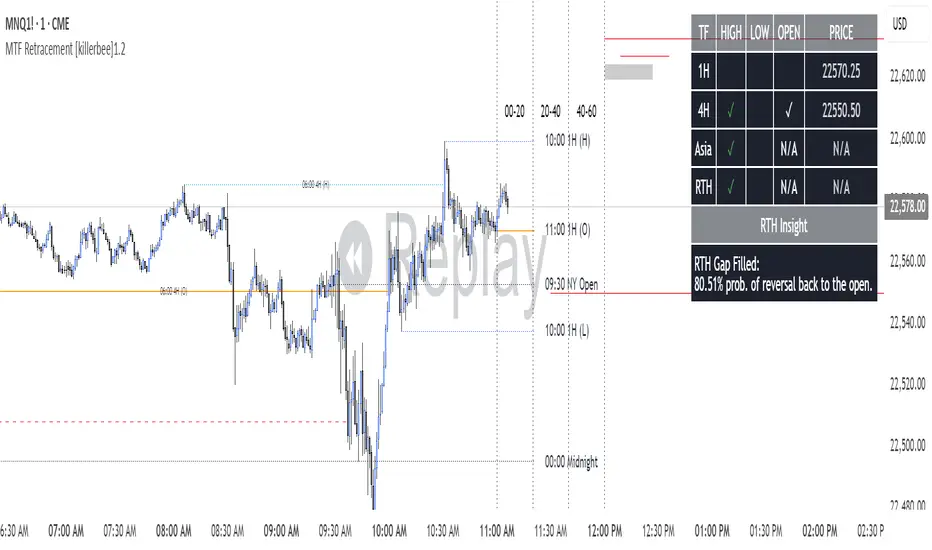
[killerbee] MTF RetracementKey Features
Multi-Timeframe (MTF) Analysis: Plot the high, low, and open from up to four user-defined higher timeframes. This allows you to see the bigger picture and identify key levels that institutional traders are watching.
Dynamic Support & Resistance: Lines are drawn at these key MTF levels and extend until price breaks through them, providing a clean and dynamic view of support and resistance.
Session Highlighting: Automatically draw boxes and high/low lines for the Asia, London, and RTH (Regular Trading Hours) sessions. This helps you understand the context of price action throughout the trading day.
Customizable Opening Price Lines: Pinpoint significant opening prices with dedicated lines for events like the "Midnight Open," "8:30 Open," and "9:30 Open."
"NQ STATS TABLE": A powerful statistical table that provides real-time insights:
Break/Hit Confirmation: Instantly see when a key MTF high/low has been broken or when an opening price has been retraced to.
9 AM Directional Bias: A bullish or bearish bias based on the close of the 9 AM (New York time) hourly candle.
Historical Probabilities: The table displays historical probabilities for price to either break a previous high/low or retrace to the open, based on the current hour of the trading session.
Extensive Customization: Nearly every visual aspect of the indicator can be customized to your preference, including colors, line styles, visibility of each component, and the position of the stats table.
How to Use
Identify Key Levels: The lines from the higher timeframes (HTF1, HTF2, etc.) represent significant support and resistance. Pay close attention to these levels as price approaches them.
Look for Breaks and Retracements:
When a high or low line is broken, the line will stop extending. This can signal a shift in market structure and a potential continuation in the direction of the break.
The "Open Line" for each timeframe represents the opening price. When the line stops extending, it means price has retraced back to that open, a common occurrence in the market.
Utilize the Sessions:
The Asia, London, and RTH boxes help you frame your trading day. The highs and lows of these sessions are often critical levels of support and resistance.
Breakouts from these session ranges can lead to strong directional moves.
Leverage the STATS TABLE:
Use the "Break" and "Hit" columns to quickly confirm when key levels have been breached or revisited.
The "Direction" row gives you a quick sentiment reading based on the 9 AM candle.
The "Trades Back %" and "High/Low Forms" provide a statistical edge by showing you the historical likelihood of certain price behaviors based on the time of day. This can help you decide whether to play for a breakout or a retracement.
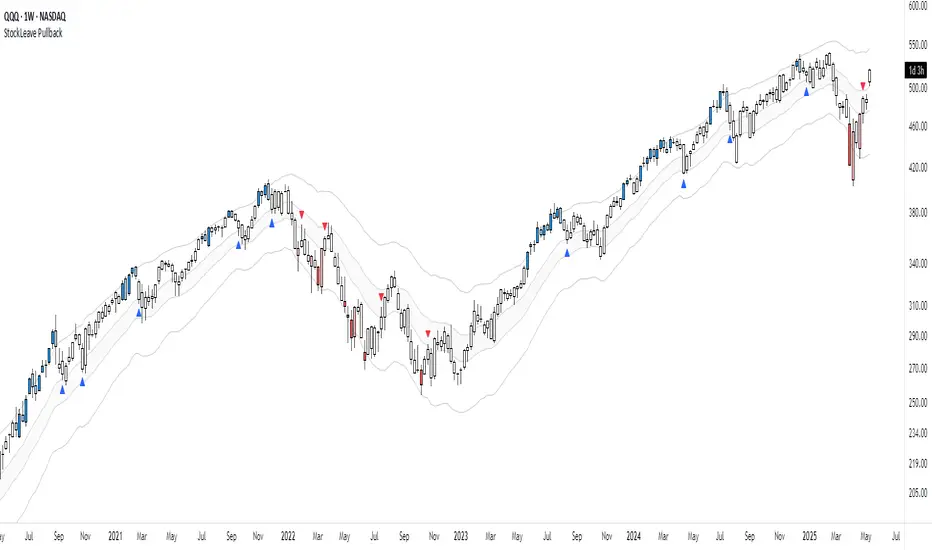
StockLeave PullbackThe indicator is made to locate pullbacks that occur in response to momentum moves. It shows potential pullback setups based on envelopes, mean spread conditions and price structure. It provides a reference for discretionary interpretation, not a replacement for it.
Momentum Condition
When price remains inside the envelope, it is considered normal behavior based on recent conditions. When price touches or exceeds the outer envelope, constructed from the mean ± ATR multiplier, it could indicate directional pressure. This suggests that price is moving with enough force to exceed its recent average range, which could correspond to meaningful momentum.
Blue colors show upward momentum
Red colors show downward momentum
This marks a momentum move that could be of interest if a pullback develops.
Pullback Condition
After a momentum move has been identified, the indicator monitors for one of two standardized pullback conditions:
A reversion to the mean zone, low threshold ATR around the mean value
A zero-line spread convergence, where the difference between two MA’s contracts near zero
When either condition is met following a prior momentum move, a triangle is plotted on the chart to indicate that a pullback has occurred. This is limited to one signal per condition for each momentum move.
Applied Discretion
These visual cues do not imply that an entry should be taken; they simply indicate that a pullback location has been reached in response to a momentum move. Manual evaluation is still required to determine whether the setup aligns with structure and context:
Whether the trend structure remains intact
Whether the pullback is controlled
Whether the trade aligns with the broader context
If these conditions are met, entries can be made based on a preferred execution pattern, such as a break above or below the prior bar.
Trend Reversal
This indicator is made to locate pullbacks in response to a momentum move. It does not aim to capture a trend reversal phase, as those moves often require further price movement before structure can be confirmed. For this reason, there will be no plots in the earlier phase since price will not exceed the envelope.
The better approach for those scenarios is to observe price action in combination with the Momentum H/L indicator , which measures changes in momentum and highlights extremes that could lead to initiation or exhaustion.
Settings Overview
Pullback Mode
None: No triangles plotted (default)
Mean Zone: Triangle when price pulls back into the mean zone
Zero Line: Triangle when moving average spread contracts near zero
Dual: Plots one triangle per momentum move, based on the first condition met
Show Envelope: Toggle envelope visibility
Show Mean Zone: Toggle mean zone visibility
Bar Colors: Set colors for bars during momentum moves
Intraday Fibs RetracementFibonacci (Fibs) levels are often used by traders as a way to find support and resistance, based on the Fibonacci sequence. These levels are widely used in technical analysis to identify potential reversal points in the price of an asset.
Fibs retracement draws lines at these Fibs level between a significant high and low point on a price chart.
What it shows:
This indicator will automatically draw Fibs Retracement Levels on your chart without any manual work.
It is designed to be used for day trading, especially in scenarios where a ticker gaps up/down large compared to the prior day close. (i.e. scenario where the difference of day's open and prior day close is large)
The drawing will happen on each trading day the moment trading hours open, and will NOT draw during pre-market and post-market.
User can see the line of each Fibs level, labelled with the Fib percentage and price value for the corresponding levels.
User will specify a start and end point of Fibs and based on the choice the indicator will automatically compute the other user defined Fibs levels and display on the chart.
How to use it:
The Fib levels drawn can be a potential support and resistance zone. Therefore in scenario where you already have a position and are approaching one of these levels it could be a point to close out some or all the position as you are approaching a resistance. On the other hand when price do approach these levels you could enter a position for a reversal trade. These are few ways to use the indicator but there are other ways that can be used, which can be found out by researching "Fibonacci (Fibs) Retracement".
In the example on the chart you can see a price bounce from the 0.7886 Fibs level on this particular day, where the price gapped up and was coming down after market hours opened.
Key settings:
1. Fibs Retracement Start and end Point: User selects where the Fibs levels should be drawn.
Available Options are:
Start Points:
Market Open
Market Open High (Dependent on the time frame you are on)
Pre-market High
Day's High
End Points:
Previous Day Close
Previous Day Low
Previous Day High
Pre-market Low (Current Day)
Day's Low
2. Custom Fib Levels: User can manually enter the Fib levels they want to see. (Max 9)
Default values are: 0,0.236,0.382,0.5,0.618,0.786,1,1.618,2.618.
3. Display settings: User can specify the line colour, thickness and style.
4. Label Setting: User can choose to turn on/off the labels for the each Fibs Level. Label will show the fib percentage and the corresponding price. User can also choose the location of the labels, defined by an offset from the current candle.
----------------------------------------------------------------------
If anything is not clear please let me know!

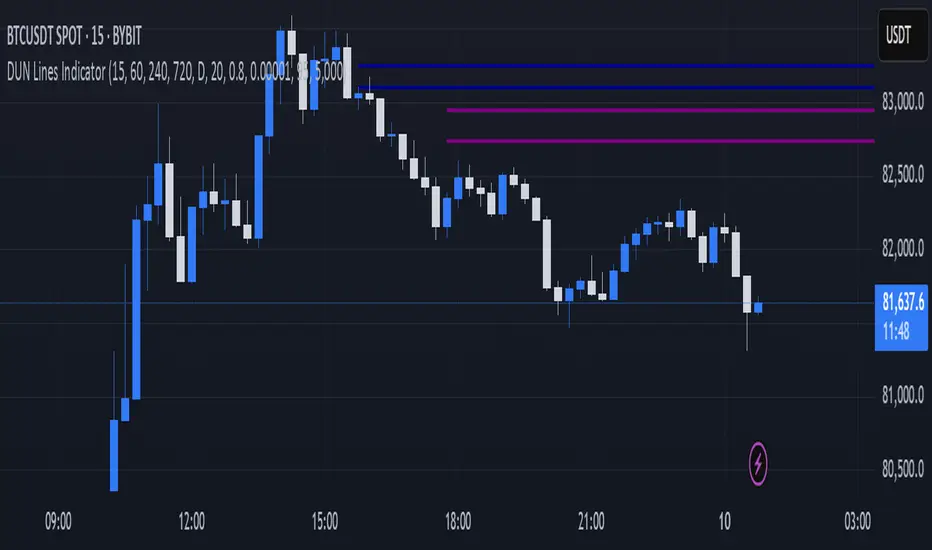
DUN Lines IndicatorThe DUN Lines indicator detects, filters and plots price imbalances (aka fair value gaps or fvgs/ifvgs). It is unique in the fact that it uses five timeframes and filters out overlapping, lower timeframe imbalances and fvgs below a user-definable size threshold.
Simply set your detection timeframes, colors and thresholds then set your chart to your preferred entry timeframe. When imbalances are mitigated, the FVG/IFVG is removed from the chart.
The indicator's default colors are my preferred ones for differentiating between timeframes, but these are easily changed. A single color with various levels of transparency to indicate timeframe strength is another approach that works nicely.
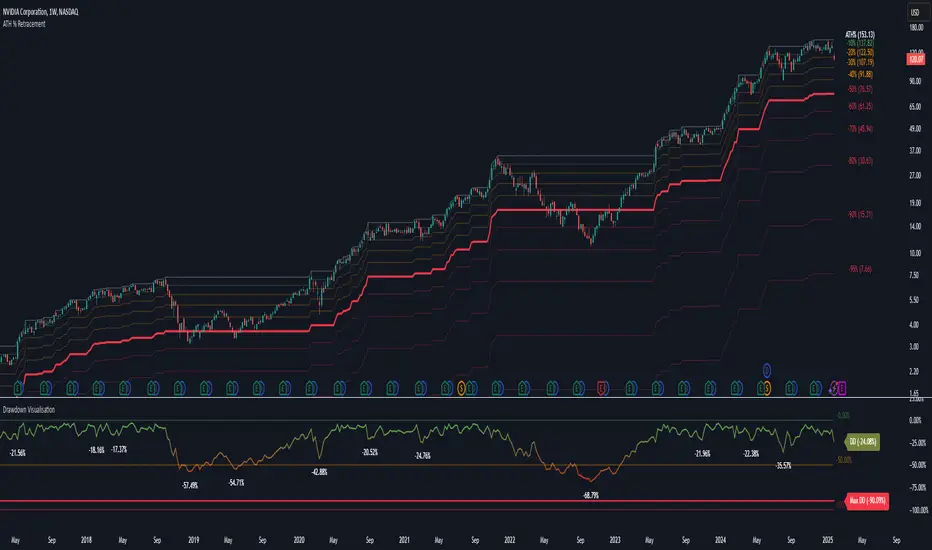
Drawdown Visualisation█ OVERVIEW
The Drawdown Visualisation indicator calculates and displays the instrument’s drawdown (in percent) relative to its all‐time high (ATH) from a user‐defined start date. It provides customisable options for label appearance, threshold lines (0%, –50%, –100%), and can plot historic drawdown levels via pivot detection.
█ USAGE
This indicator should be used with the Percentage Retracement from ATH indicator.
█ KEY FEATURES
Custom Date Settings — Use a custom start date so that only specified price action is considered.
Retracement Level Calculation — Determines ATH and computes multiple retracement levels using percentages from 0% to –100%.
Visual Signals and Customisation — Plots configurable horizontal lines and labels that display retracement percentages and prices.
Time Filtering — Bases calculations on data from the desired time period.
Historic Drawdowns — Display historical drawdowns
█ PURPOSE
Assist traders in visualising the depth of price retracements from recent or historical peaks.
Identify critical zones where the market may find support or resistance after reaching an ATH.
Facilitate more informed entry and exit decisions by clearly demarcating retracement levels on the chart.
█ IDEAL USERS
Swing Traders — Looking to exploit pullbacks following strong upward moves.
Technical Analysts — Interested in pinpointing key retracement levels as potential reversal or continuation points.
Price Action Traders — Focused on the nuances of market peaks and subsequent corrections.
Strategy Developers — Keen to backtest and refine approaches centred on retracement dynamics.
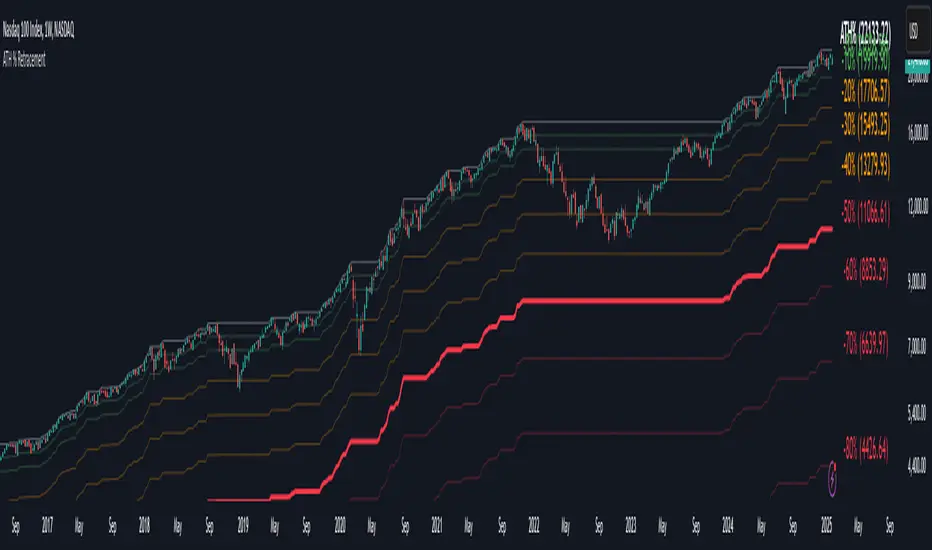
Percentage Retracement from ATH█ OVERVIEW
The Percentage Retracement from ATH indicator is a dynamic trading utility designed to help traders gauge market pullbacks from the peak price. By calculating key retracement levels based on the All-Time High (ATH) and user‑defined percentage inputs, it offers clear visual cues to assist in identifying potential support and resistance zones.
█ KEY FEATURES
Custom Date — Use a custom start date so the indicator only considers specified price action.
Retracement Calculation — Determines ATH and calculates levels based on user‑defined percentages (0% to –100%).
Visual Customisation — Plots configurable horizontal lines and labels showing retracement percentages and prices.
Time Filtering — Uses time filtering to base levels on the desired data period.
█ PURPOSE
Assist traders in visualising the depth of price retracements from recent or historical peaks.
Identify critical zones where the market may find support or resistance after reaching an ATH.
Facilitate more informed entry and exit decisions by clearly demarcating retracement levels on the chart.
█ IDEAL USERS
Swing Traders — Looking to exploit pullbacks following strong upward moves.
Technical Analysts — Interested in pinpointing key retracement levels as potential reversal or continuation points.
Price Action Traders — Focused on the nuances of market peaks and subsequent corrections.
Strategy Developers — Keen to backtest and refine approaches centred on retracement dynamics.
Deep Crab Harmonic Pattern [TradingFinder] Reversal Zones🔵 Introduction
The Deep Crab pattern is a 5-point extension harmonic structure (X-A-B-C-D) used in technical analysis to identify potential reversal points in financial markets. Like the original Crab pattern, it heavily relies on a 1.618 XA projection to form the Potential Reversal Zone (PRZ).
However, the key difference lies in the B point, which must be an 0.886 retracement of the XA leg. The D point in this pattern typically extends beyond the X point, signaling a strong potential reversal in price movement.
Bullish Deep Crab :
The Bullish Deep Crab is a pattern used in technical analysis to spot potential trend reversals. It signals a shift from a downtrend to an uptrend. Traders enter a buy position at the D point and set a stop-loss below point X, anticipating a price increase.
Bearish Deep Crab :
The Bearish Deep Crab is a reversal pattern that indicates the potential end of an uptrend. Traders enter a sell position at point D and set a stop-loss above point X, expecting the price to fall afterward.
🟣 Crab Vs Deep Crab
The Crab and Deep Crab patterns are both used to identify reversal points in technical analysis, but they differ in terms of correction depth :
Crab : The B point retraces between 38.2% to 61.8% of the XA leg, and point D extends beyond X, indicating a price reversal after a smaller correction.
Deep Crab : The B point retraces more deeply, around 88.6% of the XA leg, and point D has a stronger extension, signaling a reversal after a deeper correction.
The Deep Crab is more suited for identifying stronger price movements.
🔵 How to Use
To effectively use the Deep Crab pattern, it’s essential to correctly identify its five key points (X, A, B, C, and D) based on Fibonacci retracements and extensions. Traders look for a deep retracement at point B, followed by an extended move to point D, which typically signals a strong price reversal.
Once these points are established, traders can strategically enter positions at point D with appropriate stop-loss and take-profit levels, capitalizing on the anticipated market reversal. Proper use of Fibonacci tools is crucial for accurate pattern identification.
🟣 Bullish Deep Crab
To use the Bullish Deep Crab pattern, a trader identifies point D as the key price reversal point in a downtrend. Using Fibonacci tools, points X, A, B, and C are identified, with point B showing an 88.6% retracement of XA, and CD extending 1.618% of XA.
The trader enters a buy position at point D and sets a stop-loss below X, expecting a reversal from a downtrend to an uptrend.
🟣 Bearish Deep Crab
In the Bearish Deep Crab pattern, point D acts as the reversal point in an uptrend. After identifying points X, A, B, and C, D extends 1.618% of XA. Point B retraces 88.6% of XA. Traders enter a sell position at point D and place a stop-loss above X, anticipating a drop in price.
🔵 Setting
🟣 Logical Setting
ZigZag Pivot Period : You can adjust the period so that the harmonic patterns are adjusted according to the pivot period you want. This factor is the most important parameter in pattern recognition.
Show Valid Forma t: If this parameter is on "On" mode, only patterns will be displayed that they have exact format and no noise can be seen in them. If "Off" is, the patterns displayed that maybe are noisy and do not exactly correspond to the original pattern.
Show Formation Last Pivot Confirm : if Turned on, you can see this ability of patterns when their last pivot is formed. If this feature is off, it will see the patterns as soon as they are formed. The advantage of this option being clear is less formation of fielded patterns, and it is accompanied by the latest pattern seeing and a sharp reduction in reward to risk.
Period of Formation Last Pivot : Using this parameter you can determine that the last pivot is based on Pivot period.
🟣 Genaral Setting
Show : Enter "On" to display the template and "Off" to not display the template.
Color : Enter the desired color to draw the pattern in this parameter.
LineWidth : You can enter the number 1 or numbers higher than one to adjust the thickness of the drawing lines. This number must be an integer and increases with increasing thickness.
LabelSize : You can adjust the size of the labels by using the "size.auto", "size.tiny", "size.smal", "size.normal", "size.large" or "size.huge" entries.
🟣 Alert Setting
Alert : On / Off
Message Frequency : This string parameter defines the announcement frequency. Choices include: "All" (activates the alert every time the function is called), "Once Per Bar" (activates the alert only on the first call within the bar), and "Once Per Bar Close" (the alert is activated only by a call at the last script execution of the real-time bar upon closing). The default setting is "Once per Bar".
Show Alert Time by Time Zone : The date, hour, and minute you receive in alert messages can be based on any time zone you choose. For example, if you want New York time, you should enter "UTC-4". This input is set to the time zone "UTC" by default.
🔵 Conclusion
The Deep Crab pattern is a valuable reversal tool in technical analysis, known for its deep retracement and extended price movements.
Unlike other harmonic patterns, it emphasizes identifying critical points where price action is likely to reverse sharply. This pattern works well in both bullish and bearish market scenarios, offering clear signals for entry and exit points.
However, successful application requires a deep understanding of market behavior and precise use of technical tools like Fibonacci retracement. Overall, mastering this pattern can enhance trading strategies and risk management.

ICT KillZones + Pivot Points [TradingFinder] Support/Resistance 🟣 Introduction
Pivot Points are critical levels on a price chart where trading activity is notably high. These points are derived from the prior day's price data and serve as key reference markers for traders' decision-making processes.
Types of Pivot Points :
Floor
Woodie
Camarilla
Fibonacci
🔵 Floor Pivot Points
Widely utilized in technical analysis, floor pivot points are essential in identifying support and resistance levels. The central pivot point (PP) acts as the primary level, suggesting the trend's likely direction.
The additional resistance levels (R1, R2, R3) and support levels (S1, S2, S3) offer further insight into potential trend reversals or continuations.
🔵 Camarilla Pivot Points
Featuring eight distinct levels, Camarilla pivot points closely correspond with support and resistance, making them highly effective for setting stop-loss orders and profit targets.
🔵 Woodie Pivot Points
Similar to floor pivot points, Woodie pivot points differ by placing greater emphasis on the closing price, often resulting in different pivot levels compared to the floor method.
🔵 Fibonacci Pivot Points
Fibonacci pivot points combine the standard floor pivot points with Fibonacci retracement levels applied to the previous trading period's range. Common retracement levels used are 38.2%, 61.8%, and 100%.
🟣 Sessions
Financial markets are divided into specific time segments, known as sessions, each with unique characteristics and activity levels. These sessions are active at different times throughout the day.
The primary sessions in financial markets include :
Asian Session
European Session
New York Session
The timing of these major sessions in UTC is as follows :
Asian Session: 23:00 to 06:00
European Session: 07:00 to 14:25
New York Session: 14:30 to 22:55
🟣 Kill Zones
Kill zones are periods within a session marked by heightened trading activity. During these times, trading volume surges and price movements become more pronounced.
The timing of the major kill zones in UTC is :
Asian Kill Zone: 23:00 to 03:55
European Kill Zone: 07:00 to 09:55
New York Kill Zone: 14:30 to 16:55
Combining kill zones and pivot points in financial market analysis provides several advantages :
Enhanced Market Sentiment Analysis : Aligns key price levels with high-activity periods for a clearer market sentiment.
Improved Timing for Trade Entries and Exits : Helps better time trades based on when price movements are most likely.
Higher Probability of Successful Trades : Increases the accuracy of predicting market movements and placing profitable trades.
Strategic Stop-Loss and Profit Target Placement : Allows for precise risk management by strategically setting stop-loss and profit targets.
Versatility Across Different Time Frames : Effective in both short and long time frames, suitable for various trading strategies.
Enhanced Trend Identification and Confirmation : Confirms trends using both pivot levels and high-activity periods, ensuring stronger trend validation.
In essence, this integrated approach enhances decision-making, optimizes trading performance, and improves risk management.
🟣 How to Use
🔵 Two Approaches to Trading Pivot Points
There are two main strategies for trading pivot points: utilizing "pivot point breakouts" and "price reversals."
🔵 Pivot Point Breakout
When the price breaks through pivot lines, it signals a shift in market sentiment to the trader. In the case of an upward breakout, where the price crosses these pivot lines, a trader might enter a long position, placing their stop-loss just below the pivot point (P).
Conversely, if the price breaks downward, a short position can be initiated below the pivot point. When using the pivot point breakout strategy, the first and second support levels can serve as profit targets in an upward trend. In a downward trend, these roles are filled by the first and second resistance levels.
🔵 Price Reversal
An alternative method involves waiting for the price to reverse at the support and resistance levels. To implement this strategy, traders should take positions opposite to the prevailing trend as the price rebounds from the pivot point.
While this tool is commonly used in higher time frames, it tends to produce better results in shorter time frames, such as 1-hour, 30-minute, and 15-minute intervals.
Three Strategies for Trading the Kill Zone
There are three principal strategies for trading within the kill zone :
Kill Zone Hunt
Breakout and Pullback to Kill Zone
Trading in the Trend of the Kill Zone
🔵 Kill Zone Hunt
This strategy involves waiting until the kill zone concludes and its high and low lines are established. If the price reaches one of these lines within the same session and is strongly rejected, a trade can be executed.
🔵 Breakout and Pullback to Kill Zone
In this approach, once the kill zone ends and its high and low lines stabilize, a trade can be made if the price breaks one of these lines decisively within the same session and then pulls back to that level.
🔵 Trading in the Trend of the Kill Zone
Kill zones are characterized by high trading volumes and strong trends. Therefore, trades can be placed in the direction of the prevailing trend. For instance, if an upward trend dominates this area, a buy trade can be entered when the price reaches a demand order block.

Pivot Points Level [TradingFinder] 4 Methods + Reversal lines🔵 Introduction
"Pivot Points" are places on the price chart where buyers and sellers are most active. Pivot points are calculated based on the previous day's price data and serve as reference points for traders to make decisions.
Types of Pivot Points :
Floor
Woodie
Camarilla
Fibonacci
🟣 Floor Pivot Points
Floor pivot points are widely used in technical analysis. The central pivot point (PP) serves as the main level of support or resistance, indicating the potential direction of the trend.
The first to third levels of resistance (R1, R2, R3) and support (S1, S2, S3) provide additional signals for potential trend reversals or continuations.
Floor Pivot Points Formula :
Pivot Point (PP): (H + L + C) / 3
First Resistance (R1): (2 * P) - L
Second Resistance (R2): P + H - L
Third Resistance (R3): H + 2 * (P - L)
First Support (S1): (2 * P) - H
Second Support (S2): P - H + L
Third Support (S3): L - 2 * (H - P)
🟣 Camarilla Pivot Points
Camarilla pivot points include eight levels that closely align with support and resistance. These points are particularly useful for setting stop-loss and profit targets.
Camarilla Pivot Points Formula :
Fourth Resistance (R4): (H - L) * 1.1 / 2 + C
Third Resistance (R3): (H - L) * 1.1 / 4 + C
Second Resistance (R2): (H - L) * 1.1 / 6 + C
First Resistance (R1): (H - L) * 1.1 / 12 + C
First Support (S1): C - (H - L) * 1.1 / 12
Second Support (S2): C - (H - L) * 1.1 / 6
Third Support (S3): C - (H - L) * 1.1 / 4
Fourth Support (S4): C - (H - L) * 1.1 / 2
🟣 Woodie Pivot Points
Woodie pivot points are similar to floor pivot points but place more emphasis on the closing price. This method often results in different pivot levels than the floor method.
Woodie Pivot Points Formula :
Pivot Point (PP): (H + L + 2 * C) / 4
First Resistance (R1): (2 * P) - L
Second Resistance (R2): P + H - L
First Support (S1): (2 * P) - H
Second Support (S2): P - H + L
🟣 Fibonacci Pivot Points
Fibonacci pivot points use the standard floor pivot points and then apply Fibonacci retracement levels to the range of the previous trading period. The common retracement levels used are 38.2%, 61.8%, and 100%.
Fibonacci Pivot Points Formula :
Pivot Point (PP): (H + L + C) / 3
Third Resistance (R3): PP + ((H - L) * 1.000)
Second Resistance (R2): PP + ((H - L) * 0.618)
First Resistance (R1): PP + ((H - L) * 0.382)
First Support (S1): PP - ((H - L) * 0.382)
Second Support (S2): PP - ((H - L) * 0.618)
Third Support (S3): PP - ((H - L) * 1.000)
These pivot point calculations help traders identify potential support and resistance levels, enabling more informed decision-making in their trading strategies.
🔵 How to Use
🟣 Two Methods for Trading Pivot Points
There are two primary methods for trading pivot points: trading with "pivot point breakouts" and trading with "price reversals."
🟣 Pivot Point Breakout
A breakout through pivot lines provides a significant signal to the trader, indicating a change in market sentiment. When an upward breakout occurs and the price crosses these lines, a trader can enter a long position and place their stop-loss below the pivot point (P).
Similarly, if a downward breakout happens, a short order can be placed below the pivot point.
When trading with pivot point breakouts, if the upward trend breaks, the first and second support levels can be the trader's profit targets. In a downward trend, the first and second resistance levels will serve this role.
🟣 Price Reversal
Another method for trading pivot points is waiting for the price to reverse from the support and resistance levels. To execute this strategy, one should trade in the opposite direction of the trend as the price reverses from the pivot point.
It's worth noting that although traders use this tool in higher time frames, it yields better results in shorter time frames such as one-hour, 30-minute, and 15-minute intervals.

HT: Waves LightIndicator visualizes waves, based on candlestick analysis (one-time-framing and price action concepts), eliminating subjectivity bias that often plagues manual charting of waves. It also doesn’t require much tuning to adjust for specific ticket unlike zigzag or other volatility-based indicators.
Waves can be used to detect current trend and assess its healthiness. For example, we can compare lengths of bullish and bearish waves to detect shift in power. Also, visualization of waves makes it easy to identify chart patterns such as double tops/bottoms, head-and-shoulders etc…
Another application is using waves’ pv points as reference levels to check for Change of Character. For example, in an uptrend higher low (HL) often acts as major support level. If broken it indicates a major change of character (i.e. possible trend reversal)
How it works?
Waves construction:
• Wave construction depends on the selected timeframe.
• Bullish wave lasts while every new candlestick low is higher than previous candlestick low. Breaking of this rule marks change of direction.
• Bearish wave lasts while every new candlestick high is lower than previous candlestick high. Breaking of this rule marks change of direction.
• Outside bars (when new high is higher than previous and new low is lower than previous) are interpreted as continuation of current direction unless counter-movement is really strong
• There is a time lag, measured in candlesticks, between actual direction change and when this change was detected (small triangle markers on the chart)
• Only confirmed bars are used for calculations.
Trend detection:
• Trend detection is based on price-action principle. Uptrend is marked by rising highs and lows; downtrend - by falling highs and lows. We need at least two highs and two lows to confirm trend.
• There are situations of uncertainty when we have higher low and lower high at the same time. They can resolve into continuation of the current trend or into its reversal. Such situations are drawn in gray color.
Pivot Points
Indicator does marking of pivot points based on their relative position - higher low (HL), lower low (LL), higher high (HH), lower high (LH) – and shows retracement level for correction waves.
Parameters:
• Allowance - allowance in ticks that must be exceeded to trigger direction reversal. E.g. if value = 10, then bullish wave ends when new candle low is 10 ticks lower than previous candle low (except for outside bars). Low values are recommended for lower timeframes and/or low volatility tickets; higher values – for higher timeframes and/or high volatility.
• Periods Back – number of candles back from the direction change signal to look for pivot low/high. In 90% of cases 5 is the optimal value but sometimes you might want to increase it for better fit (e.g. for low timeframes/low volatility)
Disclaimer
This indicator should not be used as a standalone tool to make trading decisions. It should be used in conjunction with other technical analysis methods.
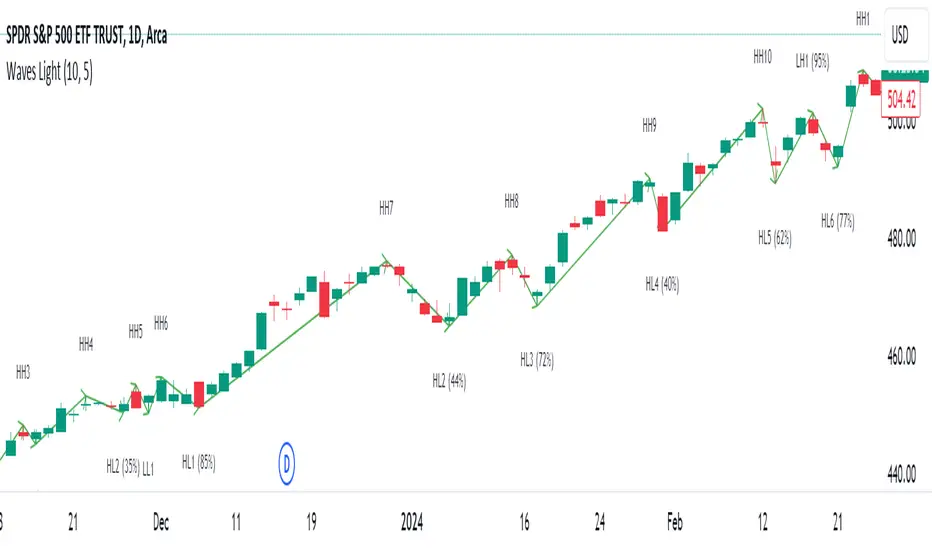
Smart Orderblocks / Supply and Demand (@JP7FX)
"Smart" Order Block Supply and Demand Indicator – a tool inspired by Smart Money Concepts and designed to complement your trading style.
It's not about perfection, but rather about enhancing your trading insights and catching things you might have missed.
Keep in mind that the structural representation here is subjective, just like many other indicators. It's more of a guide to help you navigate the market.
While it doesn't explicitly include Imbalance / FVG, you have the flexibility to use additional Imbalance /FVG indicators, including my own, to complement the insights drawn from Supply and Demand zones.
This indicator offers customisation options like trading ranges, allowing you to mark Killzones and tailor it to your preferences. Explore liquidity levels, 50% retracement lines, and personalize the colors and lines to match your unique chart setup.
Guide below on how the "Hidden" Zones are created!
Trade Safe :)
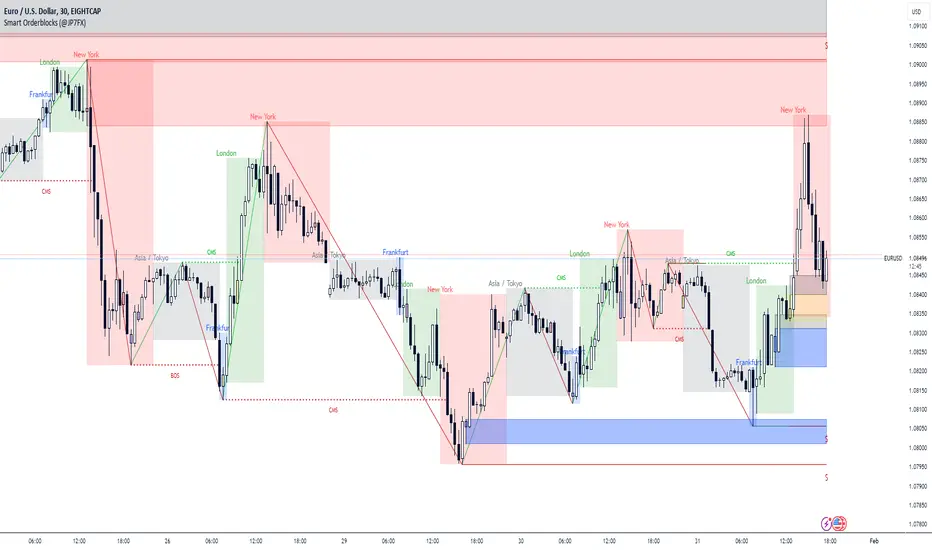
Liquidation Zone [Pt]█ Introduction
The Liquidation Zone indicator is designed to identify key price ranges where significant market activity, such as the liquidation of positions, is likely to occur. These zones are identified based on a specific candlestick pattern, offering insights into potential areas of market sensitivity.
█ Key Features:
► Specific Candlestick Pattern Identification: The indicator identifies liquidation zones by detecting a pattern where a red candle is encased within a series of green candles (in bullish scenarios) or a green candle within red candles (in bearish scenarios). This pattern often suggests a point where the market pauses to liquidate positions before continuing the prevailing trend.
► Market Reaction Points: These liquidation zones represent significant levels where the market previously decided to liquidate or adjust positions, indicating potential areas where price might react upon revisit.
► Integration with Volatility and Volume Data: The script combines these candlestick patterns with volatility (using ATR) and volume data, adding depth to the analysis and increasing the reliability of these zones as potential reaction areas.
► Visual Zone Mapping on Charts: Liquidation Zones are clearly marked on the trading chart for easy identification, aiding traders in visualizing these critical market areas.
█ Possible Use Cases
► Identifying Potential Reaction Areas
Traders can use the Liquidation Zone indicator to pinpoint zones where the market might pause or reverse due to previous liquidation activities. These areas can be key for planning entries, exits, or expecting increased market volatility.
► Enhancing Trading Strategy
Incorporating the analysis of liquidation zones into a trading strategy allows for a more nuanced understanding of market behavior, particularly in recognizing potential areas where price might experience significant support or resistance.
► Complementing Technical Analysis
This indicator is a valuable addition to a technical analyst's toolkit. When used alongside other analysis tools, it provides a more comprehensive view of the market, enhancing decision-making and strategy formulation.
Auto Fibonacci Retracement // Atilla YurtsevenOverview:
This Pine Script™ is a specialized tool for traders, designed to automatically plot Fibonacci retracement levels over a user-defined date range in trading charts. It also indicates the extent of price retracement within these levels.
Key Features:
Date Range Customization: Users can specify the start and end dates to focus the analysis on a particular trading period.
Dynamic Fibonacci Levels: The script includes various Fibonacci ratios (0.0, 0.236, 0.382, 0.5, 0.618, 0.786, 1.0), with the flexibility to enable or disable individual levels.
Visual Customization: Each Fibonacci level can be customized for color and line style (solid, dotted, dashed). Labels for each level are also configurable.
Retracement Measurement: The script not only draws the Fibonacci levels but also measures and displays how much the price has retraced within these levels.
Extension and Additional Options: Users have options to extend the Fibonacci lines and additional features such as using close values, trend drawing, date range display, and more.
Technical Insights:
The script identifies high and low values within the selected time frame, assessing the market's trend direction.
Within the specified date range, this script effortlessly plots the Fibonacci levels automatically, bringing clarity and precision to your market analysis as it unfolds.
The tool's adaptability makes it suitable for various trading styles and chart preferences.
Intended Use:
This script is particularly valuable for technical analysts and traders who use Fibonacci retracements to identify potential support and resistance areas and understand the depth of market corrections or rallies.
Disclaimer:
This Pine Script™ is offered 'as is', without any guarantees or warranties. It is intended for informational purposes and should not be taken as investment advice. Atilla Yurtseven, the creator of this script, assumes no responsibility for any financial losses or gains that may result from its usage. Users should perform their own due diligence and consult with professional advisors before making any investment decisions.
Remember to follow and comment!
Trade smart, stay safe
Atilla Yurtseven

Triple Ehlers Market StateClear trend identification is an important aspect of finding the right side to trade, another is getting the best buying/selling price on a pullback, retracement or reversal. Triple Ehlers Market State can do both.
Three is always better
Ehlers’ original formulation produces bullish, bearish and trendless signals. The indicator presented here gate stages three correlation cycles of adjustable lengths and degree thresholds, displaying a more refined view of bullish, bearish and trendless markets, in a compact and novel way.
Stick with the default settings, or experiment with the cycle period and threshold angle of each cycle, then choose whether ‘Recent trend weighting’ is included in candle colouring.
John Ehlers is a highly respected trading maths head who may need no introduction here. His idea for Market State was published in TASC June 2020 Traders Tips. The awesome interpretation of Ehlers’ work on which Triple Ehlers Market State’s correlation cycle calculations are based can be found at:
DISCLAIMER: None of this is financial advice.
