Adil Hoca - US Market Score Only NasdaqMarket Score & Crash Detector Indicator
User Guide & Usage Instructions
This TradingView indicator provides a comprehensive market risk assessment, combining multiple financial metrics to detect potential market crashes, recessions, and overall trend regimes. It is especially designed to alert traders and investors about early warning signals before significant market downturns, enabling proactive decision-making.
Key Features
Multi-Metric Market Sentiment: Uses volatility indices, currency strength, yield spreads, breadth, and bond ratios to evaluate market health.
Crash Detection System: Monitors various conditions such as VIX spikes, breadth collapse, momentum cliffs, high-yield spread surges, and hidden market weaknesses.
Reccession Indicator: Incorporates the Sahm Rule, a proven recession indicator based on employment data.
Alert System: Sends real-time alerts for critical market conditions, including crashes, recession signals, and spreads alerts.
Visual Elements: Includes histograms, trend lines, threshold lines, and shape signals to visually interpret market states.
Customizable Parameters: Adjust weights, sensitivity, thresholds, and alert preferences to suit your trading style.
How it Works
1. Data Collection
The indicator fetches data from multiple sources:
Market volatility: VIX index
Currency strength: DXY index
Interest rates: SOFR, PCE inflation
Yield spreads: High Yield Credit Spread, Investment Grade Spread
Market Breadth: Ratio of QQQ to TLT (tech vs. bonds)
Bond Ratios: TMF/TMV (long-term bonds)
Employment Data: The Sahm Rule (monthly unemployment data)
2. Normalization
Data is normalized via z-score calculations over defined periods to standardize the metrics, making them comparable regardless of their original scale.
3. Composite Score Calculation
Each metric is weighted according to user-defined parameters, and a composite score is generated to represent the overall market sentiment, smoothed with an EMA for trend clarity.
4. Crash & Recession Detection
Crash System: Looks for conditions like VIX spikes, breadth collapse, momentum drops, high yield spread surges, and hidden weaknesses. If multiple conditions meet thresholds, alerts trigger.
Recession Indicator: Uses the Sahm Rule, which compares the current unemployment rate's three-month average to the lowest point over the past 12 months. When it exceeds a certain threshold, a recession signal is generated.
5. Alerts & Visualization
Sound & Shape Alerts: Signals like warning triangles, cross icons, and color changes.
Threshold Lines: Indicate levels like "Strong Bullish," "Strong Bear," and critical zones.
Dual Confirmation: Combines crash and recession signals for high-confidence alerts.
Usage & Customization
Placing the Indicator
Copy and paste the Pine Script code into TradingView's Pine Editor.
Save and add the script to your chart. Adjust inputs like weights, sensitivity mode, thresholds, and alert preferences via the input panel.
Key Inputs
Weights: Customize the importance of each metric.
Sensitivity Mode: Changes alert thresholds for early warnings.
Crash Sensitivity: Defines how many indicators need to trigger before issuing a crash alert.
Recession Thresholds: Set the unemployment level that signals recession.
Interpreting Visuals
Histogram: Shows the composite score; green means bullish, red indicates bearish.
Momentum Line: Highlights trend acceleration/deceleration.
Threshold Lines: Dotted/dashed lines showing critical zones.
Shape Shapes: Triangles or crosses appear for early signals or critical events.
Alerts
Crash Alerts: Warn of imminent market crashes.
Recession Alerts: Indicate economic downturns based on Sahm Rule.
Spread Alerts: Show high-yield credit spread surges signaling stress.
Double Confirmation: High-confidence signals when crash and recession conditions align.
Best Practices
Use on multiple timeframes for confirmation.
Combine with other technical analysis tools for better accuracy.
Adjust thresholds according to your risk appetite.
Follow alert signals for early warning but always consider overall context.
Final Notes
This indicator synthesizes a variety of leading and lagging indicators to give a holistic view of market health. It is designed to provide early warnings, especially in volatile or stressed environments, helping traders avoid severe drawdowns or position ahead of major downturns.
Feel free to modify input parameters for your preferences, or integrate additional data sources for further refinement.
This detailed explanation can be directly included as a description or documentation within your TradingView script, helping users grasp its full capabilities and optimal usage.
"北京地铁3号线和12号线线路图"に関するスクリプトを検索

Session ParmezanForex Session Range Boxes (Asia, Europe, US) — visual intraday session tracker for Forex and metals.
This indicator automatically marks the three major Forex trading sessions — Asian (Tokyo), European (London), and American (New York) — directly on your chart using dynamic colored boxes.
Each box represents the full price range (High–Low) formed during that session, helping traders visualize how volatility and liquidity evolve across the global trading day.
The script is built for intraday traders and session-based strategies, especially those who monitor breakouts from the Asian range or reactions during London–New York overlaps.
⚙️ Features
• Accurate session timing (UTC+3 / Moscow Time) — Asia: 03:00–12:00, Europe: 11:00–20:00, US: 16:00–01:00.
• Dynamic range boxes: each box expands in real time as new highs and lows are set during the session.
• Clear visual separation: each session is shown in its own color (blue for Asia, orange for Europe, green for US).
• Automatic daily reset — new boxes start every new session.
• Intraday focus only — visible up to the 1-hour timeframe (M1–H1) for clarity.
• Transparent design — semi-transparent fills keep candles readable even when sessions overlap.
• Lightweight performance — optimized use of box.new() and var variables avoids lag on lower timeframes.
🧭 Typical Use-Cases
• Identify Asian session ranges and watch for London breakouts or New York reversals.
• Visually align your intraday strategy with session volatility cycles.
• Combine with VWAP, liquidity zones, or market profile indicators for deeper confluence.
• Spot overlapping sessions — often the most active periods of the day.

DTC Killzones ICT🕐 DTC Killzones ICT — Visualize Market Sessions Like a Pro
The DTC Killzones ICT indicator is a clean and intuitive tool designed for traders who want to analyze and visualize institutional trading sessions directly on their charts.
Inspired by ICT’s Killzone concept , this script makes it easy to identify overlapping market sessions — such as London, New York, and Asian — and track how price behaves within each zone.
💡 What It Does
This indicator automatically highlights key market sessions (Killzones) on your chart with fully customizable colors, labels, and transparency.
Each zone dynamically updates to reflect real-time highs and lows, helping you identify:
Session ranges and liquidity zones
Volatility windows and breakout areas
Institutional footprints across sessions
Whether you trade Forex, Indices, or Crypto , this script gives you visual clarity on when and where smart money is likely to move.
⚙️ Main Features
✅ Up to four customizable sessions (New York, London, Asian, and London Close)
✅ Adjustable timeframes and timezone options — sync with your exchange or custom UTC offset
✅ Dynamic high/low range tracking for each session
✅ Toggle range outlines, session labels , and transparency levels
✅ Optional daily dividers and session transition markers
✅ Works on any timeframe and any symbol
🧠 How Traders Use It
ICT-based traders can easily mark Killzones to align with setups like FVGs, liquidity grabs, or Silver Bullet entries.
Intraday traders can visualize session volatility and overlap periods for potential entries.
Swing traders can identify daily structure shifts by tracking range-to-range behavior.
🛠️ Customization
You can fully rename, recolor, or disable each session block.
Adjust the range transparency for visual comfort, and toggle session or daily dividers to fit your workflow.
Everything is designed to be clean, light, and modular — no clutter, no confusion.
⚡ Recommended Settings
For ICT-style analysis:
London Session: 02:00–05:00
New York Session: 07:00–10:00
Asian Session: 19:30–24:00
London Close Session: 10:00–12:00
These time windows are fully editable to suit your timezone or strategy.
🧩 Compatibility
Works seamlessly with TradingView’s built-in timezone tools
Compatible with all instruments and timeframes
Designed to overlay directly on your price chart
🏁 Final Notes
The DTC Killzones ICT indicator focuses purely on market session visualization — no alerts, entries, or trading signals.
It’s designed to complement your existing strategies and enhance clarity when analyzing market behavior across global sessions.
📈 Built for traders who value precision, structure, and timing.


NY ORB - Full Dynamic SystemNY ORB - Full Dynamic Strategy Summary
1. Opening Range and Session Timing
Opening Range (ORB) Calculation: The strategy identifies the ORB High and ORB Low by tracking the highest high and lowest low during the specified New York pre-market window, which is set by default from 8:30 to 8:45 (New York time).
Entry Window: Trading activity is restricted to a specific entry period, typically starting shortly after the ORB is established (default: 8:50 to 12:00).
Hard Exit Time: Any remaining open positions are automatically closed at a fixed exit time (default: 13:25).
2. Trade Entry Logic and Filters
An entry (Long or Short) is generated when the price breaks out of the established ORB, provided it passes a series of optional filters:
Direction Control: The user can restrict the strategy to trade Long Only, Short Only, or Both.
Second Breakout Logic: An optional filter that requires the price to break out, reverse back into the range, and then break out again, confirming momentum after a consolidation.
Confirmation Candle Count: An optional filter that checks the close of a previous candle (e.g., 1 or 2 candles ago) to ensure the price was still inside the range, preventing premature entry.
Technical Filters (Optional): The entry is only executed if it aligns with selected indicators:
RSI: Filters for non-overbought (Long) or non-oversold (Short) conditions.
MACD: Requires the MACD line to be above/below the Signal line for alignment.
VWAP: Requires the price to be above/below the Volume-Weighted Average Price.
Trend Filter (SMMA): Requires the price to be above/below a 50-period Simple Moving Average.
3. Dynamic Risk and Exit Management
This strategy features highly configurable stop-loss and profit-taking mechanics:
Primary Stop Loss Methods: The Stop Loss distance can be dynamically chosen from four types:
Fixed: A fixed number of ticks.
ATR: Based on a multiple of the Average True Range (ATR).
Capped ATR: ATR-based, but with a hard maximum tick limit.
OR-Based: Based on a multiple of the actual ORB High-to-Low range.
Dynamic Profit Target: The Take Profit level is calculated dynamically based on a multiplier of either the ATR or the ORB Range.
Breakeven Stop:
If enabled, the Stop Loss automatically moves to the entry price (Breakeven) once the price moves a predetermined distance in the profitable direction.
An Adaptive Breakeven option allows the trigger distance to be calculated as a percentage of the overall ATR Profit Target.
Trailing Stop: The strategy uses a trailing stop, which can be custom-set (fixed ticks) or dynamically tied to the ATR. An optional feature Auto Tighten Trailing reduces the trailing multiplier once the breakeven level is hit.
MA Cross Exit: An alternative, counter-trend exit mechanism that closes the trade if the price crosses back over the chosen Moving Average (either SMMA or VWAP), overriding the pending profit target.
4. Daily Account Management
The strategy includes crucial daily risk controls to protect capital and lock in profits:
Daily Profit Limit: If the total daily PnL (realized and unrealized) hits a predefined maximum profit threshold (in ticks), all trades are closed, and new entries are blocked for the remainder of the trading day.
Daily Loss Limit: Conversely, if the total daily PnL hits a predefined maximum loss threshold, all trades are closed, and new entries are blocked for the remainder of the day.

Trailing 12M % Gain/Lossthis script shows profit or loss for training 12 months, works only on daily time frame


Accumulation Distribution LineThis indicator provides an implementation of the classic Accumulation/Distribution Line (ADL). It enhances the standard indicator with a built-in divergence detection engine.
Key Features:
Full Divergence Suite (Class A, B, C): The primary feature is the integrated divergence engine. It automatically detects and plots all three major types of divergences:
Regular (A): Signals potential trend reversals.
Hidden (B): Signals potential trend continuations.
Exaggerated (C): Signals weakness at double tops/bottoms.
Divergence Filtering and Visualization:
Price Tolerance Filter: Divergence detection is enhanced with a percentage-based price tolerance (pivPrcTol) to filter out insignificant market noise, leading to more robust signals.
Persistent Visualization: Divergence markers are plotted for the entire duration of the signal and are visually anchored to the ADL level of the confirming pivot.
Note on Confirmation (Lag): Divergence signals rely on a pivot confirmation method to ensure they do not repaint.
The Start of a- divergence is only detected after the confirming pivot is fully formed (a delay based on Pivot Right Bars).
The End of a divergence is detected either instantly (if the signal is invalidated by price action) or with a delay (when a new, non-divergent pivot is confirmed).
Multi-Timeframe (MTF) Capability:
MTF ADL Line: The ADL line itself can be calculated on a higher timeframe, with standard options to handle gaps (Fill Gaps) and prevent repainting (Wait for...).
Limitation: The Divergence detection engine (pivDiv) is disabled if a timeframe other than the chart's timeframe is selected. Divergences are only calculated on the active chart timeframe.
Integrated Alerts: Includes 12 comprehensive alerts that trigger on the start and end of all 6 divergence types (e.g., "Regular Bullish Started", "Regular Bullish Ended").
DISCLAIMER
For Informational/Educational Use Only: This indicator is provided for informational and educational purposes only. It does not constitute financial, investment, or trading advice, nor is it a recommendation to buy or sell any asset.
Use at Your Own Risk: All trading decisions you make based on the information or signals generated by this indicator are made solely at your own risk.
No Guarantee of Performance: Past performance is not an indicator of future results. The author makes no guarantee regarding the accuracy of the signals or future profitability.
No Liability: The author shall not be held liable for any financial losses or damages incurred directly or indirectly from the use of this indicator.
Signals Are Not Recommendations: The alerts and visual signals (e.g., crossovers) generated by this tool are not direct recommendations to buy or sell. They are technical observations for your own analysis and consideration.

On Balance VolumeThis indicator provides an implementation of the classic On Balance Volume (OBV) momentum indicator, enhanced with a built-in divergence detection engine.
Key Features:
Full Divergence Suite (Class A, B, C): The primary feature is the integrated divergence engine. It automatically detects and plots all three major types of divergences:
Regular (A): Signals potential trend reversals.
Hidden (B): Signals potential trend continuations.
Exaggerated (C): Signals weakness at double tops/bottoms.
Divergence Filtering and Visualization:
Price Tolerance Filter: Divergence detection is enhanced with a percentage-based price tolerance (pivPrcTol) to filter out insignificant market noise, leading to more robust signals.
Persistent Visualization: Divergence markers are plotted for the entire duration of the signal and are visually anchored to the OBV level of the confirming pivot.
Note on Confirmation (Lag): Divergence signals rely on a pivot confirmation method to ensure they do not repaint.
The Start of a- divergence is only detected after the confirming pivot is fully formed (a delay based on Pivot Right Bars).
The End of a divergence is detected either instantly (if the signal is invalidated by price action) or with a delay (when a new, non-divergent pivot is confirmed).
Multi-Timeframe (MTF) Capability:
MTF OBV Line: The OBV line itself can be calculated on a higher timeframe, with standard options to handle gaps (Fill Gaps) and prevent repainting (Wait for...).
Limitation: The Divergence detection engine (pivDiv) is disabled if a timeframe other than the chart's timeframe is selected. Divergences are only calculated on the active chart timeframe.
Integrated Alerts: Includes 12 comprehensive alerts that trigger on the start and end of all 6 divergence types (e.g., "Regular Bullish Started", "Regular Bullish Ended").
DISCLAIMER
For Informational/Educational Use Only: This indicator is provided for informational and educational purposes only. It does not constitute financial, investment, or trading advice, nor is it a recommendation to buy or sell any asset.
Use at Your Own Risk: All trading decisions you make based on the information or signals generated by this indicator are made solely at your own risk.
No Guarantee of Performance: Past performance is not an indicator of future results. The author makes no guarantee regarding the accuracy of the signals or future profitability.
No Liability: The author shall not be held liable for any financial losses or damages incurred directly or indirectly from the use of this indicator.
Signals Are Not Recommendations: The alerts and visual signals (e.g., crossovers) generated by this tool are not direct recommendations to buy or sell. They are technical observations for your own analysis and consideration.

v2.0—Tristan's Multi-Indicator Reversal Strategy🎯 Multi-Indicator Reversal Strategy - Optimized for High Win Rates
A powerful confluence-based strategy that combines RSI, MACD, Williams %R, Bollinger Bands, and Volume analysis to identify high-probability reversal points . Designed to let winners run with no stop loss or take profit - positions close only when opposite signals occur.
Also, the 3 hour timeframe works VERY well—just a lot less trades.
📈 Proven Performance
This strategy has been backtested and optimized on multiple blue-chip stocks with 80-90%+ win rates on 1-hour timeframes from Aug 2025 through Oct 2025:
✅ V (Visa) - Payment processor
✅ MSFT (Microsoft) - Large-cap tech
✅ WMT (Walmart) - Retail leader
✅ IWM (Russell 2000 ETF) - Small-cap index
✅ NOW (ServiceNow) - Enterprise software
✅ WM (Waste Management) - Industrial services
These stocks tend to mean-revert at extremes, making them ideal candidates for this reversal-based approach. I only list these as a way to show you the performance of the script. These values and stock choices may change over time as the market shifts. Keep testing!
🔑 How to Use This Strategy Successfully
Step 1: Apply to Chart
Open your desired stock (V, MSFT, WMT, IWM, NOW, WM recommended)
Set timeframe to 1 Hour
Apply this strategy
Check that the Williams %R is set to -20 and -80, and "Flip All Signals" is OFF (can flip this for some stocks to perform better.)
Step 2: Understand the Signals
🟢 Green Triangle (BUY) Below Candle:
Multiple indicators (RSI, Williams %R, MACD, Bollinger Bands) show oversold conditions
Enter LONG position
Strategy will pyramid up to 10 entries if more buy signals occur
Hold until red triangle appears
🔴 Red Triangle (SELL) Above Candle:
Multiple indicators show overbought conditions
Enter SHORT position (or close existing long)
Strategy will pyramid up to 10 entries if more sell signals occur
Hold until green triangle appears
🟣 Purple Labels (EXIT):
Shows when positions close
Displays count if multiple entries were pyramided (e.g., "Exit Long x5")
Step 3: Let the Strategy Work
Key Success Principles:
✅ Be Patient - Signals don't occur every day, wait for quality setups
✅ Trust the Process - Don't manually close positions, let opposite signals exit
✅ Watch Pyramiding - The strategy can add up to 10 positions in the same direction
✅ No Stop Loss - Positions ride through drawdowns until reversal confirmed
✅ Session Filter - Only trades during NY session (9:30 AM - 4:00 PM ET)
⚙️ Winning Settings (Already Set as Defaults)
INDICATOR SETTINGS:
- RSI Length: 14
- RSI Overbought: 70
- RSI Oversold: 30
- MACD: 12, 26, 9 (standard)
- Williams %R Length: 14
- Williams %R Overbought: -20 ⭐ (check this! And adjust to your liking)
- Williams %R Oversold: -80 ⭐ (check this! And adjust to your liking)
- Bollinger Bands: 20, 2.0
- Volume MA: 20 periods
- Volume Multiplier: 1.5x
SIGNAL REQUIREMENTS:
- Min Indicators Aligned: 2
- Require Divergence: OFF
- Require Volume Spike: OFF
- Require Reversal Candle: OFF
- Flip All Signals: OFF ⭐
RISK MANAGEMENT:
- Use Stop Loss: OFF ⭐⭐⭐
- Use Take Profit: OFF ⭐⭐⭐
- Allow Pyramiding: ON ⭐⭐⭐
- Max Pyramid Entries: 10 ⭐⭐⭐
SESSION FILTER:
- Trade Only NY Session: ON
- NY Session: 9:30 AM - 4:00 PM ET
**⭐ = Critical settings for success**
## 🎓 Strategy Logic Explained
### **How It Works:**
1. **Multi-Indicator Confluence**: Waits for at least 2 out of 4 technical indicators to align before generating signals
2. **Oversold = Buy**: When RSI < 30, Williams %R < -80, price below lower Bollinger Band, and/or MACD turning bullish → BUY signal
3. **Overbought = Sell**: When RSI > 70, Williams %R > -20, price above upper Bollinger Band, and/or MACD turning bearish → SELL signal
4. **Pyramiding Power**: As trend continues and more signals fire in the same direction, adds up to 10 positions to maximize gains
5. **Exit Only on Reversal**: No arbitrary stops or targets - only exits when opposite signal confirms trend change
6. **Session Filter**: Only trades during liquid NY session hours to avoid overnight gaps and low-volume periods
### **Why No Stop Loss Works:**
Traditional reversal strategies fail because they:
- Get stopped out too early during normal volatility
- Miss the actual reversal that happens later
- Cut winners short with tight take profits
This strategy succeeds because it:
- ✅ Rides through temporary noise
- ✅ Captures full reversal moves
- ✅ Uses multiple indicators for confirmation
- ✅ Pyramids into winning positions
- ✅ Only exits when technical picture completely reverses
---
## 📊 Understanding the Display
**Live Indicator Counter (Top Corner / end of current candles):**
Bull: 2/4
Bear: 0/4
(STANDARD)
Shows how many indicators currently align bullish/bearish
"STANDARD" = normal reversal mode (buy oversold, sell overbought)
"FLIPPED" = momentum mode if you toggle that setting
Visual Indicators:
🔵 Blue background = NY session active (trading window)
🟡 Yellow candle tint = Volume spike detected
💎 Aqua diamond = Bullish divergence (price vs RSI)
💎 Fuchsia diamond = Bearish divergence
⚡ Advanced Tips
Optimizing for Different Stocks:
If Win Rate is Low (<50%):
Try toggling "Flip All Signals" to ON (switches to momentum mode)
Increase "Min Indicators Aligned" to 3 or 4
Turn ON "Require Divergence"
Test on different timeframe (4-hour or daily)
If Too Few Signals:
Decrease "Min Indicators Aligned" to 2
Turn OFF all requirement filters
Widen Williams %R bands to -15 and -85
If Too Many False Signals:
Increase "Min Indicators Aligned" to 3 or 4
Turn ON "Require Divergence"
Turn ON "Require Volume Spike"
Reduce Max Pyramid Entries to 5
Stock Selection Guidelines:
Best Suited For:
Large-cap stable stocks (V, MSFT, WMT)
ETFs (IWM, SPY, QQQ)
Stocks with clear support/resistance
Mean-reverting instruments
Avoid:
Ultra low-volume penny stocks
Extremely volatile crypto (try traditional settings first)
Stocks in strong one-directional trends lasting months
🔄 The "Flip All Signals" Feature
If backtesting shows poor results on a particular stock, try toggling "Flip All Signals" to ON:
STANDARD Mode (OFF):
Buy when oversold (reversal strategy)
Sell when overbought
May work best for: V, MSFT, WMT, IWM, NOW, WM
FLIPPED Mode (ON):
Buy when overbought (momentum strategy)
Sell when oversold
May work best for: Strong trending stocks, momentum plays, crypto
Test both modes on your stock to see which performs better!
📱 Alert Setup
Create alerts to notify you of signals:
📊 Performance Expectations
With optimized settings on recommended stocks:
Typical results we are looking for:
Win Rate: 70-90%
Average Winner: 3-5%
Average Loser: 1-3%
Signals Per Week: 1-3 on 1-hour timeframe
Hold Time: Several hours to days
Remember: Past performance doesn't guarantee future results. Always use proper risk management.

3D Institutional Battlefield [SurgeGuru]Professional Presentation: 3D Institutional Flow Terrain Indicator
Overview
The 3D Institutional Flow Terrain is an advanced trading visualization tool that transforms complex market structure into an intuitive 3D landscape. This indicator synthesizes multiple institutional data points—volume profiles, order blocks, liquidity zones, and voids—into a single comprehensive view, helping you identify high-probability trading opportunities.
Key Features
🎥 Camera & Projection Controls
Yaw & Pitch: Adjust viewing angles (0-90°) for optimal perspective
Scale Controls: Fine-tune X (width), Y (depth), and Z (height) dimensions
Pro Tip: Increase Z-scale to amplify terrain features for better visibility
🌐 Grid & Surface Configuration
Resolution: Adjust X (16-64) and Y (12-48) grid density
Visual Elements: Toggle surface fill, wireframe, and node markers
Optimization: Higher resolution provides more detail but requires more processing power
📊 Data Integration
Lookback Period: 50-500 bars of historical analysis
Multi-Source Data: Combine volume profile, order blocks, liquidity zones, and voids
Weighted Analysis: Each data source contributes proportionally to the terrain height
How to Use the Frontend
💛 Price Line Tracking (Your Primary Focus)
The yellow price line is your most important guide:
Monitor Price Movement: Track how the yellow line interacts with the 3D terrain
Identify Key Levels: Watch for these critical interactions:
Order Blocks (Green/Red Zones):
When yellow price line enters green zones = Bullish order block
When yellow price line enters red zones = Bearish order block
These represent institutional accumulation/distribution areas
Liquidity Voids (Yellow Zones):
When yellow price line enters yellow void areas = Potential acceleration zones
Voids indicate price gaps where minimal trading occurred
Price often moves rapidly through voids toward next liquidity pool
Terrain Reading:
High Terrain Peaks: High volume/interest areas (support/resistance)
Low Terrain Valleys: Low volume areas (potential breakout zones)
Color Coding:
Green terrain = Bullish volume dominance
Red terrain = Bearish volume dominance
Purple = Neutral/transition areas
📈 Volume Profile Integration
POC (Point of Control): Automatically marks highest volume level
Volume Bins: Adjust granularity (10-50 bins)
Height Weight: Control how much volume affects terrain elevation
🏛️ Order Block Detection
Detection Length: 5-50 bar lookback for block identification
Strength Weighting: Recent blocks have greater impact on terrain
Candle Body Option: Use full candles or body-only for block definition
💧 Liquidity Zone Tracking
Multiple Levels: Track 3-10 key liquidity zones
Buy/Sell Side: Different colors for bid/ask liquidity
Strength Decay: Older zones have diminishing terrain impact
🌊 Liquidity Void Identification
Threshold Multiplier: Adjust sensitivity (0.5-2.0)
Height Amplification: Voids create significant terrain depressions
Acceleration Zones: Price typically moves quickly through void areas
Practical Trading Application
Bullish Scenario:
Yellow price line approaches green order block terrain
Price finds support in elevated bullish volume areas
Terrain shows consistent elevation through key levels
Bearish Scenario:
Yellow price line struggles at red order block resistance
Price falls through liquidity voids toward lower terrain
Bearish volume peaks dominate the landscape
Breakout Setup:
Yellow price line consolidates in flat terrain
Minimal resistance (low terrain) in projected direction
Clear path toward distant liquidity zones
Pro Tips
Start Simple: Begin with default settings, then gradually customize
Focus on Yellow Line: Your primary indicator of current price position
Combine Timeframes: Use the same terrain across multiple timeframes for confluence
Volume Confirmation: Ensure terrain peaks align with actual volume spikes
Void Anticipation: When price enters voids, prepare for potential rapid movement
Order Blocks & Voids Architecture
Order Blocks Calculation
Trigger: Price breaks fractal swing points
Bullish OB: When close > swing high → find lowest low in lookback period
Bearish OB: When close < swing low → find highest high in lookback period
Strength: Based on price distance from block extremes
Storage: Global array maintains last 50 blocks with FIFO management
Liquidity Voids Detection
Trigger: Price gaps exceeding ATR threshold
Bull Void: Low - high > (ATR200 × multiplier)
Bear Void: Low - high > (ATR200 × multiplier)
Validation: Close confirms gap direction
Storage: Global array maintains last 30 voids
Key Design Features
Real-time Updates: Calculated every bar, not just on last bar
Global Persistence: Arrays maintain state across executions
FIFO Management: Automatic cleanup of oldest entries
Configurable Sensitivity: Adjustable lookback periods and thresholds
Scientific Testing Framework
Hypothesis Testing
Primary Hypothesis: 3D terrain visualization improves detection of institutional order flow vs traditional 2D charts
Testable Metrics:
Prediction Accuracy: Does terrain structure predict future support/resistance?
Reaction Time: Faster identification of key levels vs conventional methods
False Positive Reduction: Lower rate of failed breakouts/breakdowns
Control Variables
Market Regime: Trending vs ranging conditions
Asset Classes: Forex, equities, cryptocurrencies
Timeframes: M5 to H4 for intraday, D1 for swing
Volume Conditions: High vs low volume environments
Data Collection Protocol
Terrain Features to Quantify:
Slope gradient changes at price inflection points
Volume peak clustering density
Order block terrain elevation vs subsequent price action
Void depth correlation with momentum acceleration
Control Group: Traditional support/resistance + volume profile
Experimental Group: 3D Institutional Flow Terrain
Statistical Measures
Signal-to-Noise Ratio: Terrain features vs random price movements
Lead Time: Terrain formation ahead of price confirmation
Effect Size: Performance difference between groups (Cohen's d)
Statistical Power: Sample size requirements for significance
Validation Methodology
Blind Testing:
Remove price labels from terrain screenshots
Have traders identify key levels from terrain alone
Measure accuracy vs actual price action
Backtesting Framework:
Automated terrain feature extraction
Correlation with future price reversals/breakouts
Monte Carlo simulation for significance testing
Expected Outcomes
If hypothesis valid:
Significant improvement in level prediction accuracy (p < 0.05)
Reduced latency in institutional level identification
Higher risk-reward ratios on terrain-confirmed trades
Research Questions:
Does terrain elevation reliably indicate institutional interest zones?
Are liquidity voids statistically significant momentum predictors?
Does multi-timeframe terrain analysis improve signal quality?
How does terrain persistence correlate with level strength?
LuxAlgo BigBeluga hapharmonic

LibMvAvLibrary "LibMvAv"
This library provides a unified interface for calculating a
wide variety of moving averages. It is designed to simplify
indicator development by consolidating numerous MA calculations
into a single function and integrating the weighting
capabilities from the `LibWght` library.
Key Features:
1. **All-in-One MA Function:** The core of the library is the
`ma()` function. Users can select the desired calculation
method via the `MAType` enum, which helps create
cleaner and more maintainable code compared to using
many different `ta.*` or custom functions.
2. **Comprehensive Selection of MA Types:** It provides a
selection of 12 different moving averages, covering
common Pine Script built-ins and their weighted counterparts:
- **Standard MAs:** SMA, EMA, WMA, RMA (Wilder's), HMA (Hull), and
LSMA (Least Squares / Linear Regression).
- **Weighted MAs:** Weight-enhanced versions of the above
(WSMA, WEMA, WWMA, WRMA, WHMA, WLSMA).
3. **Integrated Weighting:** The library provides weighted versions
for each of its standard MA types (e.g., `wsma` alongside `sma`).
By acting as a dispatcher, the `ma()` function allows these
weighted calculations to be called using the optional
`weight` parameter, which are then processed by the `LibWght`
library.
4. **Simple API:** The library internally handles the logic of
choosing the correct function based on the selected `MAType`.
The user only needs to provide the source, length, and
optional weight, simplifying the development process.
---
**DISCLAIMER**
This library is provided "AS IS" and for informational and
educational purposes only. It does not constitute financial,
investment, or trading advice.
The author assumes no liability for any errors, inaccuracies,
or omissions in the code. Using this library to build
trading indicators or strategies is entirely at your own risk.
As a developer using this library, you are solely responsible
for the rigorous testing, validation, and performance of any
scripts you create based on these functions. The author shall
not be held liable for any financial losses incurred directly
or indirectly from the use of this library or any scripts
derived from it.
ma(maType, source, length, weight)
Returns the requested moving average.
Parameters:
maType (simple MAType) : simple MAType Desired type (see enum above).
source (float) : series float Data series to smooth.
length (simple int) : simple int Look-back / period length.
weight (float) : series float Weight series (default = na)
Returns: series float Moving-average value.
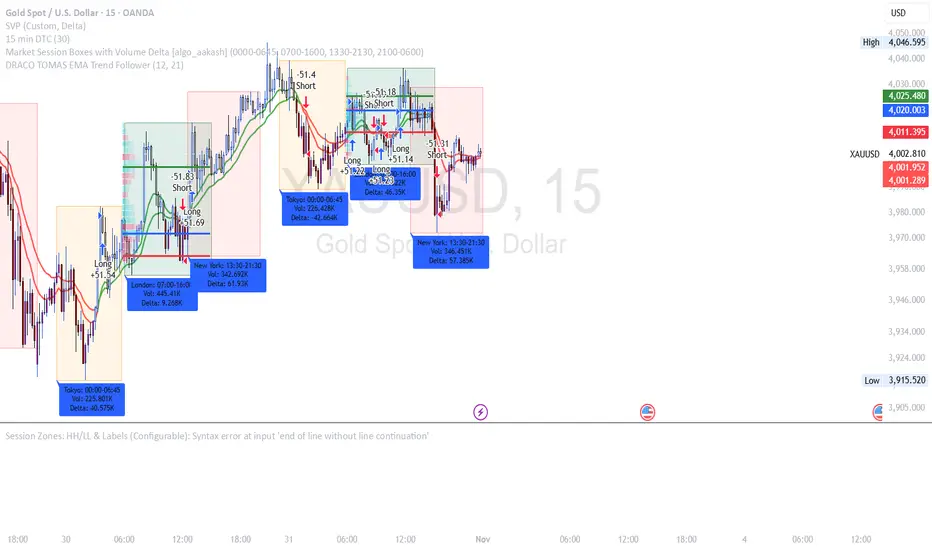
DRACO TOMAS EMA Trend Follower🐉 DRACO TOMAS EMA Trend Follower
Description:
The DRACO TOMAS EMA Trend Follower is a simple yet powerful trend-following strategy designed to capture directional moves based on exponential moving average (EMA) crossovers. It automatically detects trend changes and manages positions dynamically.
Core Logic:
The strategy uses two EMAs — a Fast EMA (default 12) and a Slow EMA (default 21) — to identify the market trend.
When the Fast EMA crosses above the Slow EMA, the strategy opens a long position, signaling bullish momentum.
When the Fast EMA crosses below the Slow EMA, the strategy opens a short position, signaling bearish momentum.
The color of the EMAs changes dynamically: green for uptrends, red for downtrends.
Exit rules:
Longs are closed when the EMAs turn red (trend reversal to bearish).
Shorts are closed when the EMAs turn green (trend reversal to bullish).
Position Sizing:
The system uses 10% of equity per trade by default, allowing flexible risk management and compounding.
Purpose:
Designed for traders who want a clean and efficient EMA crossover system to follow trends automatically on any timeframe or asset.
Best Used For:
Swing trading and trend confirmation
Identifying major directional shifts
Testing EMA-based momentum systems
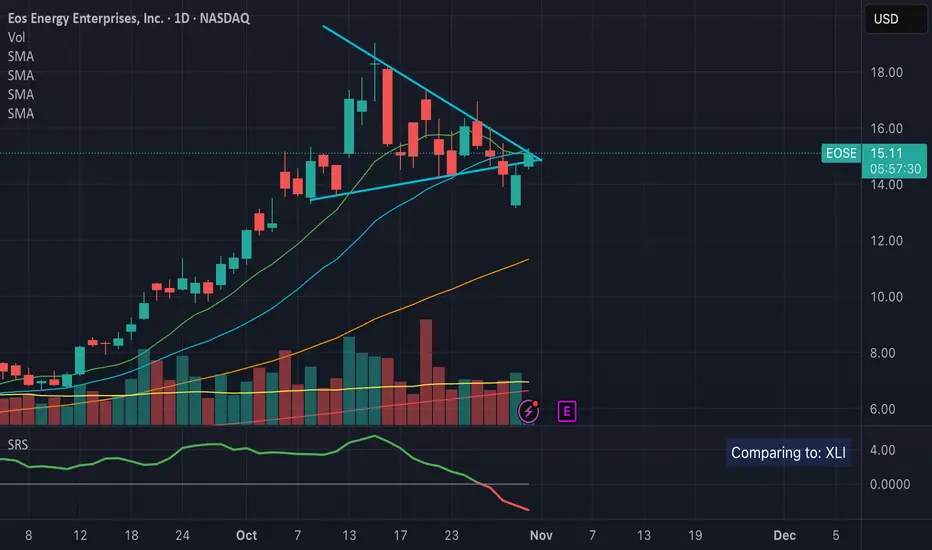
Sector Relative StrengthThis indicator measures a stock's Real Relative Strength against its sector benchmark, helping you identify stocks that are outperforming or underperforming their sector peers.
The concept is based on the Real Relative Strength methodology popularized by the r/realdaytrading community.
Unlike traditional relative strength calculations that simply compare price ratios, this indicator uses a more sophisticated approach that accounts for volatility through ATR (Average True Range), providing a normalized view of true relative performance.
Key Features
Automatic Sector Detection
Automatically detects your stock's sector using TradingView's built-in sector classification
Maps to the appropriate SPDR Sector ETF (XLK, XLF, XLV, XLY, XLP, XLI, XLE, XLU, XLB, XLC)
Supports all 20 TradingView sectors
Sector ETF Mappings
The indicator automatically compares your stock against:
Technology: XLK (Technology Services, Electronic Technology)
Financials: XLF (Finance sector)
Healthcare: XLV (Health Technology, Health Services)
Consumer Discretionary: XLY (Retail Trade, Consumer Services, Consumer Durables)
Consumer Staples: XLP (Consumer Non-Durables)
Industrials: XLI (Producer Manufacturing, Industrial Services, Transportation, Commercial Services)
Energy: XLE (Energy Minerals)
Utilities: XLU
Materials: XLB (Non-Energy Minerals, Process Industries)
Communications: XLC
Default: SPY (for Miscellaneous or unclassified sectors)
Customizable Settings
Comparison Mode: Choose between automatic sector comparison or custom symbol
Length: Adjustable lookback period (default: 12)
Smoothing: Apply moving average to reduce noise (default: 3)
Visual Clarity
Green line: Stock is outperforming its sector
Red line: Stock is underperforming its sector
Zero baseline: Clear reference point for performance
Clean info box: Shows which ETF you're comparing against
How It Works
The indicator calculates relative strength using the following methodology:
Rolling Price Change: Measures the price movement over the specified length for both the stock and its sector ETF
ATR Normalization: Uses Average True Range to normalize for volatility differences
Power Index: Calculates the sector's strength relative to its volatility
Real Relative Strength: Compares the stock's performance against the sector's power index
Smoothing: Applies a moving average to reduce single-candle spikes
Formula:
Power Index = (Sector Price Change) / (Sector ATR)
RRS = (Stock Price Change - Power Index × Stock ATR) / Stock ATR
Smoothed RRS = SMA(RRS, Smoothing Length)
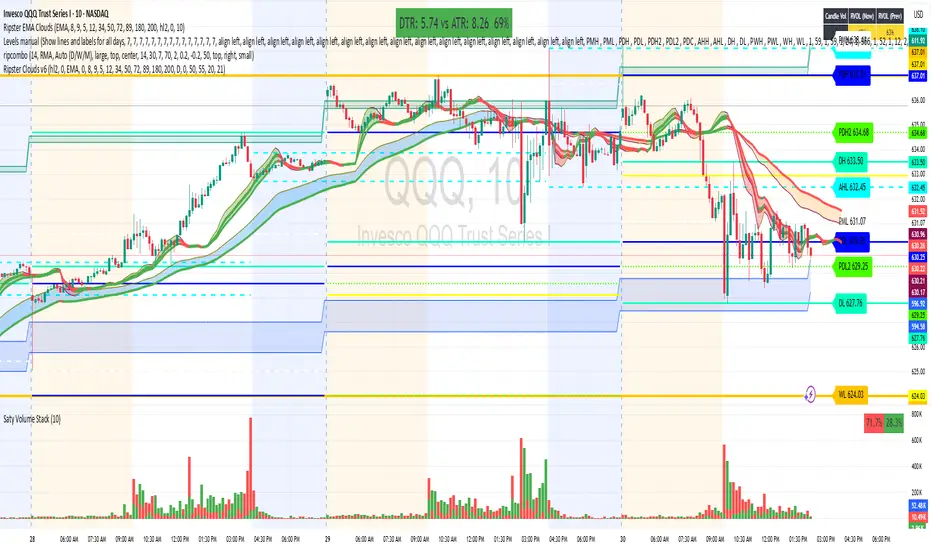
Ripster Clouds (EMA + MTF)v6🧠 Purpose
This indicator combines Ripster EMA Clouds and Multi-Timeframe (MTF) EMA Clouds into one script.
It allows you to visualize short vs long exponential (or simple) moving averages as colored “clouds” to identify trend direction and momentum — across both your current timeframe and a higher timeframe (e.g., daily).
⚙️ Main Features
1. EMA Clouds (Local Timeframe)
Up to 5 separate EMA/SMA cloud sets (8/9, 5/12, 34/50, 72/89, 180/200 by default).
Each can be individually enabled/disabled in the settings.
MA type toggle → Choose between EMA and SMA.
Optional line display toggle for showing the short and long MA lines.
Color-coded trend clouds:
Greenish tones = bullish (short > long)
Reddish tones = bearish (short < long)
Configurable leading offset and global offset for alignment.
2. MTF Clouds (Higher Timeframe)
Two sets of higher timeframe EMA clouds (default: 50/55 and 20/21).
Uses request.security() to pull EMA data from a selected higher timeframe (default = Daily).
Optional line visibility toggle (Display Lines).
Blue and teal semi-transparent fills to distinguish from local clouds.
Each MTF cloud can be toggled independently.
3. Unified Controls
Master toggles:
✅ Show EMA Clouds
✅ Show MTF Clouds
Transparent cloud fills with dynamically changing colors based on EMA crossovers and slope.
No local-scope plot() or fill() calls — fully compliant with Pine v6 rules.
🎨 Color Logic
Each EMA cloud uses a unique color pair (5 total).
Cloud color changes dynamically based on whether the short EMA is above or below the long EMA.
Line color changes with slope:
Olive = EMA rising
Maroon = EMA falling
📊 Technical Structure
Written in Pine Script v6.
All plot() and fill() calls are at global scope to prevent compilation errors.
Uses helper functions only for math/color logic.
Performance-optimized for TradingView’s rendering limits.
🧩 Quick Setup in TradingView
Paste the script into the Pine Editor.
Add to chart.
In settings:
Toggle on/off any EMA or MTF clouds.
Adjust timeframe (Resolution), line visibility, or offsets.
Choose EMA or SMA as the base calculation.
✅ Result
You now have one unified, customizable Ripster EMA + MTF Cloud indicator, stable in Pine v6, with complete flexibility to toggle, style, and analyze multiple timeframe trends on a single chart.
DTCC RECAPS Dates 2020-2025This is a simple indicator which marks the RECAPS dates of the DTCC, during the periods of 2020 to 2025.
These dates have marked clear settlement squeezes in the past, such as GME's squeeze of January 2021.
------------------------------------------------------------------------------------------------------------------
The Depository Trust & Clearing Corporation (DTCC) has published the 2025 schedule for its Reconfirmation and Re-pricing Service (RECAPS) through the National Securities Clearing Corporation (NSCC). RECAPS is a monthly process for comparing and re-pricing eligible equities, municipals, corporate bonds, and Unit Investment Trusts (UITs) that have aged two business days or more .
At its core, the Reconfirmation and Re-pricing Service (RECAPS) is a risk management tool used by the National Securities Clearing Corporation (NSCC), a subsidiary of the DTCC. Its primary purpose is to reduce the risks associated with aged, unsettled trades in the U.S. securities market .
When a trade is executed, it is sent to the NSCC for clearing and settlement. However, for various reasons, some trades may not settle on their scheduled date and become "aged." These unsettled trades create risk for both the trading parties and the clearinghouse (NSCC) because the value of the underlying securities can change over time. If a trade fails to settle and one of the parties defaults, the NSCC may have to step in to complete the transaction at the current market price, which could result in a loss.
RECAPS mitigates this risk by systematically re-pricing these aged, open trading obligations to the current market value. This process ensures that the financial obligations of the clearing members accurately reflect the present value of the securities, preventing the accumulation of significant, unmanaged market risk .
Detailed Mechanics: How Does it Work?
The RECAPS process revolves around two key dates you asked about: the RECAPS Date and the Settlement Date .
The RECAPS Date: On this day, the NSCC runs a process to identify all eligible trades that have remained unsettled for two business days or more. These "aged" trades are then re-priced to the current market value. This re-pricing is not just a simple recalculation; it generates new settlement instructions. The original, unsettled trade is effectively cancelled and replaced with a new one at the current market price. This is done through the NSCC's Obligation Warehouse.
The Settlement Date: This is typically the business day following the RECAPS date. On this date, the financial settlement of the re-priced trades occurs. The difference in value between the original trade price and the new, re-priced value is settled between the two trading parties. This "mark-to-market" adjustment is processed through the members' settlement accounts at the DTCC.
Essentially, the process ensures that any gains or losses due to price changes in the underlying security are realized and settled periodically, rather than being deferred until the trade is ultimately settled or cancelled.
Are These Dates Used to Check Margin Requirements?
Yes, indirectly, this process is closely tied to managing margin and collateral requirements for NSCC members. Here’s how:
The NSCC requires its members to post collateral to a clearing fund, which acts as a mutualized guarantee against defaults. The amount of collateral each member must provide is calculated based on their potential risk exposure to the clearinghouse.
By re-pricing aged trades to current market values through RECAPS, the NSCC gets a more accurate picture of each member's outstanding obligations and, therefore, their current risk profile. If a member has a large number of unsettled trades that have moved against them in value, the re-pricing will crystallize that loss, which will be settled the next day.
This regular re-pricing and settlement of aged trades prevent the build-up of large, unrealized losses that could increase a member's risk profile beyond what their posted collateral can cover. While RECAPS is not the only mechanism for calculating margin (the NSCC has a complex system for daily margin calls based on overall portfolio risk), it is a crucial component for managing the specific risk posed by aged, unsettled transactions. It ensures that the value of these obligations is kept current, which in turn helps ensure that collateral levels remain adequate.
--------------------------------------------------------------------------------------------------------------
Future dates of 2025:
- November 12, 2025 (Wed)
- November 25, 2025 (Tue)
- December 11, 2025 (Thu)
- December 29, 2025 (Mon)
The dates for 2026 haven't been published yet at this time.
The RECAPS process is essentially the industry's way of retrying the settlement of all unresolved FTDs, netting outstanding obligations, and gradually forcing resolution (either delivery or buy-in). Monitoring RECAPS cycles is one way to track the lifecycle, accumulation, and eventual resolution (or persistence) of failures to deliver in the U.S. market.
The US Stock market has become a game of settlement dates and FTDs, therefore this can be useful to track.

Lynie's V9 SELL🟢🔴 Lynie’s V8 — BUY & SELL (Mirrored, Interlocking System)
Lynie’s V8 is a paired long/short engine built as two mirrored scripts—Lynie’s V8 BUY and Lynie’s V8 SELL—that read price the same way, flip conditions symmetrically, and manage trades with the exact logic on opposite sides. Use either one standalone or run both together for full two-sided automation of entries, re-entries, caution states, and adaptive SL/TP.
✳️ What “mirrored” means here
Supertrend Tri-Stack (10/11/12):
BUY: ST10 primary pierce; ST12 fallback; “PAG Buy” when price pierces any ST while above the other two.
SELL: Exact inverse—ST10 primary pierce down; ST12 fallback; “PAG Sell” when price pierces any ST while below the other two.
Re-Enter Clusters:
BUY: Ratcheted up (Heikin-Ashi green holds/tightens).
SELL: Ratcheted down (Heikin-Ashi red holds/tightens).
Both sides use the same cluster age/decay math, care penalties, session awareness, and fast-candle tightening.
Care Flags (context risk):
Ichimoku, MACD, RSI combine into single and paired flags that tighten or widen offsets on both sides with the same scoring.
VWAP–EMA50 (5m) cluster gate:
Identical distance checks for BUY/SELL. When the mean cluster is present, offsets and labels adapt (tighter/“riskier scalp” messaging).
Golden Pocket A/B/C (prev-day):
Same fib boxes & labeling (gold tone) on both sides to call out TP-friendly zones.
SL/TP Envelope:
Shared dynamic engine: per-bar decay, fast-candle expansion, and care-based compress/relax—all mirrored for up/down.
Caution Labels:
BUY side prints CAUTION SELL if HA flips red inside an active long cluster.
SELL side prints CAUTION BUY if HA flips green inside an active short cluster.
Same latching & auto-release behavior.
🧠 Core workflow (both sides)
Primary trigger via ST10 pierce (structure shift) with an ST12 fallback when ST10 didn’t qualify.
PAG Mode when price is already on the right side of the other two STs—strongest conviction.
Cluster phase begins after a signal: ratcheted re-entry level, session-aware offsets, dynamic tightening on fast bars.
Care system shapes every re-entry & SL/TP label (Ichi/MACD/RSI combos + VWAP/EMA gate + QQE).
Protective layer: SL-wick and SL-body logic, caution flips, and “hold 1 bar” cluster carry after SL to avoid whipsaw spam.
🔎 Labels & messages (shared vocabulary)
Lynie’s / Lynie’s+ / Lynie’s++ — strength tiers (ST12 involvement & clean context).
Re-Enter / Excellent Re-Enter — cluster pullback quality; ratchet shows the “must-hold” zone.
SL&TP (n) — live offset multiplier the engine is using right now.
CAUTION BUY / CAUTION SELL — HA flip against the active side inside the cluster.
Restart Next Candle — visual cue to re-arm after a confirmed signal bar.
⚡ Why run both together
Continuity: When a long cycle ends (SL or caution degradation), the SELL engine is already tracking the inverse without re-tuning.
Symmetry: Same math, same signals, opposite direction—no hidden biases.
Coverage: Trend hand-offs are cleaner; you don’t miss early shorts after a long fade (and vice versa).
🔧 Recommended usage
Intraday futures (ES/NQ) or any liquid market.
Keep the VWAP–EMA cluster ON; it filters FOMO chases.
Honor Caution flips inside cluster—scale down or wait for the next clean re-enter.
Treat Golden Zones as TP magnets, not guaranteed reversals.
📌 Notes
Both scripts are Pine v6 and independent. Load BUY and SELL together for the full experience.
All offsets (re-enter & SL/TP) are visible in labels—so you always know why a zone is where it is.
Alerts are provided for signals, re-enter hits, caution, and SL events on both sides.
Summary: Lynie’s V8 BUY & SELL are vice-versa twins—one framework, two directions—delivering consistent entries, adaptive re-entries, and contextual risk management whether the market is pressing up or breaking down.
[AS] MACD-v & Hist [Alex Spiroglou | S.M.A.R.T. TRADER SYSTEMS] MACD-v & MACD-v Histogram
=======================================
Volatility Normalised Momentum 📈
Twice Awarded Indicator 🏆
=======================================
=======================================
✅ 1. INTRODUCTION TO THE MACD-v ✅
=======================================
I created the MACD-v in 2015,
as a way to deal with the limitations
of well known indicators like the Stochastic, RSI, MACD.
I decided to publicly share a very small part of my research
in the form of a research paper I wrote in 2022,
titled "MACD-v: Volatility Normalised Momentum".
That paper was awarded twice:
1. The "Charles H. Dow" Award (2022),
for outstanding research in Technical Analysis,
by the Chartered Market Technicians Association (CMTA)
2. The "Founders" Award (2022),
for advances in Active Investment Management,
by the National Association of Active Investment Managers (NAAIM)
=======================================
===================================================
❌ 2. WHY CREATE THE MACD-v ?
THE LIMITATIONS OF CONVENTIONAL MOMENTUM INDICATORS
====================================================
Technical Analysis indicators focused on momentum,
come in two general categories,
each with its own set of limitations:
(i) Range Bound Oscillators (RSI, Stochastics, etc)
These usually have a scaling of 0-100,
and thus have the advantage of having normalised readings,
that are comparable across time and securities.
However they have the following limitations (among others):
1. Skewing effect of steep trends
2. Indicator values do not adjust with and reflect true momentum
(indicator values are capped to 100)
(ii) Unbound Oscillators (MACD, RoC, etc)
These are boundless indicators,
and can expand with the market,
without being limited by a 0-100 scaling,
and thus have the advantage of really measuring momentum.
They have the main following limitations (among others):
1. Subjectivity of overbought / oversold levels
2. Not comparable across time
3. Not comparable across securities
=======================================
=======================================
💡 3. THE SOLUTION TO SOLVE THESE LIMITATIONS
=======================================
In order to deal with these limitations,
I decided to create an indicator,
that would be the "Best of two worlds".
A unique & hybrid indicator,
that would have objective normalised readings
(similar to Range Bound Oscillators - RSI)
but would also be able to have no upper/lower boundaries
(similar to Unbound Oscillators - MACD).
This would be achieved by "normalising" a boundless oscillator (MACD)
=======================================
==================================================
⛔ 4. DEEP DIVE INTO THE 5 LIMITATIONS OF THE MACD
==================================================
A Bloomberg study found that the MACD
is the most popular indicator after the RSI,
but the MACD has 5 BIG limitations.
Limitation 1: MACD values are not comparable across Time
The raw MACD values shift
as the underlying security's absolute value changes across time,
making historical comparisons obsolete
e.g S&P 500 maximum MACD was 1.56 in 1957-1971,
but reached 86.31 in 2019-2021 - not indicating 55x stronger momentum,
but simply different price levels.
Limitation 2: MACD values are not comparable across Assets
Traditional MACD cannot compare momentum between different assets.
S&P 500 MACD of 65 versus EUR/USD MACD of -0.5
reflects absolute price differences, not momentum differences
Limitation 3: MACD values cannot be Systematically Classified
Due to limitations #1 & #2, it is not possible to create
a momentum level classification scale
where one can define "fast", "slow", "overbought", "oversold" momentum
making systematic analysis impossible
Limitation 4: MACD Signal Line gives false crossovers in low-momentum ranges
In range-bound, low momentum environments,
most of the MACD signal line crossovers are false (noise)
Since there is no objective momentum classification system (limitation #3),
it is not possible to filter these signals out,
by avoiding them when momentum is low
Limitation 5: MACD Signal Line gives late crossovers in high momentum regimes.
Signal lag in strong trends not good at timing the turning point
— In high-momentum moves, MACD crossovers may come late.
Since there is no objective momentum classification system (limitation #3),
it is not possible to filter these signals out,
by avoiding them when momentum is high
===================================================================
===================================================================
🏆 5. MACD-v : THE SOLUTION TO THE LIMITATIONS OF THE MACD , RSI, etc
====================================================================
MACD-v is a volatility normalised momentum indicator.
It remedies these 5 limitations of the classic MACD,
while creating a tool with unique properties.
Formula: × 100
MACD-V enhances the classic MACD by normalizing for volatility,
transforming price-dependent readings into standardized momentum values.
This resolves key limitations of traditional MACD and adds significant analytical power.
Core Advantages of MACD-V
Advantage 1: Time-Based Stability
MACD-V values are consistent and comparable over time.
A reading of 100 has the same meaning today as it did in the past
(unlike traditional MACD which is influenced by changes in price and volatility over time)
Advantage 2: Cross-Market Comparability
MACD-V provides universal scaling.
Readings (e.g., ±50) apply consistently across all asset classes—stocks,
bonds, commodities, or currencies,
allowing traders to compare momentum across markets reliably.
Advantage 3: Objective Momentum Classification
MACD-V includes a defined 5-range momentum lifecycle
with standardized thresholds (e.g., -150 to +150).
This offers an objective framework for analyzing market conditions
and supports integration with broader models.
Advantage 4: False Signal Reduction in Low-Momentum Regimes
MACD-V introduces a "neutral zone" (typically -50 to +50)
to filter out these low-probability signals.
Advantage 5: Improved Signal Timing in High-Momentum Regimes
MACD-V identifies extremely strong trends,
allowing for more precise entry and exit points.
Advantage 6: Trend-Adaptive Scaling
Unlike bounded oscillators like RSI or Stochastic,
MACD-V dynamically expands with trend strength,
providing clearer momentum insights without artificial limits.
Advantage 7: Enhanced Divergence Detection
MACD-V offers more reliable divergence signals
by avoiding distortion at extreme levels,
a common flaw in bounded indicators (RSI, etc)
====================================================================
=======================================
⚒️ 5. HOW TO USE THE MACD-v: 7 CORE PATTERNS
HOW TO USE THE MACD-v Histogram: 2 CORE PATTERNS
=======================================
>>>>>> BASIC USE (RANGE RULES) <<<<<<
The MACD-v has 7 Core Patterns (Ranges) :
1. Risk Range (Overbought)
Condition: MACD-V > Signal Line and MACD-V > +150
Interpretation: Extremely strong bullish momentum—potential exhaustion or reversal zone.
2. Retracing
Condition: MACD-V < Signal Line and MACD-V > -50
Interpretation: Mild pullback within a bullish trend.
3. Rundown
Condition: MACD-V < Signal Line and -50 > MACD-V > -150
Interpretation: Momentum is weakening—bearish pressure building.
4. Risk Range (Oversold)
Condition: MACD-V < Signal Line and MACD-V < -150
Interpretation: Extreme bearish momentum—potential for reversal or capitulation.
5. Rebounding
Condition: MACD-V > Signal Line and MACD-V > -150
Interpretation: Bullish recovery from oversold or weak conditions.
6. Rallying
Condition: MACD-V > Signal Line and MACD-V > +50
Interpretation: Strengthening bullish trend—momentum accelerating.
7. Ranging (Neutral Zone)
Condition: MACD-V remains between -50 and +50 for 20+ bars
Interpretation: Sideways market—low conviction and momentum.
The MACD-v Histogram has 2 Core Patterns (Ranges) :
1. Risk (Overbought)
Condition: Histogram > +40
Interpretation: Short-term bullish momentum is stretched—possible overextension or reversal risk.
2. Risk (Oversold)
Condition: Histogram < -40
Interpretation: Short-term bearish momentum is stretched—potential for rebound or reversal.
=======================================
=======================================
📈 6. ADVANCED PATTERNS WITH MACD-v
=======================================
Thanks to its volatility normalization,
the MACD-V framework enables the development
of a wide range of advanced pattern recognition setups,
trading signals, and strategic models.
These patterns go beyond basic crossovers,
offering deeper insight into momentum structure,
regime shifts, and high-probability trade setups.
These are not part of this script
=======================================
===========================================================
⚙️ 7. FUNCTIONALITY - HOW TO ADD THE INDICATORS TO YOUR CHART
===========================================================
The script allows you to see :
1. MACD-v
The indicator with the ranges (150,50,0,-50,-150)
and colour coded according to its 7 basic patterns
2. MACD-v Histogram
The indicator The indicator with the ranges (40,0,-40)
and colour coded according to its 2 basic ranges / patterns
3. MACD-v Heatmap
You can see the MACD-v in a Multiple Timeframe basis,
using a colour-coded Heatmap
Note that lowest timeframe in the heatmap must be the one on the chart
i.e. if you see the daily chart, then the Heatmap will be Daily, Weekly, Monthly
4. MACD-v Dashboard
You can see the MACD-v for 7 markets,
in a multiple timeframe basis
=======================================
=======================================
🤝 CONTRIBUTIONS 🤝
=======================================
I would like to thank the following people:
1. Mike Christensen for coding the indicator
@TradersPostInc, @Mik3Christ3ns3n,
2. @Indicator-Jones For allowing me to use his Scanner
3. @Daveatt For allowing me to use his heatmap
=======================================
=======================================
⚠️ LEGAL - Usage and Attribution Notice ⚠️
=======================================
Use of this Script is permitted
for personal or non-commercial purposes,
including implementation by coders and TradingView users.
However, any form of paid redistribution,
resale, or commercial exploitation is strictly prohibited.
Proper attribution to the original author is expected and appreciated,
in order to acknowledge the source
and maintain the integrity of the original work.
Failure to comply with these terms,
or to take corrective action within 48 hours of notification,
will result in a formal report to TradingView’s moderation team,
and will actively pursue account suspension and removal of the infringing script(s).
Continued violations may result in further legal action, as deemed necessary.
=======================================
=======================================
⚠️ DISCLAIMER ⚠️
=======================================
This indicator is For Educational Purposes Only (F.E.P.O.).
I am just Teaching by Example (T.B.E.)
It does not constitute investment advice.
There are no guarantees in trading - except one.
You will have losses in trading.
I can guarantee you that with 100% certainty.
The author is not responsible for any financial losses
or trading decisions made based on this indicator. 🙏
Always perform your own analysis and use proper risk management. 🛡️
=======================================

FVG MagicFVG Magic — Fair Value Gaps with Smart Mitigation, Inversion & Auto-Clean-up
FVG Magic finds every tradable Fair Value Gap (FVG), shows who powered it, and then manages each gap intelligently as price interacts with it—so your chart stays actionable and clean.
Attribution
This tool is inspired by the idea popularized in “Volumatic Fair Value Gaps ” by BigBeluga (licensed CC BY-NC-SA 4.0). Credit to BigBeluga for advancing FVG visualization in the community.
Important: This is a from-scratch implementation—no code was copied from the original. I expanded the concept substantially with a different detection stack, a gap state machine (ACTIVE → 50% SQ → MITIGATED → INVERSED), auto-clean up rules, lookback/nearest-per-side pruning, zoom-proof volume meters, and timeframe auto-tuning for 15m/H1/H4.
What makes this version more accurate
Full-coverage detection (no “missed” gaps)
Default ICT-minimal rule (Bullish: low > high , Bearish: high < low ) catches all valid 3-candle FVGs.
Optional Strict filter (stricter structure checks) for traders who prefer only “clean” gaps.
Optional size percentile filter—off by default so nothing is hidden unless you choose to filter.
Correct handling of confirmations (wick vs close)
Mitigation Source is user-selectable: high/low (wick-based) or close (strict).
This avoids false “misses” when you expect wick confirmations (50% or full fill) but your logic required closes.
State-aware labelling to prevent misleading data
The Bull%/Bear% meter is shown only while a gap is ACTIVE.
As soon as a gap is 50% SQ, MITIGATED, or INVERSED, the meter is hidden and replaced with a clear tag—so you never read stale participation stats.
Robust zoom behaviour
The meter uses a fixed bar-width (not pixels), so it stays proportional and readable at any zoom level.
Deterministic lifecycle (no stale boxes)
Remove on 50% SQ (instant or delayed).
Inversion window after first entry: if price enters but doesn’t invert within N bars, the box auto-removes once fully filled.
Inversion clean up: after a confirmed flip, keep for N bars (context) then delete (or 0 = immediate).
Result: charts auto-maintain themselves and never “lie” about relevance.
Clarity near current price
Nearest-per-side (keep N closest bullish & bearish gaps by distance to the midpoint) focuses attention where it matters without altering detection accuracy.
Lookback (bars) ensures reproducible behaviour across accounts with different data history.
Timeframe-aware defaults
Sensible auto-tuning for 15m / H1 / H4 (right-extension length, meter width, inversion windows, clean up bars) to reduce setup friction and improve consistency.
What it does (under the hood)
Detects FVGs using ICT-minimal (default) or a stricter rule.
Samples volume from a 10× lower timeframe to split participation into Bull % / Bear % (sum = 100%).
Manages each gap through a state machine:
ACTIVE → 50% SQ (midline) → MITIGATED (full) → INVERSED (SR flip after fill).
Auto-clean up keeps only relevant levels, per your rules.
Dashboard (top-right) displays counts by side and the active state tags.
How to use it
First run (show everything)
Use Strict FVG Filter: OFF
Enable Size Filter (percentile): OFF
Mitigation Source: high/low (wick-based) or close (stricter), as you prefer.
Remove on 50% SQ: ON, Delay: 0
Read the context
While ACTIVE, use the Bull%/Bear% meter to gauge demand/supply behind the impulse that created the gap.
Confluence with your HTF structure, sessions, VWAP, OB/FVG, RSI/MACD, etc.
Trade interactions
50% SQ: often the highest-quality interaction; if removal is ON, the box clears = “job done.”
Full mitigation then rejection through the other side → tag changes to INVERSED (acts like SR). Keep for N bars, then auto-remove.
Keep the chart tidy (optional)
If too busy, enable Size Filter or set Nearest per side to 2–4.
Use Lookback (bars) to make behaviour consistent across symbols and histories.
Inputs (key ones)
Use Strict FVG Filter: OFF(default)/ON
Enable Size Filter (percentile): OFF(default)/ON + threshold
Mitigation Source: high/low or close
Remove on 50% SQ + Delay
Inversion window after entry (bars)
Remove inversed after (bars)
Lookback (bars), Nearest per side (N)
Right Extension Bars, Max FVGs, Meter width (bars)
Colours: Bullish, Bearish, Inversed fill
Suggested defaults (per TF)
15m: Extension 50, Max 12, Inversion window 8, Clean up 8, Meter width 20
H1: Extension 25, Max 10, Inversion window 6, Clean up 6, Meter width 15
H4: Extension 15, Max 8, Inversion window 5, Clean up 5, Meter width 10
Notes & edge cases
If a wick hits 50% or the far edge but state doesn’t change, you’re likely on close mode—switch to high/low for wick-based behaviour.
If a gap disappears, it likely met a clean up condition (50% removal, inversion window, inversion clean up, nearest-per-side, lookback, or max-cap).
Meters are hidden after ACTIVE to avoid stale percentages.

cd_correlation_analys_Cxcd_correlation_analys_Cx
General:
This indicator is designed for correlation analysis by classifying stocks (487 in total) and indices (14 in total) traded on Borsa İstanbul (BIST) on a sectoral basis.
Tradingview's sector classifications (20) have been strictly adhered to for sector grouping.
Depending on user preference, the analysis can be performed within sectors, between sectors, or manually (single asset).
Let me express my gratitude to the code author, @fikira, beforehand; you will find the reason for my thanks in the context.
Details:
First, let's briefly mention how this indicator could have been prepared using the classic method before going into details.
Classically, assets could be divided into groups of forty (40), and the analysis could be performed using the built-in function:
ta.correlation(source1, source2, length) → series float.
I chose sectoral classification because I believe there would be a higher probability of assets moving together, rather than using fixed-number classes.
In this case, 21 arrays were formed with the following number of elements:
(3, 11, 21, 60, 29, 20, 12, 3, 31, 5, 10, 11, 6, 48, 73, 62, 16, 19, 13, 34 and indices (14)).
However, you might have noticed that some arrays have more than 40 elements. This is exactly where @Fikira's indicator came to the rescue. When I examined their excellent indicator, I saw that it could process 120 assets in a single operation. (I believe this was the first limit overrun; thanks again.)
It was amazing to see that data for 3 pairs could be called in a single request using a special method.
You can find the details here:
When I adapted it for BIST, I found it sufficient to call data for 2 pairs instead of 3 in a single go. Since asset prices are regular and have 2 decimal places, I used a fixed multiplier of $10^8$ and a fixed decimal count of 2 in Fikira's formulas.
With this method, the (high, low, open, close) values became accessible for each asset.
The summary up to this point is that instead of the ready-made formula + groups of 40, I used variable-sized groups and the method I will detail now.
Correlation/harmony/co-movement between assets provides advantages to market participants. Coherent assets are expected to rise or fall simultaneously.
Therefore, to convert co-movement into a mathematical value, I defined the possible movements of the current candle relative to the previous candle bar over a certain period (user-defined). These are:
Up := high > high and low > low
Down := high < high and low < low
Inside := high <= high and low >= low
Outside := high >= high and low <= low and NOT Inside.
Ignore := high = low = open = close
If both assets performed the same movement, 1 was added to the tracking counter.
If (Up-Up), (Down-Down), (Inside-Inside), or (Outside-Outside), then counter := counter + 1.
If the period length is 100 and the counter is 75, it means there is 75% co-movement.
Corr = counter / period ($75/100$)
Average = ta.sma(Corr, 100) is obtained.
The highest coefficients recorded in the array are presented to the user in a table.
From the user menu options, the user can choose to compare:
• With assets in its own sector
• With assets in the selected sector
• By activating the confirmation box and manually entering a single asset for comparison.
Table display options can be adjusted from the Settings tab.
In the attached examples:
Results for AKBNK stock from the Finance sector compared with GARAN stock from the same sector:
Timeframe: Daily, Period: 50 => Harmony 76% (They performed the same movement in 38 out of 50 bars)
Comment: Opposite movements at swing high and low levels may indicate a change in the direction of the price flow (SMT).
Looking at ASELS from the Electronic Technology sector over the last 30 daily candles, they performed the same movements by 40% with XU100, 73.3% (22/30) with XUTEK (Technology Index), and 86.9% according to the averages.
Comment: It is more appropriate to follow ASELS stock with XUTEK (Technology index) instead of the general index (XU100). Opposite movements at swing high and low levels may indicate a change in the direction of the price flow (SMT).
Again, when ASELS stock is taken on H1 instead of daily, and the length is 100 instead of 30, the harmony rate is seen to be 87%.
Please share your thoughts and criticisms regarding the indicator, which I prepared with a bit of an educational purpose specifically for BIST.
Happy trading.

Ultimate Oscillator (ULTOSC)The Ultimate Oscillator (ULTOSC) is a technical momentum indicator developed by Larry Williams that combines three different time periods to reduce the volatility and false signals common in single-period oscillators. By using a weighted average of three Stochastic-like calculations across short, medium, and long-term periods, the Ultimate Oscillator provides a more comprehensive view of market momentum while maintaining sensitivity to price changes.
The indicator addresses the common problem of oscillators being either too sensitive (generating many false signals) or too slow (missing opportunities). By incorporating multiple timeframes with decreasing weights for longer periods, ULTOSC attempts to capture both short-term momentum shifts and longer-term trend strength, making it particularly valuable for identifying divergences and potential reversal points.
## Core Concepts
* **Multi-timeframe analysis:** Combines three different periods (typically 7, 14, 28) to capture various momentum cycles
* **Weighted averaging:** Assigns higher weights to shorter periods for responsiveness while including longer periods for stability
* **Buying pressure focus:** Measures the relationship between closing price and the true range rather than just high-low range
* **Divergence detection:** Particularly effective at identifying momentum divergences that precede price reversals
* **Normalized scale:** Oscillates between 0 and 100, with clear overbought/oversold levels
## Common Settings and Parameters
| Parameter | Default | Function | When to Adjust |
|-----------|---------|----------|---------------|
| Fast Period | 7 | Short-term momentum calculation | Lower (5-6) for more sensitivity, higher (9-12) for smoother signals |
| Medium Period | 14 | Medium-term momentum calculation | Adjust based on typical swing duration in the market |
| Slow Period | 28 | Long-term momentum calculation | Higher values (35-42) for longer-term position trading |
| Fast Weight | 4.0 | Weight applied to fast period | Higher weight increases short-term sensitivity |
| Medium Weight | 2.0 | Weight applied to medium period | Adjust to balance medium-term influence |
| Slow Weight | 1.0 | Weight applied to slow period | Usually kept at 1.0 as the baseline weight |
**Pro Tip:** The classic 7/14/28 periods with 4/2/1 weights work well for most markets, but consider using 5/10/20 with adjusted weights for faster markets or 14/28/56 for longer-term analysis.
## Calculation and Mathematical Foundation
**Simplified explanation:**
The Ultimate Oscillator calculates three separate "buying pressure" ratios using different time periods, then combines them using weighted averaging. Buying pressure is defined as the close minus the true low, divided by the true range.
**Technical formula:**
```
BP = Close - Min(Low, Previous Close)
TR = Max(High, Previous Close) - Min(Low, Previous Close)
BP_Sum_Fast = Sum(BP, Fast Period)
TR_Sum_Fast = Sum(TR, Fast Period)
Raw_Fast = 100 × (BP_Sum_Fast / TR_Sum_Fast)
BP_Sum_Medium = Sum(BP, Medium Period)
TR_Sum_Medium = Sum(TR, Medium Period)
Raw_Medium = 100 × (BP_Sum_Medium / TR_Sum_Medium)
BP_Sum_Slow = Sum(BP, Slow Period)
TR_Sum_Slow = Sum(TR, Slow Period)
Raw_Slow = 100 × (BP_Sum_Slow / TR_Sum_Slow)
ULTOSC = 100 × / (Fast_Weight + Medium_Weight + Slow_Weight)
```
Where:
- BP = Buying Pressure
- TR = True Range
- Fast Period = 7, Medium Period = 14, Slow Period = 28 (defaults)
- Fast Weight = 4, Medium Weight = 2, Slow Weight = 1 (defaults)
> 🔍 **Technical Note:** The implementation uses efficient circular buffers for all three period calculations, maintaining O(1) time complexity per bar. The algorithm properly handles true range calculations including gaps and ensures accurate buying pressure measurements across all timeframes.
## Interpretation Details
ULTOSC provides several analytical perspectives:
* **Overbought/Oversold conditions:** Values above 70 suggest overbought conditions, below 30 suggest oversold conditions
* **Momentum direction:** Rising ULTOSC indicates increasing buying pressure, falling indicates increasing selling pressure
* **Divergence analysis:** Divergences between ULTOSC and price often precede significant reversals
* **Trend confirmation:** ULTOSC direction can confirm or question the prevailing price trend
* **Signal quality:** Extreme readings (>80 or <20) indicate strong momentum that may be unsustainable
* **Multiple timeframe consensus:** When all three underlying periods agree, signals are typically more reliable
## Trading Applications
**Primary Uses:**
- **Divergence trading:** Identify when momentum diverges from price for reversal signals
- **Overbought/oversold identification:** Find potential entry/exit points at extreme levels
- **Trend confirmation:** Validate breakouts and trend continuations
- **Momentum analysis:** Assess the strength of current price movements
**Advanced Strategies:**
- **Multi-divergence confirmation:** Look for divergences across multiple timeframes
- **Momentum breakouts:** Trade when ULTOSC breaks above/below key levels with volume
- **Swing trading entries:** Use oversold/overbought levels for swing position entries
- **Trend strength assessment:** Evaluate trend quality using momentum consistency
## Signal Combinations
**Strong Bullish Signals:**
- ULTOSC rises from oversold territory (<30) with positive price divergence
- ULTOSC breaks above 50 after forming a base near 30
- All three underlying periods show increasing buying pressure
**Strong Bearish Signals:**
- ULTOSC falls from overbought territory (>70) with negative price divergence
- ULTOSC breaks below 50 after forming a top near 70
- All three underlying periods show decreasing buying pressure
**Divergence Signals:**
- **Bullish divergence:** Price makes lower lows while ULTOSC makes higher lows
- **Bearish divergence:** Price makes higher highs while ULTOSC makes lower highs
- **Hidden bullish divergence:** Price makes higher lows while ULTOSC makes lower lows (trend continuation)
- **Hidden bearish divergence:** Price makes lower highs while ULTOSC makes higher highs (trend continuation)
## Comparison with Related Oscillators
| Indicator | Periods | Focus | Best Use Case |
|-----------|---------|-------|---------------|
| **Ultimate Oscillator** | 3 periods | Buying pressure | Divergence detection |
| **Stochastic** | 1-2 periods | Price position | Overbought/oversold |
| **RSI** | 1 period | Price momentum | Momentum analysis |
| **Williams %R** | 1 period | Price position | Short-term signals |
## Advanced Configurations
**Fast Trading Setup:**
- Fast: 5, Medium: 10, Slow: 20
- Weights: 4/2/1, Thresholds: 75/25
**Standard Setup:**
- Fast: 7, Medium: 14, Slow: 28
- Weights: 4/2/1, Thresholds: 70/30
**Conservative Setup:**
- Fast: 14, Medium: 28, Slow: 56
- Weights: 3/2/1, Thresholds: 65/35
**Divergence Focused:**
- Fast: 7, Medium: 14, Slow: 28
- Weights: 2/2/2, Thresholds: 70/30
## Market-Specific Adjustments
**Volatile Markets:**
- Use longer periods (10/20/40) to reduce noise
- Consider higher threshold levels (75/25)
- Focus on extreme readings for signal quality
**Trending Markets:**
- Emphasize divergence analysis over absolute levels
- Look for momentum confirmation rather than reversal signals
- Use hidden divergences for trend continuation
**Range-Bound Markets:**
- Standard overbought/oversold levels work well
- Trade reversals from extreme levels
- Combine with support/resistance analysis
## Limitations and Considerations
* **Lagging component:** Contains inherent lag due to multiple moving average calculations
* **Complex calculation:** More computationally intensive than single-period oscillators
* **Parameter sensitivity:** Performance varies significantly with different period/weight combinations
* **Market dependency:** Most effective in trending markets with clear momentum patterns
* **False divergences:** Not all divergences lead to significant price reversals
* **Whipsaw potential:** Can generate conflicting signals in choppy markets
## Best Practices
**Effective Usage:**
- Focus on divergences rather than absolute overbought/oversold levels
- Combine with trend analysis for context
- Use multiple timeframe analysis for confirmation
- Pay attention to the speed of momentum changes
**Common Mistakes:**
- Over-relying on overbought/oversold levels in strong trends
- Ignoring the underlying trend direction
- Using inappropriate period settings for the market being analyzed
- Trading every divergence without additional confirmation
**Signal Enhancement:**
- Combine with volume analysis for confirmation
- Use price action context (support/resistance levels)
- Consider market volatility when setting thresholds
- Look for convergence across multiple momentum indicators
## Historical Context and Development
The Ultimate Oscillator was developed by Larry Williams and introduced in his 1985 article "The Ultimate Oscillator" in Technical Analysis of Stocks and Commodities magazine. Williams designed it to address the limitations of single-period oscillators by:
- Reducing false signals through multi-timeframe analysis
- Maintaining sensitivity to short-term momentum changes
- Providing more reliable divergence signals
- Creating a more robust momentum measurement tool
The indicator has become a standard tool in technical analysis, particularly valued for its divergence detection capabilities and its balanced approach to momentum measurement.
## References
* Williams, L. R. (1985). The Ultimate Oscillator. Technical Analysis of Stocks and Commodities, 3(4).
* Williams, L. R. (1999). Long-Term Secrets to Short-Term Trading. Wiley Trading.

Weighted Moving Average (WMA)This implementation uses O(1) algorithm that eliminates the need to loop through all period values on each bar. It also generates valid WMA values from the first bar and is not returning NA when number of bars is less than period.
## Overview and Purpose
The Weighted Moving Average (WMA) is a technical indicator that applies progressively increasing weights to more recent price data. Emerging in the early 1950s during the formative years of technical analysis, WMA gained significant adoption among professional traders through the 1970s as computational methods became more accessible. The approach was formalized in Robert Colby's 1988 "Encyclopedia of Technical Market Indicators," establishing it as a staple in technical analysis software. Unlike the Simple Moving Average (SMA) which gives equal weight to all prices, WMA assigns greater importance to recent prices, creating a more responsive indicator that reacts faster to price changes while still providing effective noise filtering.
## Core Concepts
* **Linear weighting:** WMA applies progressively increasing weights to more recent price data, creating a recency bias that improves responsiveness
* **Market application:** Particularly effective for identifying trend changes earlier than SMA while maintaining better noise filtering than faster-responding averages like EMA
* **Timeframe flexibility:** Works effectively across all timeframes, with appropriate period adjustments for different trading horizons
The core innovation of WMA is its linear weighting scheme, which strikes a balance between the equal-weight approach of SMA and the exponential decay of EMA. This creates an intuitive and effective compromise that prioritizes recent data while maintaining a finite lookback period, making it particularly valuable for traders seeking to reduce lag without excessive sensitivity to price fluctuations.
## Common Settings and Parameters
| Parameter | Default | Function | When to Adjust |
|-----------|---------|----------|---------------|
| Length | 14 | Controls the lookback period | Increase for smoother signals in volatile markets, decrease for responsiveness |
| Source | close | Price data used for calculation | Consider using hlc3 for a more balanced price representation |
**Pro Tip:** For most trading applications, using a WMA with period N provides better responsiveness than an SMA with the same period, while generating fewer whipsaws than an EMA with comparable responsiveness.
## Calculation and Mathematical Foundation
**Simplified explanation:**
WMA calculates a weighted average of prices where the most recent price receives the highest weight, and each progressively older price receives one unit less weight. For example, in a 5-period WMA, the most recent price gets a weight of 5, the next most recent a weight of 4, and so on, with the oldest price getting a weight of 1.
**Technical formula:**
```
WMA = (P₁ × w₁ + P₂ × w₂ + ... + Pₙ × wₙ) / (w₁ + w₂ + ... + wₙ)
```
Where:
- Linear weights: most recent value has weight = n, second most recent has weight = n-1, etc.
- The sum of weights for a period n is calculated as: n(n+1)/2
- For example, for a 5-period WMA, the sum of weights is 5(5+1)/2 = 15
**O(1) Optimization - Dual Running Sums:**
The key insight is maintaining two running sums:
1. **Unweighted sum (S)**: Simple sum of all values in the window
2. **Weighted sum (W)**: Sum of all weighted values
The recurrence relation for a full window is:
```
W_new = W_old - S_old + (n × P_new)
```
This works because when all weights decrement by 1 (as the window slides), it's mathematically equivalent to subtracting the entire unweighted sum. The implementation:
- **During warmup**: Accumulates both sums as the window fills, computing denominator each bar
- **After warmup**: Uses cached denominator (constant at n(n+1)/2), updates both sums in constant time
- **Performance**: ~8 operations per bar regardless of period, vs ~100+ for naive O(n) implementation
> 🔍 **Technical Note:** Unlike EMA which theoretically considers all historical data (with diminishing influence), WMA has a finite memory, completely dropping prices that fall outside its lookback window. This creates a cleaner break from outdated market conditions. The O(1) optimization achieves 12-25x speedup over naive implementations while maintaining exact mathematical equivalence.
## Interpretation Details
WMA can be used in various trading strategies:
* **Trend identification:** The direction of WMA indicates the prevailing trend with greater responsiveness than SMA
* **Signal generation:** Crossovers between price and WMA generate trade signals earlier than with SMA
* **Support/resistance levels:** WMA can act as dynamic support during uptrends and resistance during downtrends
* **Moving average crossovers:** When a shorter-period WMA crosses above a longer-period WMA, it signals a potential uptrend (and vice versa)
* **Trend strength assessment:** Distance between price and WMA can indicate trend strength
## Limitations and Considerations
* **Market conditions:** Still suboptimal in highly volatile or sideways markets where enhanced responsiveness may generate false signals
* **Lag factor:** While less than SMA, still introduces some lag in signal generation
* **Abrupt window exit:** The oldest price suddenly drops out of calculation when leaving the window, potentially causing small jumps
* **Step changes:** Linear weighting creates discrete steps in influence rather than a smooth decay
* **Complementary tools:** Best used with volume indicators and momentum oscillators for confirmation
## References
* Colby, Robert W. "The Encyclopedia of Technical Market Indicators." McGraw-Hill, 2002
* Murphy, John J. "Technical Analysis of the Financial Markets." New York Institute of Finance, 1999
* Kaufman, Perry J. "Trading Systems and Methods." Wiley, 2013

CCI [Hash Adaptive]Adaptive CCI Pro: Professional Technical Analysis Indicator
The Commodity Channel Index is a momentum oscillator developed by Donald Lambert in 1980. CCI measures the relationship between an asset's price and its statistical average, identifying cyclical turns and overbought/oversold conditions. The indicator oscillates around zero, with values above +100 indicating overbought conditions and values below -100 suggesting oversold conditions.
Standard CCI Formula: (Typical Price - Moving Average) / (0.015 × Mean Deviation)
This indicator transforms the traditional CCI into a sophisticated visual analysis tool through several key enhancements:
Implements dual exponential moving average smoothing to eliminate market noise
Preserves signal integrity while reducing false signals
Adaptive smoothing responds to market volatility conditions
Dynamic Color Visualization System
Continuous gradient transitions from red (bearish momentum) to green (bullish momentum)
Real-time color intensity reflects momentum strength
Eliminates discrete color jumps for fluid visual interpretation
Adaptive Intelligence Features
Dynamic overbought/oversold thresholds adapt to market conditions
Reduces false signals during high volatility periods
Maintains sensitivity during low volatility environments
Momentum Vector Analysis
Incorporates velocity calculations for early trend identification
Crossover detection with momentum confirmation
Advanced signal filtering reduces market noise
Extreme Level Analysis
Values above +100: Strong overbought conditions, potential reversal zones
Values below -100: Strong oversold conditions, potential buying opportunities
Zero-line crossovers: Momentum shift confirmation
Optimization Parameters
CCI Period (Default: 14)
Shorter periods (10-12): Increased sensitivity, more signals
Standard periods (14-20): Balanced responsiveness and reliability
Longer periods (21-30): Reduced noise, stronger signal confirmation
Smoothing Factor (Default: 5)
Lower values (1-3): Maximum responsiveness, suitable for scalping
Medium values (4-6): Balanced approach for swing trading
Higher values (7-10): Institutional-grade smoothness for position trading
Signal Sensitivity (Default: 6)
Conservative (7-10): High-probability signals, reduced frequency
Balanced (5-6): Optimal risk-reward ratio
Aggressive (1-4): Maximum signal generation, requires additional confirmation
Strategic Implementation
Oversold reversals in red zones with momentum confirmation
Zero-line breaks with sustained color transitions
Extreme readings followed by momentum divergence
Risk Management
Use extreme levels (+100/-100) for position sizing decisions
Monitor color intensity for momentum strength assessment
Combine with price action analysis for comprehensive market view
Market Context Application
Trending markets: Focus on momentum direction and extreme readings
Range-bound markets: Utilize overbought/oversold levels for mean reversion
Volatile markets: Increase smoothing parameters and signal sensitivity
Professional Advantages
Instantaneous momentum assessment through color visualization
Reduced cognitive load compared to traditional oscillators
Professional presentation suitable for client reporting
Adaptive Technology
Self-adjusting parameters reduce manual optimization requirements
Consistent performance across varying market conditions
Advanced mathematics eliminate common CCI limitations
The Adaptive CCI Pro represents the evolution of momentum analysis, combining Lambert's foundational CCI concept with modern computational techniques to deliver institutional-grade market intelligence through an intuitive visual interface.
