DR/IDR Candles [LuxAlgo]This indicator displays defining ranges (DR) and implied defining ranges (IDR) constructed from two user set sessions (RDR/ODR) as graphical candles on the chart. The script introduces additional graphical elements to the original DR/IDR concept and as such can be thought as a graphical method in addition to a technical indicator.
Additionally, this script can display various Fibonacci retracements from the constructed DR/IDR if enabled within the settings.
Settings
Regular Session: Enable/disable regular session's DR/IDR alongside setting the session time. By default, 09:30 - 10:30 am.
Overnight Session: Enable/disable overnight session's DR/IDR alongside setting the session time. By default, 03:00 - 04:00 am.
UTC Offset: UTC offset for the time zone, by default -5 (EST)
Retracements
Reverse: Inverts source range upper/lower value for constructing the retracements.
From: Source range used to construct the retracements, by default DR is used.
By default, the 0.5 retracement (average line) is displayed.
Usage
The used sessions are highlighted by a gray background. DRs are highlighted by dashed lines while IDRs are highlighted by solid ones. The maximum/minimum price between each user set session is highlighted by solid wicks.
The color of the DRs/IDRs/wicks are determined by the price position relative to the DR; if price is above the DR maximum, then a blue color is used. If price is below, then an orange color is used, and if price is within the DR range, then a gray color is used.
Additionally, the area of the DR range is used to highlight the number of time price is located within the DR, with a longer background highlighting a higher number of occurrences. This can help highlight if the DR levels were potentially useful as support/resistance.
When price is outside the IDR range, the area between the price and IDR is highlighted, in blue if price is above the IDR, and orange if it is under.
The original author of the DR/IDR concept describes 3 rules using the price position relative to the DR/IDR levels:
1.) If price on the 5-minute timeframe closes above the DR high after 10:30 AM or 04:00 AM then the DR low will likely be the low of the trading session.
2.) If price on the 5-minute timeframe closes below the DR low after 10:30 AM or 04:00 AM then the DR high will likely be the high of the trading session.
3.) If price closes above the IDR high after 10:30 AM or 04:00 AM it is an early indication that the low of the DR will be the low of the day and vice versa.
We can see that the above rules are cases of conditional probabilities.
There is no significant data supporting or regarding any statistical probability of the above rules to be true, which are more than uncertain given the stochastic nature of prices. The lack of precision of these rules is also a concern (time zone dependance, applicable markets, etc...).
Credits
Credits to trader TheMas7er who originally created the DR/IDR concept in November of 2022. This script was derived from his proposed session times & rules for trading.
"收集一只股票30个交易日的成交量、开盘价、最高价和最低价和收盘价"に関するスクリプトを検索

Ichimoku Breakout Kumo SWING TRADER (By Insert Cheese)A simple strategy for long spot or long futures (swing traders) based on a basic method of Ichimoku Kinko Hyo strategies.
The strategy is simple:
- Buy when the price breaks the cloud
- Close the trade when the price closes again inside the cloud.
The parameters that work best on this strategy are 10,30,60,30 and 1 for Senkou-Span A
but you can try classic Ichimoku parameters (9,26,52,26,26) or whatever you want like (7,22,44,22,22), (10,30,60,30,30) and others.
-1D chart
I have removed everything from the interface except the cloud to make it visually more aesthetic :D (but if you want to see all the ichimoku indicator you can put in again into the chart)
I have also added several functions for you to do your own backtesting:
- Date range
- TP AND SL method
- Includes long or short trades
The strategy starts with 500 $ and use 100% for trade to make the power of the compounding :P
Remember that this is for only educational porpouse and you must to do your own research and backtested on your usually market..
I hope you like it enjoy and support this indicator :)
Donate (BEP20) 0xC118f1ffB3ac40875C13B3823C182eA2Af344c6d

RSI Trend Heatmap in Multi TimeframesRSI Trend Heatmap in Multi Timeframes
Description
Sometimes you want to look at the RSI Trend across multiple time frames.
You have to waste time browsing through them.
So we've put together every time frame you want to see in one indicator.
We have 10 layers of RSI Trend heatmap available for you.
You can set the timeframe as you want on the Settings page.
Description of Parameter RSI Setting ** You can change it by setting.
RSI Trend Length : (Default 50)
Source : (Default close)
RSI Sideways Length : (Default 2 = RSI between 48 .. 52)
Description of Parameter RSI Timeframe ** You can change it by setting.
""=None,
"M"=1Month, "2W"=2Weeks, "W"=1Week,
"3D"=3Days, "2D"=2Days, "D"=1Day,
"720"=12Hours, "480"=4Hours, "240"=4Hours, "180"=3Hours, "120"=2Hours,
"60"=60Minutes, "30"=30Minutes, "15"=15Minutes, "5"=5Minutes, "1"=1Minute
Default Configurate of RSI Timeframe (for a time frame of 1 hour to 1 day)
"W"= Timeframe 1 month shown in line 90-100 --> Represent Long Trend of RSI
---------------------------------------
"D2"= Timeframe 2 days shown in line 70-80 --> Represent Trend of RSI
"D"= Timeframe 1 day shown in line 60-70 --> Represent Trend of RSI
---------------------------------------
"240"= Timeframe 3 hours shown in line 40-50 --> Represent Signal Up/Signal Down/Divergence of RSI
"120"= Timeframe 2 hours shown in line 30-40 --> Represent Signal Up/Signal Down/Divergence of RSI
"60"= Timeframe 1 hour shown in line 20-30 --> Represent Signal Up/Signal Down/Divergence of RSI
"30"= Timeframe 30 minutes shown in line 10-20 --> Represent Signal Up/Signal Down/Divergence of RSI
"15"= Timeframe 15 minutes shown in line 00-10 --> Represent Signal Up/Signal Down/Divergence of RSI
Description of Colors
Dark Bule = Extreme Uptrend / Overbought / Bull Market (RSI > 67)
Light Bule = Uptrend (RSI between 50-52 .. 67)
Yellow = Sideways Trend / Trend Reversal (RSI between 48 .. 52) ** You can change it by setting.
Light Red = Downtrend (RSI between 33 .. 48-50)
Dark Red = Extreme Downtrend / Oversold / Bear Market (RSI < 33)
How to use
1. You must first know what the main trend of the RSI is (look at the 60-80 line). If it is red, it is a downtrend. and if it's blue shows that it is an uptrend
2. Throughout the period of the main trend There will always be a reversal of the sub-trend. (Can see from the 0-50 line), but eventually will return to follow the main trend.
3. Unless the sub trend persists for a long time until the main trend changes.

ICT Index Futures Session LinesICT Index Futures Session Lines
Description:
The script is based on one of ICT's concepts on trading Index Futures. The script lays out the daily range from an intraday basis.
Range:
00:00 - New York Midnight
08:30 – New York Open (News events come out)
12:00/13:00 - New York Lunch (No trade time period)
13:30 - (Algorithm)
16:30 - Close
* The open, high and low lines are plotted from 00:00 to 08:30
How To Use:
You will need to check the daily bias. Prior to 8:30 you are to look for previous swing points where liquidity may exist. During the open you want to see if a high or low is taken out, and then wait for an energetic break/displacement for a potential FVG/imbalance retracement entry.
Strategy is for LTF (1 to 15m)
Default time zone is set to America/New_York (UTC New York), so lines will be plotted correctly regardless of user’s local UTC chart setting.

RSI Levels, Multi-TimeframeThe relative strength index (RSI) is a momentum indicator that measures the magnitude of recent price changes to evaluate overbought or oversold conditions. RSI is normally displayed as an oscillator separately from price and can have a reading from 0 to 100. This indicator takes the RSI and plots the 30 & 70 levels onto the price chart so you can see when price is going to meet the 30 or 70 levels. The reason the 30 & 70 levels are important is because many traders (and bots) use those as signals to buy (at 30 RSI) or sell (at 70 RSI). Additionally, this indicator allows you to display not just the RSI levels of your currently viewed timeframe on the chart, but also shows the RSI levels of up to 6 different timeframes on the same chart. This allows you to quickly see if multiple RSI levels are aligning across different timelines, which is an even stronger indication that price is going to change direction when it meets those levels on the chart. There are a lot of nice configuration options, like:
Style customization (color, thickness, size)
Labels on the chart so you can tell which plots are the RSI levels
Optionally display the plot as a horizontal line if all you care about is the RSI level right now
Toggle overbought (RSI 70) or oversold (RSI 30) on/off completely

Hotch v1.02 RSI+Fractals/VWAP Bands/Smoothed Moving Average. In this script the RSI is used the limit number of displayed fractals to only those fractals that are triggered in the RSI Overbought and Oversold areas. This helps keep the chart cleaner looking when combined with other indicators so other icons that are plotted above and below candles are not covered up.
For example if the RSI drops below 30 the next fractal would be displayed.
If the RSI stays below 30 each fractal would be displayed.
If the RSI dips below 30 and returns above 30 before there is a fractal is displayed, the next valid fractal would still be displayed.
With optimization of the RSI values this indicator can be used in confluence with the included VWAP bands and Moving average to find trend reversal entry points for trades. Also recommended is to use a divergence identifying lower indicator as a secondary confirmation of trade entry.
Example of a potential long entry using the displayed chart.
1) RSI under 30
2) Price was recently outside of your chosen VWAP multiple.
3) a fractal was triggered.
Additionaly:
4) Use other indicators or other confluences for a stronger trade signal.
5) Use your preferred method of determining entry price stop loss and take profit.
NOTE: Fractals normally paint two bars behind the current bar. In this code, with the combination of the RSI and Fractal Trigger, the fractal paints an icon on the current bar.

User-Inputed Time Range & FibsGreetings Traders! I have decided to release a few scripts as open-source as I'm sure others can benefit from them and perhaps make them better.(Be sure to check my Profile for the other scripts as well: www.tradingview.com).
This one is called User-Inputed Time Range & Fibs.
The idea behind this script is to record the Range Highs and Lows of a User Defined Period, and plot potential Targets based on either Fibonacci Extensions or a Multiple of the Range Size. I created this originally for use with the US Session Initial Balance(From 9:30-10:30AM EST), however it can be set to any time period.
What is Initial Balance? In simple words, Initial Balance (IB) is the price data, which are formed during the first hour of a trading session. Activity of traders forms the so-called Initial Balance at this time. This concept was introduced for the first time by Peter Steidlmayer when he presented the market profile to traders(atas.net).
The IB is monitored as a break-out area for Range Extension traders. The IB High is also seen as an area of resistance and the IB Low as an area of support until it is broken(www.mypivots.com).
As a note, depending on the Time Zone you are in, you may need to manually add or subtract from the Timed Range to match the desired Time. For example in NY Eastern Time, I have to use 8:30-9:30AM to Capture the 9:30-10-30AM IB for ES and NQ. Similarly, I must use 14:30-15:30PM to Capture the 9:30-10-30AM IB for BTC. You will need to make adjustments based on the Time Zone you are located in.
I wanted to give a Special Thanks to @PineCoders for the Custom Rounding Function from Backtesting/Trading Engine--> (), Pinecoders.com for help with Tracking the Highs/Lows--> (www.pinecoders.com), and @TradeChartist for allowing me to use some of the code for the Fibonacci Extensions from his script here--> ().
If you like User-Inputed Time Range & Fibs, be sure to Like, Follow, and if you have any questions, don't be afraid to drop a comment below.

Realized VolatilityRealized / Historical Volatility
Calculates historical, i.e. realized volatility of any underlying. If frequency is not the daily, but for example 6h, 30min, weeks or months, it scales the initial setting to be suitable for the different time frame.
Examples with default settings (30 day volatility, 365 days per year):
A) Frequency = Daily:
Returns 30 day historical volatility, under the assumption that there are 365 trading days in a year.
B) Frequency = 6h:
Still returns 30 day historical volatility, under the assumption that there are 365 trading days in a year. However, since 6h granularity fits 4 times in 24 hours, it rescales the look back period to rather 30*4 = 120 units to still reflect 30 day historical volatility.

RSI3graf. 3 RSI in one window[wozdux] Three RSI indicator charts in one window. Plus, the resale area (green) and overbought area ( red) are highlighted. Indicator settings are periods of calculation of the RSI indicator (24, 14, 9). The fourth parameter (30) is the critical levels, which are at a distance of 30 units from the edges. If the parameter is 30, then the oversold level is 30 and the overbought level is 70 (100-30).

Hellenic EMA Matrix - Α Ω PremiumHellenic EMA Matrix - Alpha Omega Premium
Complete User Guide
Table of Contents
Introduction
Indicator Philosophy
Mathematical Constants
EMA Types
Settings
Trading Signals
Visualization
Usage Strategies
FAQ
Introduction
Hellenic EMA Matrix is a premium indicator based on mathematical constants of nature: Phi (Phi - Golden Ratio), Pi (Pi), e (Euler's number). The indicator uses these universal constants to create dynamic EMAs that adapt to the natural rhythms of the market.
Key Features:
6 EMA types based on mathematical constants
Premium visualization with Neon Glow and Gradient Clouds
Automatic Fast/Mid/Slow EMA sorting
STRONG signals for powerful trends
Pulsing Ribbon Bar for instant trend assessment
Works on all timeframes (M1 - MN)
Indicator Philosophy
Why Mathematical Constants?
Traditional EMAs use arbitrary periods (9, 21, 50, 200). Hellenic Matrix goes further, using universal mathematical constants found in nature:
Phi (1.618) - Golden Ratio: galaxy spirals, seashells, human body proportions
Pi (3.14159) - Pi: circles, waves, cycles
e (2.71828) - Natural logarithm base: exponential growth, radioactive decay
Markets are also a natural system composed of millions of participants. Using mathematical constants allows tuning into the natural rhythms of market cycles.
Mathematical Constants
Phi (Phi) - Golden Ratio
Phi = 1.618033988749895
Properties:
Phi² = Phi + 1 = 2.618
Phi³ = 4.236
Phi⁴ = 6.854
Application: Ideal for trending movements and Fibonacci corrections
Pi (Pi) - Pi Number
Pi = 3.141592653589793
Properties:
2Pi = 6.283 (full circle)
3Pi = 9.425
4Pi = 12.566
Application: Excellent for cyclical markets and wave structures
e (Euler) - Euler's Number
e = 2.718281828459045
Properties:
e² = 7.389
e³ = 20.085
e⁴ = 54.598
Application: Suitable for exponential movements and volatile markets
EMA Types
1. Phi (Phi) - Golden Ratio EMA
Description: EMA based on the golden ratio
Period Formula:
Period = Phi^n × Base Multiplier
Parameters:
Phi Power Level (1-8): Power of Phi
Phi¹ = 1.618 → ~16 period (with Base=10)
Phi² = 2.618 → ~26 period
Phi³ = 4.236 → ~42 period (recommended)
Phi⁴ = 6.854 → ~69 period
Recommendations:
Phi² or Phi³ for day trading
Phi⁴ or Phi⁵ for swing trading
Works excellently as Fast EMA
2. Pi (Pi) - Circular EMA
Description: EMA based on Pi for cyclical movements
Period Formula:
Period = Pi × Multiple × Base Multiplier
Parameters:
Pi Multiple (1-10): Pi multiplier
1Pi = 3.14 → ~31 period (with Base=10)
2Pi = 6.28 → ~63 period (recommended)
3Pi = 9.42 → ~94 period
Recommendations:
2Pi ideal as Mid or Slow EMA
Excellently identifies cycles and waves
Use on volatile markets (crypto, forex)
3. e (Euler) - Natural EMA
Description: EMA based on natural logarithm
Period Formula:
Period = e^n × Base Multiplier
Parameters:
e Power Level (1-6): Power of e
e¹ = 2.718 → ~27 period (with Base=10)
e² = 7.389 → ~74 period (recommended)
e³ = 20.085 → ~201 period
Recommendations:
e² works excellently as Slow EMA
Ideal for stocks and indices
Filters noise well on lower timeframes
4. Delta (Delta) - Adaptive EMA
Description: Adaptive EMA that changes period based on volatility
Period Formula:
Period = Base Period × (1 + (Volatility - 1) × Factor)
Parameters:
Delta Base Period (5-200): Base period (default 20)
Delta Volatility Sensitivity (0.5-5.0): Volatility sensitivity (default 2.0)
How it works:
During low volatility → period decreases → EMA reacts faster
During high volatility → period increases → EMA smooths noise
Recommendations:
Works excellently on news and sharp movements
Use as Fast EMA for quick adaptation
Sensitivity 2.0-3.0 for crypto, 1.0-2.0 for stocks
5. Sigma (Sigma) - Composite EMA
Description: Composite EMA combining multiple active EMAs
Composition Methods:
Weighted Average (default):
Sigma = (Phi + Pi + e + Delta) / 4
Simple average of all active EMAs
Geometric Mean:
Sigma = fourth_root(Phi × Pi × e × Delta)
Geometric mean (more conservative)
Harmonic Mean:
Sigma = 4 / (1/Phi + 1/Pi + 1/e + 1/Delta)
Harmonic mean (more weight to smaller values)
Recommendations:
Enable for additional confirmation
Use as Mid EMA
Weighted Average - most universal method
6. Lambda (Lambda) - Wave EMA
Description: Wave EMA with sinusoidal period modulation
Period Formula:
Period = Base Period × (1 + Amplitude × sin(2Pi × bar / Frequency))
Parameters:
Lambda Base Period (10-200): Base period
Lambda Wave Amplitude (0.1-2.0): Wave amplitude
Lambda Wave Frequency (10-200): Wave frequency in bars
How it works:
Period pulsates sinusoidally
Creates wave effect following market cycles
Recommendations:
Experimental EMA for advanced users
Works well on cyclical markets
Frequency = 50 for day trading, 100+ for swing
Settings
Matrix Core Settings
Base Multiplier (1-100)
Multiplies all EMA periods
Base = 1: Very fast EMAs (Phi³ = 4, 2Pi = 6, e² = 7)
Base = 10: Standard (Phi³ = 42, 2Pi = 63, e² = 74)
Base = 20: Slow EMAs (Phi³ = 85, 2Pi = 126, e² = 148)
Recommendations by timeframe:
M1-M5: Base = 5-10
M15-H1: Base = 10-15 (recommended)
H4-D1: Base = 15-25
W1-MN: Base = 25-50
Matrix Source
Data source selection for EMA calculation:
close - closing price (standard)
open - opening price
high - high
low - low
hl2 - (high + low) / 2
hlc3 - (high + low + close) / 3
ohlc4 - (open + high + low + close) / 4
When to change:
hlc3 or ohlc4 for smoother signals
high for aggressive longs
low for aggressive shorts
Manual EMA Selection
Critically important setting! Determines which EMAs are used for signal generation.
Use Manual Fast/Slow/Mid Selection
Enabled (default): You select EMAs manually
Disabled: Automatic selection by periods
Fast EMA
Fast EMA - reacts first to price changes
Recommendations:
Phi Golden (recommended) - universal choice
Delta Adaptive - for volatile markets
Must be fastest (smallest period)
Slow EMA
Slow EMA - determines main trend
Recommendations:
Pi Circular (recommended) - excellent trend filter
e Natural - for smoother trend
Must be slowest (largest period)
Mid EMA
Mid EMA - additional signal filter
Recommendations:
e Natural (recommended) - excellent middle level
Pi Circular - alternative
None - for more frequent signals (only 2 EMAs)
IMPORTANT: The indicator automatically sorts selected EMAs by their actual periods:
Fast = EMA with smallest period
Mid = EMA with middle period
Slow = EMA with largest period
Therefore, you can select any combination - the indicator will arrange them correctly!
Premium Visualization
Neon Glow
Enable Neon Glow for EMAs - adds glowing effect around EMA lines
Glow Strength:
Light - subtle glow
Medium (recommended) - optimal balance
Strong - bright glow (may be too bright)
Effect: 2 glow layers around each EMA for 3D effect
Gradient Clouds
Enable Gradient Clouds - fills space between EMAs with gradient
Parameters:
Cloud Transparency (85-98): Cloud transparency
95-97 (recommended)
Higher = more transparent
Dynamic Cloud Intensity - automatically changes transparency based on EMA distance
Cloud Colors:
Phi-Pi Cloud:
Blue - when Pi above Phi (bullish)
Gold - when Phi above Pi (bearish)
Pi-e Cloud:
Green - when e above Pi (bullish)
Blue - when Pi above e (bearish)
2 layers for volumetric effect
Pulsing Ribbon Bar
Enable Pulsing Indicator Bar - pulsing strip at bottom/top of chart
Parameters:
Ribbon Position: Top / Bottom (recommended)
Pulse Speed: Slow / Medium (recommended) / Fast
Symbols and colors:
Green filled square - STRONG BULLISH
Pink filled square - STRONG BEARISH
Blue hollow square - Bullish (regular)
Red hollow square - Bearish (regular)
Purple rectangle - Neutral
Effect: Pulsation with sinusoid for living market feel
Signal Bar Highlights
Enable Signal Bar Highlights - highlights bars with signals
Parameters:
Highlight Transparency (88-96): Highlight transparency
Highlight Style:
Light Fill (recommended) - bar background fill
Thin Line - bar outline only
Highlights:
Golden Cross - green
Death Cross - pink
STRONG BUY - green
STRONG SELL - pink
Show Greek Labels
Shows Greek alphabet letters on last bar:
Phi - Phi EMA (gold)
Pi - Pi EMA (blue)
e - Euler EMA (green)
Delta - Delta EMA (purple)
Sigma - Sigma EMA (pink)
When to use: For education or presentations
Show Old Background
Old background style (not recommended):
Green background - STRONG BULLISH
Pink background - STRONG BEARISH
Blue background - Bullish
Red background - Bearish
Not recommended - use new Gradient Clouds and Pulsing Bar
Info Table
Show Info Table - table with indicator information
Parameters:
Position: Top Left / Top Right (recommended) / Bottom Left / Bottom Right
Size: Tiny / Small (recommended) / Normal / Large
Table contents:
EMA list - periods and current values of all active EMAs
Effects - active visual effects
TREND - current trend state:
STRONG UP - strong bullish
STRONG DOWN - strong bearish
Bullish - regular bullish
Bearish - regular bearish
Neutral - neutral
Momentum % - percentage deviation of price from Fast EMA
Setup - current Fast/Slow/Mid configuration
Trading Signals
Show Golden/Death Cross
Golden Cross - Fast EMA crosses Slow EMA from below (bullish signal) Death Cross - Fast EMA crosses Slow EMA from above (bearish signal)
Symbols:
Yellow dot "GC" below - Golden Cross
Dark red dot "DC" above - Death Cross
Show STRONG Signals
STRONG BUY and STRONG SELL - the most powerful indicator signals
Conditions for STRONG BULLISH:
EMA Alignment: Fast > Mid > Slow (all EMAs aligned)
Trend: Fast > Slow (clear uptrend)
Distance: EMAs separated by minimum 0.15%
Price Position: Price above Fast EMA
Fast Slope: Fast EMA rising
Slow Slope: Slow EMA rising
Mid Trending: Mid EMA also rising (if enabled)
Conditions for STRONG BEARISH:
Same but in reverse
Visual display:
Green label "STRONG BUY" below bar
Pink label "STRONG SELL" above bar
Difference from Golden/Death Cross:
Golden/Death Cross = crossing moment (1 bar)
STRONG signal = sustained trend (lasts several bars)
IMPORTANT: After fixes, STRONG signals now:
Work on all timeframes (M1 to MN)
Don't break on small retracements
Work with any Fast/Mid/Slow combination
Automatically adapt thanks to EMA sorting
Show Stop Loss/Take Profit
Automatic SL/TP level calculation on STRONG signal
Parameters:
Stop Loss (ATR) (0.5-5.0): ATR multiplier for stop loss
1.5 (recommended) - standard
1.0 - tight stop
2.0-3.0 - wide stop
Take Profit R:R (1.0-5.0): Risk/reward ratio
2.0 (recommended) - standard (risk 1.5 ATR, profit 3.0 ATR)
1.5 - conservative
3.0-5.0 - aggressive
Formulas:
LONG:
Stop Loss = Entry - (ATR × Stop Loss ATR)
Take Profit = Entry + (ATR × Stop Loss ATR × Take Profit R:R)
SHORT:
Stop Loss = Entry + (ATR × Stop Loss ATR)
Take Profit = Entry - (ATR × Stop Loss ATR × Take Profit R:R)
Visualization:
Red X - Stop Loss
Green X - Take Profit
Levels remain active while STRONG signal persists
Trading Signals
Signal Types
1. Golden Cross
Description: Fast EMA crosses Slow EMA from below
Signal: Beginning of bullish trend
How to trade:
ENTRY: On bar close with Golden Cross
STOP: Below local low or below Slow EMA
TARGET: Next resistance level or 2:1 R:R
Strengths:
Simple and clear
Works well on trending markets
Clear entry point
Weaknesses:
Lags (signal after movement starts)
Many false signals in ranging markets
May be late on fast moves
Optimal timeframes: H1, H4, D1
2. Death Cross
Description: Fast EMA crosses Slow EMA from above
Signal: Beginning of bearish trend
How to trade:
ENTRY: On bar close with Death Cross
STOP: Above local high or above Slow EMA
TARGET: Next support level or 2:1 R:R
Application: Mirror of Golden Cross
3. STRONG BUY
Description: All EMAs aligned + trend + all EMAs rising
Signal: Powerful bullish trend
How to trade:
ENTRY: On bar close with STRONG BUY or on pullback to Fast EMA
STOP: Below Fast EMA or automatic SL (if enabled)
TARGET: Automatic TP (if enabled) or by levels
TRAILING: Follow Fast EMA
Entry strategies:
Aggressive: Enter immediately on signal
Conservative: Wait for pullback to Fast EMA, then enter on bounce
Pyramiding: Add positions on pullbacks to Mid EMA
Position management:
Hold while STRONG signal active
Exit on STRONG SELL or Death Cross appearance
Move stop behind Fast EMA
Strengths:
Most reliable indicator signal
Doesn't break on pullbacks
Catches large moves
Works on all timeframes
Weaknesses:
Appears less frequently than other signals
Requires confirmation (multiple conditions)
Optimal timeframes: All (M5 - D1)
4. STRONG SELL
Description: All EMAs aligned down + downtrend + all EMAs falling
Signal: Powerful bearish trend
How to trade: Mirror of STRONG BUY
Visual Signals
Pulsing Ribbon Bar
Quick market assessment at a glance:
Symbol Color State
Filled square Green STRONG BULLISH
Filled square Pink STRONG BEARISH
Hollow square Blue Bullish
Hollow square Red Bearish
Rectangle Purple Neutral
Pulsation: Sinusoidal, creates living effect
Signal Bar Highlights
Bars with signals are highlighted:
Green highlight: STRONG BUY or Golden Cross
Pink highlight: STRONG SELL or Death Cross
Gradient Clouds
Colored space between EMAs shows trend strength:
Wide clouds - strong trend
Narrow clouds - weak trend or consolidation
Color change - trend change
Info Table
Quick reference in corner:
TREND: Current state (STRONG UP, Bullish, Neutral, Bearish, STRONG DOWN)
Momentum %: Movement strength
Effects: Active visual effects
Setup: Fast/Slow/Mid configuration
Usage Strategies
Strategy 1: "Golden Trailing"
Idea: Follow STRONG signals using Fast EMA as trailing stop
Settings:
Fast: Phi Golden (Phi³)
Mid: Pi Circular (2Pi)
Slow: e Natural (e²)
Base Multiplier: 10
Timeframe: H1, H4
Entry rules:
Wait for STRONG BUY
Enter on bar close or on pullback to Fast EMA
Stop below Fast EMA
Management:
Hold position while STRONG signal active
Move stop behind Fast EMA daily
Exit on STRONG SELL or Death Cross
Take Profit:
Partially close at +2R
Trail remainder until exit signal
For whom: Swing traders, trend followers
Pros:
Catches large moves
Simple rules
Emotionally comfortable
Cons:
Requires patience
Possible extended drawdowns on pullbacks
Strategy 2: "Scalping Bounces"
Idea: Scalp bounces from Fast EMA during STRONG trend
Settings:
Fast: Delta Adaptive (Base 15, Sensitivity 2.0)
Mid: Phi Golden (Phi²)
Slow: Pi Circular (2Pi)
Base Multiplier: 5
Timeframe: M5, M15
Entry rules:
STRONG signal must be active
Wait for price pullback to Fast EMA
Enter on bounce (candle closes above/below Fast EMA)
Stop behind local extreme (15-20 pips)
Take Profit:
+1.5R or to Mid EMA
Or to next level
For whom: Active day traders
Pros:
Many signals
Clear entry point
Quick profits
Cons:
Requires constant monitoring
Not all bounces work
Requires discipline for frequent trading
Strategy 3: "Triple Filter"
Idea: Enter only when all 3 EMAs and price perfectly aligned
Settings:
Fast: Phi Golden (Phi³)
Mid: e Natural (e²)
Slow: Pi Circular (3Pi)
Base Multiplier: 15
Timeframe: H4, D1
Entry rules (LONG):
STRONG BUY active
Price above all three EMAs
Fast > Mid > Slow (all aligned)
All EMAs rising (slope up)
Gradient Clouds wide and bright
Entry:
On bar close meeting all conditions
Or on next pullback to Fast EMA
Stop:
Below Mid EMA or -1.5 ATR
Take Profit:
First target: +3R
Second target: next major level
Trailing: Mid EMA
For whom: Conservative swing traders, investors
Pros:
Very reliable signals
Minimum false entries
Large profit potential
Cons:
Rare signals (2-5 per month)
Requires patience
Strategy 4: "Adaptive Scalper"
Idea: Use only Delta Adaptive EMA for quick volatility reaction
Settings:
Fast: Delta Adaptive (Base 10, Sensitivity 3.0)
Mid: None
Slow: Delta Adaptive (Base 30, Sensitivity 2.0)
Base Multiplier: 3
Timeframe: M1, M5
Feature: Two different Delta EMAs with different settings
Entry rules:
Golden Cross between two Delta EMAs
Both Delta EMAs must be rising/falling
Enter on next bar
Stop:
10-15 pips or below Slow Delta EMA
Take Profit:
+1R to +2R
Or Death Cross
For whom: Scalpers on cryptocurrencies and forex
Pros:
Instant volatility adaptation
Many signals on volatile markets
Quick results
Cons:
Much noise on calm markets
Requires fast execution
High commissions may eat profits
Strategy 5: "Cyclical Trader"
Idea: Use Pi and Lambda for trading cyclical markets
Settings:
Fast: Pi Circular (1Pi)
Mid: Lambda Wave (Base 30, Amplitude 0.5, Frequency 50)
Slow: Pi Circular (3Pi)
Base Multiplier: 10
Timeframe: H1, H4
Entry rules:
STRONG signal active
Lambda Wave EMA synchronized with trend
Enter on bounce from Lambda Wave
For whom: Traders of cyclical assets (some altcoins, commodities)
Pros:
Catches cyclical movements
Lambda Wave provides additional entry points
Cons:
More complex to configure
Not for all markets
Lambda Wave may give false signals
Strategy 6: "Multi-Timeframe Confirmation"
Idea: Use multiple timeframes for confirmation
Scheme:
Higher TF (D1): Determine trend direction (STRONG signal)
Middle TF (H4): Wait for STRONG signal in same direction
Lower TF (M15): Look for entry point (Golden Cross or bounce from Fast EMA)
Settings for all TFs:
Fast: Phi Golden (Phi³)
Mid: e Natural (e²)
Slow: Pi Circular (2Pi)
Base Multiplier: 10
Rules:
All 3 TFs must show one trend
Entry on lower TF
Stop by lower TF
Target by higher TF
For whom: Serious traders and investors
Pros:
Maximum reliability
Large profit targets
Minimum false signals
Cons:
Rare setups
Requires analysis of multiple charts
Experience needed
Practical Tips
DOs
Use STRONG signals as primary - they're most reliable
Let signals develop - don't exit on first pullback
Use trailing stop - follow Fast EMA
Combine with levels - S/R, Fibonacci, volumes
Test on demo before real
Adjust Base Multiplier for your timeframe
Enable visual effects - they help see the picture
Use Info Table - quick situation assessment
Watch Pulsing Bar - instant state indicator
Trust auto-sorting of Fast/Mid/Slow
DON'Ts
Don't trade against STRONG signal - trend is your friend
Don't ignore Mid EMA - it adds reliability
Don't use too small Base Multiplier on higher TFs
Don't enter on Golden Cross in range - check for trend
Don't change settings during open position
Don't forget risk management - 1-2% per trade
Don't trade all signals in row - choose best ones
Don't use indicator in isolation - combine with Price Action
Don't set too tight stops - let trade breathe
Don't over-optimize - simplicity = reliability
Optimal Settings by Asset
US Stocks (SPY, AAPL, TSLA)
Recommendation:
Fast: Phi Golden (Phi³)
Mid: e Natural (e²)
Slow: Pi Circular (2Pi)
Base: 10-15
Timeframe: H4, D1
Features:
Use on daily for swing
STRONG signals very reliable
Works well on trending stocks
Forex (EUR/USD, GBP/USD)
Recommendation:
Fast: Delta Adaptive (Base 15, Sens 2.0)
Mid: Phi Golden (Phi²)
Slow: Pi Circular (2Pi)
Base: 8-12
Timeframe: M15, H1, H4
Features:
Delta Adaptive works excellently on news
Many signals on M15-H1
Consider spreads
Cryptocurrencies (BTC, ETH, altcoins)
Recommendation:
Fast: Delta Adaptive (Base 10, Sens 3.0)
Mid: Pi Circular (2Pi)
Slow: e Natural (e²)
Base: 5-10
Timeframe: M5, M15, H1
Features:
High volatility - adaptation needed
STRONG signals can last days
Be careful with scalping on M1-M5
Commodities (Gold, Oil)
Recommendation:
Fast: Pi Circular (1Pi)
Mid: Phi Golden (Phi³)
Slow: Pi Circular (3Pi)
Base: 12-18
Timeframe: H4, D1
Features:
Pi works excellently on cyclical commodities
Gold responds especially well to Phi
Oil volatile - use wide stops
Indices (S&P500, Nasdaq, DAX)
Recommendation:
Fast: Phi Golden (Phi³)
Mid: e Natural (e²)
Slow: Pi Circular (2Pi)
Base: 15-20
Timeframe: H4, D1, W1
Features:
Very trending instruments
STRONG signals last weeks
Good for position trading
Alerts
The indicator supports 6 alert types:
1. Golden Cross
Message: "Hellenic Matrix: GOLDEN CROSS - Fast EMA crossed above Slow EMA - Bullish trend starting!"
When: Fast EMA crosses Slow EMA from below
2. Death Cross
Message: "Hellenic Matrix: DEATH CROSS - Fast EMA crossed below Slow EMA - Bearish trend starting!"
When: Fast EMA crosses Slow EMA from above
3. STRONG BULLISH
Message: "Hellenic Matrix: STRONG BULLISH SIGNAL - All EMAs aligned for powerful uptrend!"
When: All conditions for STRONG BUY met (first bar)
4. STRONG BEARISH
Message: "Hellenic Matrix: STRONG BEARISH SIGNAL - All EMAs aligned for powerful downtrend!"
When: All conditions for STRONG SELL met (first bar)
5. Bullish Ribbon
Message: "Hellenic Matrix: BULLISH RIBBON - EMAs aligned for uptrend"
When: EMAs aligned bullish + price above Fast EMA (less strict condition)
6. Bearish Ribbon
Message: "Hellenic Matrix: BEARISH RIBBON - EMAs aligned for downtrend"
When: EMAs aligned bearish + price below Fast EMA (less strict condition)
How to Set Up Alerts:
Open indicator on chart
Click on three dots next to indicator name
Select "Create Alert"
In "Condition" field select needed alert:
Golden Cross
Death Cross
STRONG BULLISH
STRONG BEARISH
Bullish Ribbon
Bearish Ribbon
Configure notification method:
Pop-up in browser
Email
SMS (in Premium accounts)
Push notifications in mobile app
Webhook (for automation)
Select frequency:
Once Per Bar Close (recommended) - once on bar close
Once Per Bar - during bar formation
Only Once - only first time
Click "Create"
Tip: Create separate alerts for different timeframes and instruments
FAQ
1. Why don't STRONG signals appear?
Possible reasons:
Incorrect Fast/Mid/Slow order
Solution: Indicator automatically sorts EMAs by periods, but ensure selected EMAs have different periods
Base Multiplier too large
Solution: Reduce Base to 5-10 on lower timeframes
Market in range
Solution: STRONG signals appear only in trends - this is normal
Too strict EMA settings
Solution: Try classic combination: Phi³ / Pi×2 / e² with Base=10
Mid EMA too close to Fast or Slow
Solution: Select Mid EMA with period between Fast and Slow
2. How often should STRONG signals appear?
Normal frequency:
M1-M5: 5-15 signals per day (very active markets)
M15-H1: 2-8 signals per day
H4: 3-10 signals per week
D1: 2-5 signals per month
W1: 2-6 signals per year
If too many signals - market very volatile or Base too small
If too few signals - market in range or Base too large
4. What are the best settings for beginners?
Universal "out of the box" settings:
Matrix Core:
Base Multiplier: 10
Source: close
Phi Golden: Enabled, Power = 3
Pi Circular: Enabled, Multiple = 2
e Natural: Enabled, Power = 2
Delta Adaptive: Enabled, Base = 20, Sensitivity = 2.0
Manual Selection:
Fast: Phi Golden
Mid: e Natural
Slow: Pi Circular
Visualization:
Gradient Clouds: ON
Neon Glow: ON (Medium)
Pulsing Bar: ON (Medium)
Signal Highlights: ON (Light Fill)
Table: ON (Top Right, Small)
Signals:
Golden/Death Cross: ON
STRONG Signals: ON
Stop Loss: OFF (while learning)
Timeframe for learning: H1 or H4
5. Can I use only one EMA?
No, minimum 2 EMAs (Fast and Slow) for signal generation.
Mid EMA is optional:
With Mid EMA = more reliable but rarer signals
Without Mid EMA = more signals but less strict filtering
Recommendation: Start with 3 EMAs (Fast/Mid/Slow), then experiment
6. Does the indicator work on cryptocurrencies?
Yes, works excellently! Especially good on:
Bitcoin (BTC)
Ethereum (ETH)
Major altcoins (SOL, BNB, XRP)
Recommended settings for crypto:
Fast: Delta Adaptive (Base 10-15, Sensitivity 2.5-3.0)
Mid: Pi Circular (2Pi)
Slow: e Natural (e²)
Base: 5-10
Timeframe: M15, H1, H4
Crypto market features:
High volatility → use Delta Adaptive
24/7 trading → set alerts
Sharp movements → wide stops
7. Can I trade only with this indicator?
Technically yes, but NOT recommended.
Best approach - combine with:
Price Action - support/resistance levels, candle patterns
Volume - movement strength confirmation
Fibonacci - retracement and extension levels
RSI/MACD - divergences and overbought/oversold
Fundamental analysis - news, company reports
Hellenic Matrix:
Excellently determines trend and its strength
Provides clear entry/exit points
Doesn't consider fundamentals
Doesn't see major levels
8. Why do Gradient Clouds change color?
Color depends on EMA order:
Phi-Pi Cloud:
Blue - Pi EMA above Phi EMA (bullish alignment)
Gold - Phi EMA above Pi EMA (bearish alignment)
Pi-e Cloud:
Green - e EMA above Pi EMA (bullish alignment)
Blue - Pi EMA above e EMA (bearish alignment)
Color change = EMA order change = possible trend change
9. What is Momentum % in the table?
Momentum % = percentage deviation of price from Fast EMA
Formula:
Momentum = ((Close - Fast EMA) / Fast EMA) × 100
Interpretation:
+0.5% to +2% - normal bullish momentum
+2% to +5% - strong bullish momentum
+5% and above - overheating (correction possible)
-0.5% to -2% - normal bearish momentum
-2% to -5% - strong bearish momentum
-5% and below - oversold (bounce possible)
Usage:
Monitor momentum during STRONG signals
Large momentum = don't enter (wait for pullback)
Small momentum = good entry point
10. How to configure for scalping?
Settings for scalping (M1-M5):
Base Multiplier: 3-5
Source: close or hlc3 (smoother)
Fast: Delta Adaptive (Base 8-12, Sensitivity 3.0)
Mid: None (for more signals)
Slow: Phi Golden (Phi²) or Pi Circular (1Pi)
Visualization:
- Gradient Clouds: ON (helps see strength)
- Neon Glow: OFF (doesn't clutter chart)
- Pulsing Bar: ON (quick assessment)
- Signal Highlights: ON
Signals:
- Golden/Death Cross: ON
- STRONG Signals: ON
- Stop Loss: ON (1.0-1.5 ATR, R:R 1.5-2.0)
Scalping rules:
Trade only STRONG signals
Enter on bounce from Fast EMA
Tight stops (10-20 pips)
Quick take profit (+1R to +2R)
Don't hold through news
11. How to configure for long-term investing?
Settings for investing (D1-W1):
Base Multiplier: 20-30
Source: close
Fast: Phi Golden (Phi³ or Phi⁴)
Mid: e Natural (e²)
Slow: Pi Circular (3Pi or 4Pi)
Visualization:
- Gradient Clouds: ON
- Neon Glow: ON (Medium)
- Everything else - to taste
Signals:
- Golden/Death Cross: ON
- STRONG Signals: ON
- Stop Loss: OFF (use percentage stop)
Investing rules:
Enter only on STRONG signals
Hold while STRONG active (weeks/months)
Stop below Slow EMA or -10%
Take profit: by company targets or +50-100%
Ignore short-term pullbacks
12. What if indicator slows down chart?
Indicator is optimized, but if it slows:
Disable unnecessary visual effects:
Neon Glow: OFF (saves 8 plots)
Gradient Clouds: ON but low quality
Lambda Wave EMA: OFF (if not using)
Reduce number of active EMAs:
Sigma Composite: OFF
Lambda Wave: OFF
Leave only Phi, Pi, e, Delta
Simplify settings:
Pulsing Bar: OFF
Greek Labels: OFF
Info Table: smaller size
13. Can I use on different timeframes simultaneously?
Yes! Multi-timeframe analysis is very powerful:
Classic scheme:
Higher TF (D1, W1) - determine global trend
Wait for STRONG signal
This is our trading direction
Middle TF (H4, H1) - look for confirmation
STRONG signal in same direction
Precise entry zone
Lower TF (M15, M5) - entry point
Golden Cross or bounce from Fast EMA
Precise stop loss
Example:
W1: STRONG BUY active (global uptrend)
H4: STRONG BUY appeared (confirmation)
M15: Wait for Golden Cross or bounce from Fast EMA → ENTRY
Advantages:
Maximum reliability
Clear timeframe hierarchy
Large targets
14. How does indicator work on news?
Delta Adaptive EMA adapts excellently to news:
Before news:
Low volatility → Delta EMA becomes fast → pulls to price
During news:
Sharp volatility spike → Delta EMA slows → filters noise
After news:
Volatility normalizes → Delta EMA returns to normal
Recommendations:
Don't trade at news release moment (spreads widen)
Wait for STRONG signal after news (2-5 bars)
Use Delta Adaptive as Fast EMA for quick reaction
Widen stops by 50-100% during important news
Advanced Techniques
Technique 1: "Divergences with EMA"
Idea: Look for discrepancies between price and Fast EMA
Bullish divergence:
Price makes lower low
Fast EMA makes higher low
= Possible reversal up
Bearish divergence:
Price makes higher high
Fast EMA makes lower high
= Possible reversal down
How to trade:
Find divergence
Wait for STRONG signal in divergence direction
Enter on confirmation
Technique 2: "EMA Tunnel"
Idea: Use space between Fast and Slow EMA as "tunnel"
Rules:
Wide tunnel - strong trend, hold position
Narrow tunnel - weak trend or consolidation, caution
Tunnel narrowing - trend weakening, prepare to exit
Tunnel widening - trend strengthening, can add
Visually: Gradient Clouds show this automatically!
Trading:
Enter on STRONG signal (tunnel starts widening)
Hold while tunnel wide
Exit when tunnel starts narrowing
Technique 3: "Wave Analysis with Lambda"
Idea: Lambda Wave EMA creates sinusoid matching market cycles
Setup:
Lambda Base Period: 30
Lambda Wave Amplitude: 0.5
Lambda Wave Frequency: 50 (adjusted to asset cycle)
How to find correct Frequency:
Look at historical cycles (distance between local highs)
Average distance = your Frequency
Example: if highs every 40-60 bars, set Frequency = 50
Trading:
Enter when Lambda Wave at bottom of sinusoid (growth potential)
Exit when Lambda Wave at top (fall potential)
Combine with STRONG signals
Technique 4: "Cluster Analysis"
Idea: When all EMAs gather in narrow cluster = powerful breakout soon
Cluster signs:
All EMAs (Phi, Pi, e, Delta) within 0.5-1% of each other
Gradient Clouds almost invisible
Price jumping around all EMAs
Trading:
Identify cluster (all EMAs close)
Determine breakout direction (where more volume, higher TFs direction)
Wait for breakout and STRONG signal
Enter on confirmation
Target = cluster size × 3-5
This is very powerful technique for big moves!
Technique 5: "Sigma as Dynamic Level"
Idea: Sigma Composite EMA = average of all EMAs = magnetic level
Usage:
Enable Sigma Composite (Weighted Average)
Sigma works as dynamic support/resistance
Price often returns to Sigma before trend continuation
Trading:
In trend: Enter on bounces from Sigma
In range: Fade moves from Sigma (trade return to Sigma)
On breakout: Sigma becomes support/resistance
Risk Management
Basic Rules
1. Position Size
Conservative: 1% of capital per trade
Moderate: 2% of capital per trade (recommended)
Aggressive: 3-5% (only for experienced)
Calculation formula:
Lot Size = (Capital × Risk%) / (Stop in pips × Pip value)
2. Risk/Reward Ratio
Minimum: 1:1.5
Standard: 1:2 (recommended)
Optimal: 1:3
Aggressive: 1:5+
3. Maximum Drawdown
Daily: -3% to -5%
Weekly: -7% to -10%
Monthly: -15% to -20%
Upon reaching limit → STOP trading until end of period
Position Management Strategies
1. Fixed Stop
Method:
Stop below/above Fast EMA or local extreme
DON'T move stop against position
Can move to breakeven
For whom: Beginners, conservative traders
2. Trailing by Fast EMA
Method:
Each day (or bar) move stop to Fast EMA level
Position closes when price breaks Fast EMA
Advantages:
Stay in trend as long as possible
Automatically exit on reversal
For whom: Trend followers, swing traders
3. Partial Exit
Method:
50% of position close at +2R
50% hold with trailing by Mid EMA or Slow EMA
Advantages:
Lock profit
Leave position for big move
Psychologically comfortable
For whom: Universal method (recommended)
4. Pyramiding
Method:
First entry on STRONG signal (50% of planned position)
Add 25% on pullback to Fast EMA
Add another 25% on pullback to Mid EMA
Overall stop below Slow EMA
Advantages:
Average entry price
Reduce risk
Increase profit in strong trends
Caution:
Works only in trends
In range leads to losses
For whom: Experienced traders
Trading Psychology
Correct Mindset
1. Indicator is a tool, not holy grail
Indicator shows probability, not guarantee
There will be losing trades - this is normal
Important is series statistics, not one trade
2. Trust the system
If STRONG signal appeared - enter
Don't search for "perfect" moment
Follow trading plan
3. Patience
STRONG signals don't appear every day
Better miss signal than enter against trend
Quality over quantity
4. Discipline
Always set stop loss
Don't move stop against position
Don't increase risk after losses
Beginner Mistakes
1. "I know better than indicator"
Indicator says STRONG BUY, but you think "too high, will wait for pullback"
Result: miss profitable move
Solution: Trust signals or don't use indicator
2. "Will reverse now for sure"
Trading against STRONG trend
Result: stops, stops, stops
Solution: Trend is your friend, trade with trend
3. "Will hold a bit more"
Don't exit when STRONG signal disappears
Greed eats profit
Solution: If signal gone - exit!
4. "I'll recover"
After losses double risk
Result: huge losses
Solution: Fixed % risk ALWAYS
5. "I don't like this signal"
Skip signals because of "feeling"
Result: inconsistency, no statistics
Solution: Trade ALL signals or clearly define filters
Trading Journal
What to Record
For each trade:
1. Entry/exit date and time
2. Instrument and timeframe
3. Signal type
Golden Cross
STRONG BUY
STRONG SELL
Death Cross
4. Indicator settings
Fast/Mid/Slow EMA
Base Multiplier
Other parameters
5. Chart screenshot
Entry moment
Exit moment
6. Trade parameters
Position size
Stop loss
Take Profit
R:R
7. Result
Profit/Loss in $
Profit/Loss in %
Profit/Loss in R
8. Notes
What was right
What was wrong
Emotions during trade
Lessons
Journal Analysis
Analyze weekly:
1. Win Rate
Win Rate = (Profitable trades / All trades) × 100%
Good: 50-60%
Excellent: 60-70%
Exceptional: 70%+
2. Average R
Average R = Sum of all R / Number of trades
Good: +0.5R
Excellent: +1.0R
Exceptional: +1.5R+
3. Profit Factor
Profit Factor = Total profit / Total losses
Good: 1.5+
Excellent: 2.0+
Exceptional: 3.0+
4. Maximum Drawdown
Track consecutive losses
If more than 5 in row - stop, check system
5. Best/Worst Trades
What was common in best trades? (do more)
What was common in worst trades? (avoid)
Pre-Trade Checklist
Technical Analysis
STRONG signal active (BUY or SELL)
All EMAs properly aligned (Fast > Mid > Slow or reverse)
Price on correct side of Fast EMA
Gradient Clouds confirm trend
Pulsing Bar shows STRONG state
Momentum % in normal range (not overheated)
No close strong levels against direction
Higher timeframe doesn't contradict
Risk Management
Position size calculated (1-2% risk)
Stop loss set
Take profit calculated (minimum 1:2)
R:R satisfactory
Daily/weekly risk limit not exceeded
No other open correlated positions
Fundamental Analysis
No important news in coming hours
Market session appropriate (liquidity)
No contradicting fundamentals
Understand why asset is moving
Psychology
Calm and thinking clearly
No emotions from previous trades
Ready to accept loss at stop
Following trading plan
Not revenging market for past losses
If at least one point is NO - think twice before entering!
Learning Roadmap
Week 1: Familiarization
Goals:
Install and configure indicator
Study all EMA types
Understand visualization
Tasks:
Add indicator to chart
Test all Fast/Mid/Slow settings
Play with Base Multiplier on different timeframes
Observe Gradient Clouds and Pulsing Bar
Study Info Table
Result: Comfort with indicator interface
Week 2: Signals
Goals:
Learn to recognize all signal types
Understand difference between Golden Cross and STRONG
Tasks:
Find 10 Golden Cross examples in history
Find 10 STRONG BUY examples in history
Compare their results (which worked better)
Set up alerts
Get 5 real alerts
Result: Understanding signals
Week 3: Demo Trading
Goals:
Start trading signals on demo account
Gather statistics
Tasks:
Open demo account
Trade ONLY STRONG signals
Keep journal (minimum 20 trades)
Don't change indicator settings
Strictly follow stop losses
Result: 20+ documented trades
Week 4: Analysis
Goals:
Analyze demo trading results
Optimize approach
Tasks:
Calculate win rate and average R
Find patterns in profitable trades
Find patterns in losing trades
Adjust approach (not indicator!)
Write trading plan
Result: Trading plan on 1 page
Month 2: Improvement
Goals:
Deepen understanding
Add additional techniques
Tasks:
Study multi-timeframe analysis
Test combinations with Price Action
Try advanced techniques (divergences, tunnels)
Continue demo trading (minimum 50 trades)
Achieve stable profitability on demo
Result: Win rate 55%+ and Profit Factor 1.5+
Month 3: Real Trading
Goals:
Transition to real account
Maintain discipline
Tasks:
Open small real account
Trade minimum lots
Strictly follow trading plan
DON'T increase risk
Focus on process, not profit
Result: Psychological comfort on real
Month 4+: Scaling
Goals:
Increase account
Become consistently profitable
Tasks:
With 60%+ win rate can increase risk to 2%
Upon doubling account can add capital
Continue keeping journal
Periodically review and improve strategy
Share experience with community
Result: Stable profitability month after month
Additional Resources
Recommended Reading
Technical Analysis:
"Technical Analysis of Financial Markets" - John Murphy
"Trading in the Zone" - Mark Douglas (psychology)
"Market Wizards" - Jack Schwager (trader interviews)
EMA and Moving Averages:
"Moving Averages 101" - Steve Burns
Articles on Investopedia about EMA
Risk Management:
"The Mathematics of Money Management" - Ralph Vince
"Trade Your Way to Financial Freedom" - Van K. Tharp
Trading Journals:
Edgewonk (paid, very powerful)
Tradervue (free version + premium)
Excel/Google Sheets (free)
Screeners:
TradingView Stock Screener
Finviz (stocks)
CoinMarketCap (crypto)
Conclusion
Hellenic EMA Matrix is a powerful tool based on universal mathematical constants of nature. The indicator combines:
Mathematical elegance - Phi, Pi, e instead of arbitrary numbers
Premium visualization - Neon Glow, Gradient Clouds, Pulsing Bar
Reliable signals - STRONG BUY/SELL work on all timeframes
Flexibility - 6 EMA types, adaptation to any trading style
Automation - auto-sorting EMAs, SL/TP calculation, alerts
Key Success Principles:
Simplicity - start with basic settings (Phi/Pi/e, Base=10)
Discipline - follow STRONG signals strictly
Patience - wait for quality setups
Risk Management - 1-2% per trade, ALWAYS
Journal - document every trade
Learning - constantly improve skills
Remember:
Indicator shows probability, not guarantee
Important is series statistics, not one trade
Psychology more important than technique
Quality more important than quantity
Process more important than result
Acknowledgments
Thank you for using Hellenic EMA Matrix - Alpha Omega Premium!
The indicator was created with love for mathematics, markets, and beautiful visualization.
Wishing you profitable trading!
Guide Version: 1.0
Date: 2025
Compatibility: Pine Script v6, TradingView
"In the simplicity of mathematical constants lies the complexity of market movements"

RSI Donchian Channel [DCAUT]█ RSI Donchian Channel
📊 ORIGINALITY & INNOVATION
The RSI Donchian Channel represents an important synthesis of two complementary analytical frameworks: momentum oscillators and breakout detection systems. This indicator addresses a common limitation in traditional RSI analysis by replacing fixed overbought/oversold thresholds with adaptive zones derived from historical RSI extremes.
Key Enhancement:
Traditional RSI analysis relies on static threshold levels (typically 30/70), which may not adequately reflect changing market volatility regimes. This indicator adapts the reference zones dynamically based on the actual RSI behavior over the lookback period, helping traders identify meaningful momentum extremes relative to recent price action rather than arbitrary fixed levels.
The implementation combines the proven momentum measurement capabilities of RSI with Donchian Channel's breakout detection methodology, creating a framework that identifies both momentum exhaustion points and potential continuation signals through the same analytical lens.
📐 MATHEMATICAL FOUNDATION
Core Calculation Process:
Step 1: RSI Calculation
The Relative Strength Index measures momentum by comparing the magnitude of recent gains to recent losses:
Calculate price changes between consecutive periods
Separate positive changes (gains) from negative changes (losses)
Apply selected smoothing method (RMA standard, also supports SMA, EMA, WMA) to both gain and loss series
Compute Relative Strength (RS) as the ratio of smoothed gains to smoothed losses
Transform RS into bounded 0-100 scale using the formula: RSI = 100 - (100 / (1 + RS))
Step 2: Donchian Channel Application
The Donchian Channel identifies the highest and lowest RSI values within the specified lookback period:
Upper Channel: Highest RSI value over the lookback period, represents the recent momentum peak
Lower Channel: Lowest RSI value over the lookback period, represents the recent momentum trough
Middle Channel (Basis): Average of upper and lower channels, serves as equilibrium reference
Channel Width Dynamics:
The distance between upper and lower channels reflects RSI volatility. Wide channels indicate high momentum variability, while narrow channels suggest momentum consolidation and potential breakout preparation. The indicator monitors channel width over a 100-period window to identify squeeze conditions that often precede significant momentum shifts.
📊 COMPREHENSIVE SIGNAL ANALYSIS
Primary Signal Categories:
Breakout Signals:
Upper Breakout: RSI crosses above the upper channel, indicates momentum reaching new relative highs and potential trend continuation, particularly significant when accompanied by price confirmation
Lower Breakout: RSI crosses below the lower channel, suggests momentum reaching new relative lows and potential trend exhaustion or reversal setup
Breakout strength is enhanced when the channel is narrow prior to the breakout, indicating a transition from consolidation to directional movement
Mean Reversion Signals:
Upper Touch Without Breakout: RSI reaches the upper channel but fails to break through, may indicate momentum exhaustion and potential reversal opportunity
Lower Touch Without Breakout: RSI reaches the lower channel without breakdown, suggests potential bounce as momentum reaches oversold extremes
Return to Basis: RSI moving back toward the middle channel after touching extremes signals momentum normalization
Trend Strength Assessment:
Sustained Upper Channel Riding: RSI consistently remains near or above the upper channel during strong uptrends, indicates persistent bullish momentum
Sustained Lower Channel Riding: RSI stays near or below the lower channel during strong downtrends, reflects persistent bearish pressure
Basis Line Position: RSI position relative to the middle channel helps identify the prevailing momentum bias
Channel Compression Patterns:
Squeeze Detection: Channel width narrowing to 100-period lows indicates momentum consolidation, often precedes significant directional moves
Expansion Phase: Channel widening after a squeeze confirms the initiation of a new momentum regime
Persistent Narrow Channels: Extended periods of tight channels suggest market indecision and accumulation/distribution phases
🎯 STRATEGIC APPLICATIONS
Trend Continuation Strategy:
This approach focuses on identifying and trading momentum breakouts that confirm established trends:
Identify the prevailing price trend using higher timeframe analysis or trend-following indicators
Wait for RSI to break above the upper channel in uptrends (or below the lower channel in downtrends)
Enter positions in the direction of the breakout when price action confirms the momentum shift
Place protective stops below the recent swing low (long positions) or above swing high (short positions)
Target profit levels based on prior swing extremes or use trailing stops to capture extended moves
Exit when RSI crosses back through the basis line in the opposite direction
Mean Reversion Strategy:
This method capitalizes on momentum extremes and subsequent corrections toward equilibrium:
Monitor for RSI reaching the upper or lower channel boundaries
Look for rejection signals (price reversal patterns, volume divergence) when RSI touches the channels
Enter counter-trend positions when RSI begins moving back toward the basis line
Use the basis line as the initial profit target for mean reversion trades
Implement tight stops beyond the channel extremes to limit risk on failed reversals
Scale out of positions as RSI approaches the basis line and closes the position when RSI crosses the basis
Breakout Preparation Strategy:
This approach positions traders ahead of potential volatility expansion from consolidation phases:
Identify squeeze conditions when channel width reaches 100-period lows
Monitor price action for consolidation patterns (triangles, rectangles, flags) during the squeeze
Prepare conditional orders for breakouts in both directions from the consolidation
Enter positions when RSI breaks out of the narrow channel with expanding width
Use the channel width expansion as a confirmation signal for the breakout's validity
Manage risk with stops just inside the opposite channel boundary
Multi-Timeframe Confluence Strategy:
Combining RSI Donchian Channel analysis across multiple timeframes can improve signal reliability:
Identify the primary trend direction using a higher timeframe RSI Donchian Channel (e.g., daily or weekly)
Use a lower timeframe (e.g., 4-hour or hourly) to time precise entry points
Enter long positions when both timeframes show RSI above their respective basis lines
Enter short positions when both timeframes show RSI below their respective basis lines
Avoid trades when timeframes provide conflicting signals (e.g., higher timeframe below basis, lower timeframe above)
Exit when the higher timeframe RSI crosses its basis line in the opposite direction
Risk Management Guidelines:
Effective risk management is essential for all RSI Donchian Channel strategies:
Position Sizing: Calculate position sizes based on the distance between entry point and stop loss, limiting risk to 1-2% of capital per trade
Stop Loss Placement: For breakout trades, place stops just inside the opposite channel boundary; for mean reversion trades, use stops beyond the channel extremes
Profit Targets: Use the basis line as a minimum target for mean reversion trades; for trend trades, target prior swing extremes or use trailing stops
Channel Width Context: Increase position sizes during narrow channels (lower volatility) and reduce sizes during wide channels (higher volatility)
Correlation Awareness: Monitor correlations between traded instruments to avoid over-concentration in similar setups
📋 DETAILED PARAMETER CONFIGURATION
RSI Source:
Defines the price data series used for RSI calculation:
Close (Default): Standard choice providing end-of-period momentum assessment, suitable for most trading styles and timeframes
High-Low Average (HL2): Reduces the impact of closing auction dynamics, useful for markets with significant end-of-day volatility
High-Low-Close Average (HLC3): Provides a more balanced view incorporating the entire period's range
Open-High-Low-Close Average (OHLC4): Offers the most comprehensive price representation, helpful for identifying overall period sentiment
Strategy Consideration: Use Close for end-of-period signals, HL2 or HLC3 for intraday volatility reduction, OHLC4 for capturing full period dynamics
RSI Length:
Controls the number of periods used for RSI calculation:
Short Periods (5-9): Highly responsive to recent price changes, produces more frequent signals with increased false signal risk, suitable for short-term trading and volatile markets
Standard Period (14): Widely accepted default balancing responsiveness with stability, appropriate for swing trading and intermediate-term analysis
Long Periods (21-28): Produces smoother RSI with fewer signals but more reliable trend identification, better for position trading and reducing noise in choppy markets
Optimization Approach: Test different lengths against historical data for your specific market and timeframe, consider using longer periods in ranging markets and shorter periods in trending markets
RSI MA Type:
Determines the smoothing method applied to price changes in RSI calculation:
RMA (Relative Moving Average - Default): Wilder's original smoothing method providing stable momentum measurement with gradual response to changes, maintains consistency with classical RSI interpretation
SMA (Simple Moving Average): Treats all periods equally, responds more quickly to changes than RMA but may produce more whipsaws in volatile conditions
EMA (Exponential Moving Average): Weights recent periods more heavily, increases responsiveness at the cost of potential noise, suitable for traders prioritizing early signal generation
WMA (Weighted Moving Average): Applies linear weighting favoring recent data, offers a middle ground between SMA and EMA responsiveness
Selection Guidance: Maintain RMA for consistency with traditional RSI analysis, use EMA or WMA for more responsive signals in fast-moving markets, apply SMA for maximum simplicity and transparency
DC Length:
Specifies the lookback period for Donchian Channel calculation on RSI values:
Short Periods (10-14): Creates tight channels that adapt quickly to changing momentum conditions, generates more frequent trading signals but increases sensitivity to short-term RSI fluctuations
Standard Period (20): Balances channel responsiveness with stability, aligns with traditional Bollinger Bands and moving average periods, suitable for most trading styles
Long Periods (30-50): Produces wider, more stable channels that better represent sustained momentum extremes, reduces signal frequency while improving reliability, appropriate for position traders and higher timeframes
Calibration Strategy: Match DC length to your trading timeframe (shorter for day trading, longer for swing trading), test channel width behavior during different market regimes, consider using adaptive periods that adjust to volatility conditions
Market Adaptation: Use shorter DC lengths in trending markets to capture momentum shifts earlier, apply longer periods in ranging markets to filter noise and focus on significant extremes
Parameter Combination Recommendations:
Scalping/Day Trading: RSI Length 5-9, DC Length 10-14, EMA or WMA smoothing for maximum responsiveness
Swing Trading: RSI Length 14, DC Length 20, RMA smoothing for balanced analysis (default configuration)
Position Trading: RSI Length 21-28, DC Length 30-50, RMA or SMA smoothing for stable signals
High Volatility Markets: Longer RSI periods (21+) with standard DC length (20) to reduce noise
Low Volatility Markets: Standard RSI length (14) with shorter DC length (10-14) to capture subtle momentum shifts
📈 PERFORMANCE ANALYSIS & COMPETITIVE ADVANTAGES
Adaptive Threshold Mechanism:
Unlike traditional RSI analysis with fixed 30/70 thresholds, this indicator's Donchian Channel approach provides several improvements:
Context-Aware Extremes: Overbought/oversold levels adjust automatically based on recent momentum behavior rather than arbitrary fixed values
Volatility Adaptation: In low volatility periods, channels narrow to reflect tighter momentum ranges; in high volatility, channels widen appropriately
Market Regime Recognition: The indicator implicitly adapts to different market conditions without manual threshold adjustments
False Signal Reduction: Adaptive channels help reduce premature reversal signals that often occur with fixed thresholds during strong trends
Signal Quality Characteristics:
The indicator's dual-purpose design provides distinct advantages for different trading objectives:
Breakout Trading: Channel boundaries offer clear, objective breakout levels that update dynamically, eliminating the ambiguity of when momentum becomes "too high" or "too low"
Mean Reversion: The basis line provides a natural profit target for reversion trades, representing the midpoint of recent momentum extremes
Trend Strength: Persistent channel boundary riding offers an objective measure of trend strength without additional indicators
Consolidation Detection: Channel width analysis provides early warning of potential volatility expansion from compression phases
Comparative Analysis:
When compared to traditional RSI implementations and other momentum frameworks:
vs. Fixed Threshold RSI: Provides market-adaptive reference levels rather than static values, helping to reduce false signals during trending markets where RSI can remain "overbought" or "oversold" for extended periods
vs. RSI Bollinger Bands: Offers clearer breakout signals and more intuitive extreme identification through actual high/low boundaries rather than statistical standard deviations
vs. Stochastic Oscillator: Maintains RSI's momentum measurement advantages (unbounded calculation avoiding scale compression) while adding the breakout detection capabilities of Donchian Channels
vs. Standard Donchian Channels: Applies breakout methodology to momentum space rather than price, providing earlier signals of potential trend changes before price breakouts occur
Performance Characteristics:
The indicator exhibits specific behavioral patterns across different market conditions:
Trending Markets: Excels at identifying momentum continuation through channel breakouts, RSI tends to ride one channel boundary during strong trends, providing trend confirmation
Ranging Markets: Channel width narrows during consolidation, offering early preparation signals for potential breakout trading opportunities
High Volatility: Channels widen to reflect increased momentum variability, automatically adjusting signal sensitivity to match market conditions
Low Volatility: Channels contract, making the indicator more sensitive to subtle momentum shifts that may be significant in calm market environments
Transition Periods: Channel squeezes often precede major trend changes, offering advance warning of potential regime shifts
Limitations and Considerations:
Users should be aware of certain operational characteristics:
Lookback Dependency: Channel boundaries depend entirely on the lookback period, meaning the indicator has no predictive element beyond identifying current momentum relative to recent history
Lag Characteristics: As with all moving average-based indicators, RSI calculation introduces lag, and channel boundaries update only as new extremes occur within the lookback window
Range-Bound Sensitivity: In extremely tight ranges, channels may become very narrow, potentially generating excessive signals from minor momentum fluctuations
Trending Persistence: During very strong trends, RSI may remain at channel extremes for extended periods, requiring patience for mean reversion setups or commitment to trend-following approaches
No Absolute Levels: Unlike traditional RSI, this indicator provides no fixed reference points (like 50), making it less suitable for strategies that depend on absolute momentum readings
USAGE NOTES
This indicator is designed for technical analysis and educational purposes to help traders understand momentum dynamics and identify potential trading opportunities. The RSI Donchian Channel has limitations and should not be used as the sole basis for trading decisions.
Important considerations:
Performance varies significantly across different market conditions, timeframes, and instruments
Historical signal patterns do not guarantee future results, as market behavior continuously evolves
Effective use requires understanding of both RSI momentum principles and Donchian Channel breakout concepts
Risk management practices (stop losses, position sizing, diversification) are essential for any trading application
Consider combining with additional analytical tools such as volume analysis, price action patterns, or trend indicators for confirmation
Backtest thoroughly on your specific instruments and timeframes before live trading implementation
Be aware that optimization on historical data may lead to curve-fitting and poor forward performance
The indicator performs best when used as part of a comprehensive trading methodology that incorporates multiple forms of market analysis, sound risk management, and realistic expectations about win rates and drawdowns.

Institutional Activity DetectorInstitutional Activity Detector - Complete Tutorial
Table of Contents
Installation
Understanding the Indicator
Signal Interpretation
Settings Configuration
Trading Strategies
Best Practices
Common Mistakes to Avoid
1. Installation {#installation}
Step-by-Step Setup:
Step 1: Access TradingView
Go to TradingView.com
Log in to your account (free account works fine)
Step 2: Open Pine Editor
Click on "Pine Editor" at the bottom of the chart
If you don't see it, go to the top menu and select "Pine Editor"
Step 3: Add the Script
Click "New" to create a new indicator
Delete any default code
Copy the entire Institutional Activity Detector code
Paste it into the editor
Step 4: Save and Apply
Click "Save" (give it a name like "Inst Detector")
Click "Add to Chart"
The indicator will now appear on your chart
2. Understanding the Indicator {#understanding}
What It Detects:
This indicator identifies institutional traders (banks, hedge funds, market makers) by analyzing:
Volume Analysis
Detects unusual volume spikes that indicate large players entering
Compares current volume to 20-period average
Institutional trades create volume 2-5x normal levels
Order Flow
Delta: Difference between buying and selling volume
Positive delta = More buying pressure
Negative delta = More selling pressure
Institutions leave "footprints" in order flow
Price Action Patterns
Bullish Rejection Wicks:
| <- Small upper wick
|
███ <- Small body
███
|
|
| <- Large lower wick (rejection)
Indicates institutions bought aggressively at lower prices
Bearish Rejection Wicks:
|
|
| <- Large upper wick (rejection)
|
███ <- Small body
███
| <- Small lower wick
Indicates institutions sold aggressively at higher prices
Liquidity Grabs
Institutions often:
Push price above resistance or below support
Trigger stop losses (grab liquidity)
Reverse direction and trade the other way
Dark Pool Activity
Large block trades executed off-exchange:
High volume with minimal price movement
Indicates institutional accumulation/distribution without moving price
3. Signal Interpretation {#signals}
Signal Types:
🟢 INSTITUTIONAL BUY Signal
Appears as green triangle below candle with strength number (2-5)
What it means:
Institutions are actively accumulating (buying)
Higher strength = More confirmation factors
Strength Levels:
2-3: Moderate confidence - Wait for confirmation
4: High confidence - Strong institutional interest
5: Maximum confidence - Multiple factors aligned
🔴 INSTITUTIONAL SELL Signal
Appears as red triangle above candle with strength number (2-5)
What it means:
Institutions are actively distributing (selling)
Higher strength = More confirmation factors
🟠 Dark Pool (DP) Marker
Small orange diamond
What it means:
Large block trade executed
Accumulation/distribution happening quietly
Often precedes significant moves
Liquidity Zones
Red boxes above price = Resistance/sell liquidity
Green boxes below price = Support/buy liquidity
Institutions target these zones to trigger stops
4. Settings Configuration {#settings}
Recommended Settings by Asset Type:
For Stocks (SPY, AAPL, TSLA):
Volume Spike Multiplier: 2.0
Volume Average Period: 20
Delta Threshold: 70%
Minimum Signal Strength: 3
Timeframe: 5m, 15m, 1H
For Forex (EUR/USD, GBP/USD):
Volume Spike Multiplier: 1.5
Volume Average Period: 30
Delta Threshold: 65%
Minimum Signal Strength: 3
Timeframe: 15m, 1H, 4H
For Crypto (BTC, ETH):
Volume Spike Multiplier: 2.5
Volume Average Period: 20
Delta Threshold: 70%
Minimum Signal Strength: 4
Timeframe: 15m, 1H, 4H
For Futures (ES, NQ):
Volume Spike Multiplier: 2.0
Volume Average Period: 20
Delta Threshold: 75%
Minimum Signal Strength: 3
Timeframe: 5m, 15m, 30m
Parameter Explanations:
Volume Spike Multiplier (1.0 - 10.0)
Lower = More sensitive (more signals, some false)
Higher = Less sensitive (fewer signals, more reliable)
Start with 2.0 and adjust based on your asset's volatility
Delta Threshold % (50 - 100)
Measures buying vs selling pressure
70% = Strong institutional bias required
Lower for ranging markets, higher for trending
Minimum Signal Strength (2 - 5)
Number of factors that must align for a signal
2 = Very sensitive (many signals)
5 = Very conservative (rare signals)
Recommended: 3-4 for balance
5. Trading Strategies {#strategies}
Strategy 1: Liquidity Grab Reversal
Setup:
Price approaches a liquidity zone (green/red box)
Price penetrates the zone briefly
Institutional BUY/SELL signal appears
Price reverses away from the zone
Entry:
Enter on the signal candle close
Or wait for next candle confirmation
Stop Loss:
Below the liquidity grab low (for buys)
Above the liquidity grab high (for sells)
Take Profit:
2:1 or 3:1 risk/reward ratio
Or next opposing liquidity zone
Example:
Price drops below support → Triggers stops →
Institutional BUY signal (4-5 strength) →
Enter LONG → Price rallies
Strategy 2: Trend Continuation
Setup:
Identify the trend (higher highs/higher lows for uptrend)
Wait for pullback to support in uptrend
Institutional BUY signal appears during pullback
Confirms institutions are adding to positions
Entry:
Enter on signal with strength ≥ 4
Or next candle after signal
Stop Loss:
Below the pullback low + small buffer
Take Profit:
Previous swing high
Or trailing stop using ATR
Strategy 3: Dark Pool Accumulation
Setup:
Dark Pool (DP) markers appear multiple times
Price consolidates in tight range
Institutional BUY signal with high strength appears
Breakout occurs
Entry:
Enter on breakout candle after signal
Or on retest of breakout level
Stop Loss:
Below consolidation range
Take Profit:
Measured move (height of consolidation projected)
Strategy 4: Divergence Play
Setup:
Price makes lower low
MFI/RSI makes higher low (bullish divergence)
Institutional BUY signal appears
Volume confirms with spike
Entry:
Enter on signal candle or next
Stop Loss:
Below the divergence low
Take Profit:
Previous swing high or resistance
6. Best Practices {#best-practices}
✅ DO's:
1. Use Multiple Timeframes
Check higher timeframe for trend direction
Trade signals that align with higher timeframe
Example: 15m signals in direction of 1H trend
2. Combine with Key Levels
Support/resistance
Supply/demand zones
Previous day high/low
Round numbers (psychological levels)
3. Wait for Confirmation
Don't rush into trades
Let the signal candle close
Watch next candle for follow-through
4. Check the Metrics Table
Look at Relative Volume (should be >2.0)
Check Delta % (should be strong positive/negative)
Verify Order Flow aligns with signal
5. Consider Market Context
News events can override signals
Low liquidity times (lunch, overnight) less reliable
Major economic releases need caution
6. Paper Trade First
Test the indicator for 2-4 weeks
Learn how it behaves on your chosen assets
Develop confidence before using real money
Best Times to Trade:
Stock Market Hours:
9:30-11:30 AM EST (high volume, strong moves)
2:00-4:00 PM EST (institutional positioning)
Avoid: 11:30 AM-2:00 PM (lunch, low volume)
Forex:
London Open: 3:00-6:00 AM EST
New York Open: 8:00-11:00 AM EST
London/NY Overlap: 8:00 AM-12:00 PM EST
Crypto:
24/7 market, but highest volume during US/European hours
Watch for weekend low liquidity
7. Common Mistakes to Avoid {#mistakes}
❌ DON'T:
1. Trade Every Signal
Not all signals are equal
Focus on strength 4-5 signals
Wait for optimal setups
2. Ignore Market Structure
Don't buy into strong downtrends (catch falling knife)
Don't sell into strong uptrends (fight the tape)
Respect major support/resistance
3. Use Too Small Timeframes
1m and 2m charts are too noisy
Minimum recommended: 5m for scalping
Better: 15m, 30m, 1H for reliability
4. Overtrade
Quality over quantity
2-5 good trades per day is excellent
Forcing trades leads to losses
5. Ignore Risk Management
Always use stop losses
Risk only 1-2% per trade
Don't revenge trade after losses
6. Trade During Low Volume
Signals less reliable with low volume
Check Relative Volume metric (should be >1.5)
Avoid pre-market/after-hours for stocks
7. Misread Liquidity Grabs
Not every wick is a liquidity grab
Need volume confirmation
Must have institutional signal
Advanced Tips:
Filtering False Signals:
Use Signal Strength Filter:
Minimum strength 3 = Balanced
Minimum strength 4 = Conservative (recommended)
Minimum strength 5 = Ultra conservative
Confluence Checklist:
Signal strength ≥ 4
Relative volume > 2.0
At key support/resistance
Aligns with higher timeframe trend
Delta % strongly positive/negative
Clean price action setup
If 4+ boxes checked = High probability trade
Setting Up Alerts:
Click the three dots on the indicator
Select "Create Alert"
Choose condition:
"Institutional Buy Signal"
"Institutional Sell Signal"
"Dark Pool Activity"
Set up notification (email, SMS, app)
Save alert
Alert Strategy:
Set minimum strength to 4 for fewer, better alerts
Use for assets you can't watch constantly
Don't rely solely on alerts - check chart context
Practice Exercise:
Week 1-2: Observation
Add indicator to your favorite assets
Watch how signals develop
Note which ones lead to profitable moves
Don't trade yet - just observe
Week 3-4: Paper Trading
Use TradingView's paper trading
Trade only strength 4-5 signals
Record results in a journal
Note: entry, exit, profit/loss, what worked/didn't
Week 5+: Small Live Positions
Start with smallest position size
Trade only your best setups
Gradually increase size as you gain confidence
Keep detailed journal
Quick Reference Card:
Signal Quality Ranking:
🔥 Best Setups (Take These):
Strength 5 + Liquidity grab + Key level
Strength 4-5 + Volume >3.0 + Trend alignment
Dark Pool markers + Strength 4+ signal
✅ Good Setups:
Strength 4 at support/resistance
Strength 3-4 with strong delta
Liquidity grab + Strength 3+
⚠️ Caution (Wait for More):
Strength 2-3 in middle of nowhere
Against higher timeframe trend
Low volume (Rel Vol <1.5)
❌ Avoid:
Strength 2 only
During major news
Low liquidity hours
Against strong trend
Troubleshooting:
"Too many signals"
→ Increase Minimum Signal Strength to 4
→ Increase Volume Spike Multiplier to 2.5-3.0
"Too few signals"
→ Decrease Minimum Signal Strength to 2-3
→ Decrease Volume Spike Multiplier to 1.5
"Signals not working"
→ Check if you're trading during low volume hours
→ Verify you're using recommended timeframes
→ Make sure signals align with market structure
"Can't see liquidity zones"
→ Enable "Show Liquidity Zones" in settings
→ Adjust Swing Detection Length (try 7-15)
Resources for Further Learning:
Concepts to Study:
Order Flow Trading
Market Profile / Volume Profile
Smart Money Concepts (SMC)
Liquidity Sweeps and Stop Hunts
Institutional Order Flow
Wyckoff Method
Volume Spread Analysis (VSA)
Recommended Practice:
Study past signals on chart
Replay market using TradingView's bar replay feature
Join trading communities to share setups
Keep a detailed trading journal
Final Thoughts:
This indicator is a tool, not a crystal ball. It identifies high-probability setups where institutions are active, but still requires:
Proper risk management
Market context understanding
Patience and discipline
Continuous learning
Success Formula:
Right Tool + Proper Training + Risk Management + Discipline = Consistent Profits
Start slow, master the basics, and gradually increase complexity as you gain experience.
Good luck and trade smart! 📊📈

GEX Options Flow Pro 100% free
INTRODUCTION
This script is designed to visualize advanced options-derived metrics and levels on TradingView charts, including Gamma Exposure (GEX) walls, gamma flip points, vanna levels, delta-neutral prices (DEX), max pain, implied moves, and more. It overlays dynamic lines, labels, boxes, and an info table to highlight potential support, resistance, volatility regimes, and flow dynamics based on options data.
These visualizations aim to help users understand how options market structure might influence price action, such as areas of potential stability (positive GEX) or volatility (negative GEX). All data is user-provided via pasted strings, as Pine Script cannot fetch external options data directly due to platform limitations (detailed below).
The script is open-source under TradingView's terms, allowing study, modification, and improvement. It draws inspiration from standard options Greeks and exposure metrics (e.g., gamma, vanna, charm) discussed in financial literature like Black-Scholes models and dealer positioning analyses. No external code is copied; all logic is original or based on mathematical formulas.
Disclaimer: This is an educational tool only. It does not provide investment advice, trading signals, or guarantees of performance. Past data is not indicative of future results. Use at your own risk, and combine with your own analysis. Not intended for qualified investors only.
How the Options Levels Are Calculated
Levels are not computed in Pine Script—they rely on pre-calculated values from external tools (e.g., Python scripts using libraries like yfinance for options chains). Here's how they're typically derived externally before pasting into the script:
Fetching Options Data: Retrieve options chain for a ticker: strikes, open interest (OI), volume, implied volatility (IV), expirations (e.g., shortest: 0-7 DTE, short: 7-14 DTE, medium: ~30 DTE, long: ~90 DTE). Get current price and 5-day history for context.
Gamma Walls (Put/Call Walls): Compute gamma for each option using Black-Scholes: gamma = N'(d1) / (S * σ * √T) where S = spot price, K = strike, T = time to expiration (years), σ = IV, N'(d1) = normal PDF. Aggregate GEX at strikes: GEX = sign * gamma * OI * 100 * S^2 * 0.01 (per 1% move, with sign based on dealer positioning: typically short calls/puts = negative GEX). Put Wall: Highest absolute GEX put strike below S (support via dealer buying on dips). Call Wall: Highest absolute GEX call strike above S (resistance via dealer selling on rallies). Secondary/Tertiary: Next highest levels. Historical walls track tier-1 levels over 5 days.
Gamma Flip: Net GEX profile across prices: Sum GEX for all options at hypothetical spots. Flip point: Interpolated price where net GEX changes sign (stable above, volatile below).
Vanna Levels: Vanna = -N'(d1) * d2 / σ. Weighted by OI; highest positive/negative strikes.
DEX (Delta-Neutral Price): Net dealer delta: Sum (delta * OI * 100 * sign), with delta from Black-Scholes. DEX: Price where net delta = 0 (interpolated).
Max Pain: Strike minimizing total intrinsic value for all options holders.
Skew: 25-delta skew: IV difference between 25-delta put and call (interpolated).
Net GEX/Delta: Total signed GEX/delta at current S.
Implied Move: ATM IV * √(DTE/365) for 1σ range.
C/P Ratio: (Call OI + volume) / (Put OI + volume).
Smart Stop Loss: Below lowest support (e.g., Put Wall, gamma flip), buffered by IV * √(DTE/30).
Other Metrics: IV: ATM average. 5-day metrics: Avg volume, high/low.
External tools handle dealer assumptions (e.g., short calls/puts) and scaling (per % move).
Effect as Support and Resistance in Technical Trading
Options levels reflect dealer hedging dynamics:
Put Wall (Gamma Support): High put GEX creates buying pressure on dips (dealers hedge short puts by buying stock). Use for long entries, bounces, or stops below.
Call Wall (Gamma Resistance): High call GEX leads to selling on rallies. Good for trims, shorts, or reversals.
Gamma Flip: Pivot for volatility—above: dampened moves (positive GEX, mean reversion); below: amplified trends (negative GEX, momentum).
Vanna Levels: Sensitivity to IV changes; crosses may signal vol shifts.
DEX: Dealer delta neutral—bullish if price below with positive delta.
Max Pain: Price magnet minimizing option payouts.
Implied Move/Confidence Bands: Expected ranges (1σ/2σ/3σ); breakouts suggest extremes.
Liquidity Zones: Wall ranges as price magnets.
Smart Stop Loss: Protective level below supports, IV-adjusted.
C/P Ratio & Skew: Sentiment (high C/P = bullish; high skew = put demand).
Net GEX: Positive = low vol strategies (e.g., condors); negative = momentum trades.
Combine with TA (e.g., volume, trends). High activity strengthens effects; alerts on crosses/proximities for awareness.
Limitations of the TradingView Platform for Data Pulling
Pine Script is sandboxed:
No API calls or internet access (can't fetch options data directly).
Limited to chart/symbol data; no real-time chains.
Inputs static per load; manual updates needed.
Caching not persistent across sessions.
This ensures lightweight scripts but requires external data sourcing.
Creative Solution for On-Demand Data Pulling
Users can use external tools (e.g., Python scripts with yfinance) to fetch/compute data on demand. Generate a formatted string (ticker,timestamp|term1_data|term2_data|...), paste into inputs. Tools can process multiple tickers, cache for ~15-30 min, and output strings for quick portfolio scanning. Run locally or via custom setups for near-real-time updates without platform violations.
For convenience, a free bot is available on my website that accepts commands like !gex to generate both current data strings (for all expiration terms) and historical walls data on demand. This allows users to easily obtain fresh or cached data (refreshed every ~30 min) for pasting into the indicator—ideal for scanning portfolios without manual coding.
Script Functionality Breakdown
Inputs: Data strings (current/historical); term selector (Shortest/Short/Medium/Long); toggles (historical walls, GEX profile, secondaries, vanna, table, max pain, DEX, stop loss, implied move, liquidity, bands); colors/styles.
Parsing: Extracts term-specific data; validates ticker match; gets timestamp for freshness.
Drawing: Dynamic lines/labels (width/color by GEX strength); boxes (moves, zones, bands); clears on updates.
Info Table: Dashboard with status (freshness emoji), Greeks (GEX/delta with emojis), vol (IV/skew), levels (distances), flow (C/P, vol vs 5D).
Historical Walls: Displays past tier-1 walls on daily+ timeframes.
Alerts: 20+ conditions (e.g., near/cross walls, GEX sign change, high IV).
Performance: Efficient for real-time; smart label positioning.
Release Notes
Initial release: Full features including multi-term support, enhanced table with emojis/sentiment, dynamic visuals, smart stop loss.
Data String Format: TICKER,TIMESTAMP|TERM1_DATA|TERM2_DATA|TERM3_DATA|TERM4_DATA Where each TERM_DATA = val0,val1,...,val30 (31 floats: current_price, prev_close, call_wall_1, call_wall_1_gex, ..., low_5d). Historical: TICKER|TERM1_HIST|... where TERM_HIST = date:cw,pw;date:cw,pw;...
Feedback welcome in comments. Educational only—not advice.

Extreme Pressure Zones Indicator (EPZ) [BullByte]Extreme Pressure Zones Indicator(EPZ)
The Extreme Pressure Zones (EPZ) Indicator is a proprietary market analysis tool designed to highlight potential overbought and oversold "pressure zones" in any financial chart. It does this by combining several unique measurements of price action and volume into a single, bounded oscillator (0–100). Unlike simple momentum or volatility indicators, EPZ captures multiple facets of market pressure: price rejection, trend momentum, supply/demand imbalance, and institutional (smart money) flow. This is not a random mashup of generic indicators; each component was chosen and weighted to reveal extreme market conditions that often precede reversals or strong continuations.
What it is?
EPZ estimates buying/selling pressure and highlights potential extreme zones with a single, bounded 0–100 oscillator built from four normalized components. Context-aware weighting adapts to volatility, trendiness, and relative volume. Visual tools include adaptive thresholds, confirmed-on-close extremes, divergence, an MTF dashboard, and optional gradient candles.
Purpose and originality (not a mashup)
Purpose: Identify when pressure is building or reaching potential extremes while filtering noise across regimes and symbols.
Originality: EPZ integrates price rejection, momentum cascade, pressure distribution, and smart money flow into one bounded scale with context-aware weighting. It is not a cosmetic mashup of public indicators.
Why a trader might use EPZ
EPZ provides a multi-dimensional gauge of market extremes that standalone indicators may miss. Traders might use it to:
Spot Reversals: When EPZ enters an "Extreme High" zone (high red), it implies selling pressure might soon dominate. This can hint at a topside reversal or at least a pause in rallies. Conversely, "Extreme Low" (green) can highlight bottom-fish opportunities. The indicator's divergence module (optional) also finds hidden bullish/bearish divergences between price and EPZ, a clue that price momentum is weakening.
Measure Momentum Shifts: Because EPZ blends momentum and volume, it reacts faster than many single metrics. A rising MPO indicates building bullish pressure, while a falling MPO shows increasing bearish pressure. Traders can use this like a refined RSI: above 50 means bullish bias, below 50 means bearish bias, but with context provided by the thresholds.
Filter Trades: In trend-following systems, one could require EPZ to be in the bullish (green) zone before taking longs, or avoid new trades when EPZ is extreme. In mean-reversion systems, one might specifically look to fade extremes flagged by EPZ.
Multi-Timeframe Confirmation: The dashboard can fetch a higher timeframe EPZ value. For example, you might trade a 15-minute chart only when the 60-minute EPZ agrees on pressure direction.
Components and how they're combined
Rejection (PRV) – Captures price rejection based on candle wicks and volume (see Price Rejection Volume).
Momentum Cascade (MCD) – Blends multiple momentum periods (3,5,8,13) into a normalized momentum score.
Pressure Distribution (PDI) – Measures net buy/sell pressure by comparing volume on up vs down candles.
Smart Money Flow (SMF) – An adaptation of money flow index that emphasizes unusual volume spikes.
Each of these components produces a 0–100 value (higher means more bullish pressure). They are then weighted and averaged into the final Market Pressure Oscillator (MPO), which is smoothed and scaled. By combining these four views, EPZ stands out as a comprehensive pressure gauge – the whole is greater than the sum of parts
Context-aware weighting:
Higher volatility → more PRV weight
Trendiness up (RSI of ATR > 25) → more MCD weight
Relative volume > 1.2x → more PDI weight
SMF holds a stable weight
The weighted average is smoothed and scaled into MPO ∈ with 50 as the neutral midline.
What makes EPZ stand out
Four orthogonal inputs (price action, momentum, pressure, flow) unified in a single bounded oscillator with consistent thresholds.
Adaptive thresholds (optional) plus robust extreme detection that also triggers on crossovers, so static thresholds work reliably too.
Confirm Extremes on Bar Close (default ON): dots/arrows/labels/alerts print on closed bars to avoid repaint confusion.
Clean dashboard, divergence tools, pre-alerts, and optional on-price gradients. Visual 3D layering uses offsets for depth only,no lookahead.
Recommended markets and timeframes
Best: liquid symbols (index futures, large-cap equities, major FX, BTC/ETH).
Timeframes: 5–15m (more signals; consider higher thresholds), 1H–4H (balanced), 1D (clear regimes).
Use caution on illiquid or very low TFs where wick/volume geometry is erratic.
Logic and thresholds
MPO ∈ ; 50 = neutral. Above 50 = bullish pressure; below 50 = bearish.
Static thresholds (defaults): thrHigh = 70, thrLow = 30; warning bands 5 pts inside extremes (65/35).
Adaptive thresholds (optional):
thrHigh = min(BaseHigh + 5, mean(MPO,100) + stdev(MPO,100) × ExtremeSensitivity)
thrLow = max(BaseLow − 5, mean(MPO,100) − stdev(MPO,100) × ExtremeSensitivity)
Extreme detection
High: MPO ≥ thrHigh with peak/slope or crossover filter.
Low: MPO ≤ thrLow with trough/slope or crossover filter.
Cooldown: 5 bars (default). A new extreme will not print until the cooldown elapses, even if MPO re-enters the zone.
Confirmation
"Confirm Extremes on Bar Close" (default ON) gates extreme markers, pre-alerts, and alerts to closed bars (non-repainting).
Divergences
Pivot-based bullish/bearish divergence; tags appear only after left/right bars elapse (lookbackPivot).
MTF
HTF MPO retrieved with lookahead_off; values can update intrabar and finalize at HTF close. This is disclosed and expected.
Inputs and defaults (key ones)
Core: Sensitivity=1.0; Analysis Period=14; Smoothing=3; Adaptive Thresholds=OFF.
Extremes: Base High=70, Base Low=30; Extreme Sensitivity=1.5; Confirm Extremes on Bar Close=ON; Cooldown=5; Dot size Small/Tiny.
Visuals: Heatmap ON; 3D depth optional; Strength bars ON; Pre-alerts OFF; Divergences ON with tags ON; Gradient candles OFF; Glow ON.
Dashboard: ON; Position=Top Right; Size=Normal; MTF ON; HTF=60m; compact overlay table on price chart.
Advanced caps: Max Oscillator Labels=80; Max Extreme Guide Lines=80; Divergence objects=60.
Dashboard: what each element means
Header: EPZ ANALYSIS.
Large readout: Current MPO; color reflects state (extreme, approaching, or neutral).
Status badge: "Extreme High/Low", "Approaching High/Low", "Bullish/Neutral/Bearish".
HTF cell (when MTF ON): Higher-timeframe MPO, color-coded vs extremes; updates intrabar, settles at HTF close.
Predicted (when MTF OFF): Simple MPO extrapolation using momentum/acceleration—illustrative only.
Thresholds: Current thrHigh/thrLow (static or adaptive).
Components: ASCII bars + values for PRV, MCD, PDI, SMF.
Market metrics: Volume Ratio (x) and ATR% of price.
Strength: Bar indicator of |MPO − 50| × 2.
Confidence: Heuristic gauge (100 in extremes, 70 in warnings, 50 with divergence, else |MPO − 50|). Convenience only, not probability.
How to read the oscillator
MPO Value (0–100): A reading of 50 is neutral. Values above ~55 are increasingly bullish (green), while below ~45 are increasingly bearish (red). Think of these as "market pressure".
Extreme Zones: When MPO climbs into the bright orange/red area (above the base-high line, default 70), the chart will display a dot and downward arrow marking that extreme. Traders often treat this as a sign to tighten stops or look for shorts. Similarly, a bright green dot/up-arrow appears when MPO falls below the base-low (30), hinting at a bullish setup.
Heatmap/Candles: If "Pressure Heatmap" is enabled, the background of the oscillator pane will fade green or red depending on MPO. Users can optionally color the price candles by MPO value (gradient candles) to see these extremes on the main chart.
Prediction Zone(optional): A dashed projection line extends the MPO forward by a small number of bars (prediction_bars) using current MPO momentum and acceleration. This is a heuristic extrapolation best used for short horizons (1–5 bars) to anticipate whether MPO may touch a warning or extreme zone. It is provisional and becomes less reliable with longer projection lengths — always confirm predicted moves with bar-close MPO and HTF context before acting.
Divergences: When price makes a higher high but EPZ makes a lower high (bearish divergence), the indicator can draw dotted lines and a "Bear Div" tag. The opposite (lower low price, higher EPZ) gives "Bull Div". These signals confirm waning momentum at extremes.
Zones: Warning bands near extremes; Extreme zones beyond thresholds.
Crossovers: MPO rising through 35 suggests easing downside pressure; falling through 65 suggests waning upside pressure.
Dots/arrows: Extreme markers appear on closed bars when confirmation is ON and respect the 5-bar cooldown.
Pre-alert dots (optional): Proximity cues in warning zones; also gated to bar close when confirmation is ON.
Histogram: Distance from neutral (50); highlights strengthening or weakening pressure.
Divergence tags: "Bear Div" = higher price high with lower MPO high; "Bull Div" = lower price low with higher MPO low.
Pressure Heatmap : Layered gradient background that visually highlights pressure strength across the MPO scale; adjustable intensity and optional zone overlays (warning / extreme) for quick visual scanning.
A typical reading: If the oscillator is rising from neutral towards the high zone (green→orange→red), the chart may see strong buying culminating in a stall. If it then turns down from the extreme, that peak EPZ dot signals sell pressure.
Alerts
EPZ: Extreme Context — fires on confirmed extremes (respects cooldown).
EPZ: Approaching Threshold — fires in warning zones if no extreme.
EPZ: Divergence — fires on confirmed pivot divergences.
Tip: Set alerts to "Once per bar close" to align with confirmation and avoid intrabar repaint.
Practical usage ideas
Trend continuation: In positive regimes (MPO > 50 and rising), pullbacks holding above 50 often precede continuation; mirror for bearish regimes.
Exhaustion caution: E High/E Low can mark exhaustion risk; many wait for MPO rollover or divergence to time fades or partial exits.
Adaptive thresholds: Useful on assets with shifting volatility regimes to maintain meaningful "extreme" levels.
MTF alignment: Prefer setups that agree with the HTF MPO to reduce countertrend noise.
Examples
Screenshots captured in TradingView Replay to freeze the bar at close so values don't fluctuate intrabar. These examples use default settings and are reproducible on the same bars; they are for illustration, not cherry-picking or performance claims.
Example 1 — BTCUSDT, 1h — E Low
MPO closed at 26.6 (below the 30 extreme), printing a confirmed E Low. HTF MPO is 26.6, so higher-timeframe pressure remains bearish. Components are subdued (Momentum/Pressure/Smart$ ≈ 29–37), with Vol Ratio ≈ 1.19x and ATR% ≈ 0.37%. A prior Bear Div flagged weakening impulse into the drop. With cooldown set to 5 bars, new extremes are rate-limited. Many traders wait for MPO to curl up and reclaim 35 or for a fresh Bull Div before considering countertrend ideas; if MPO cannot reclaim 35 and HTF stays weak, treat bounces cautiously. Educational illustration only.
Example 2 — ETHUSD, 30m — E High
A strong impulse pushed MPO into the extreme zone (≥ 70), printing a confirmed E High on close. Shortly after, MPO cooled to ~61.5 while a Bear Div appeared, showing momentum lag as price pushed a higher high. Volume and volatility were elevated (≈ 1.79x / 1.25%). With a 5-bar cooldown, additional extremes won't print immediately. Some treat E High as exhaustion risk—either waiting for MPO rollover under 65/50 to fade, or for a pullback that holds above 50 to re-join the trend if higher-timeframe pressure remains constructive. Educational illustration only.
Known limitations and caveats
The MPO line itself can change intrabar; extreme markers/alerts do not repaint when "Confirm Extremes on Bar Close" is ON.
HTF values settle at the close of the HTF bar.
Illiquid symbols or very low TFs can be noisy; consider higher thresholds or longer smoothing.
Prediction line (when enabled) is a visual extrapolation only.
For coders
Pine v6. MTF via request.security with lookahead_off.
Extremes include crossover triggers so static thresholds also yield E High/E Low.
Extreme markers and pre-alerts are gated by barstate.isconfirmed when confirmation is ON.
Arrays prune oldest objects to respect resource limits; defaults (80/80/60) are conservative for low TFs.
3D layering uses negative offsets purely for drawing depth (no lookahead).
Screenshot methodology:
To make labels legible and to demonstrate non-repainting behavior, the examples were captured in TradingView Replay with "Confirm Extremes on Bar Close" enabled. Replay is used only to freeze the bar at close so plots don't change intrabar. The examples use default settings, include both Extreme Low and Extreme High cases, and can be reproduced by scrolling to the same bars outside Replay. This is an educational illustration, not a performance claim.
Disclaimer
This script is for educational purposes only and does not constitute financial advice. Markets involve risk; past behavior does not guarantee future results. You are responsible for your own testing, risk management, and decisions.

Dr.Yazdani V063 Session OR + A-Lines
**ACD Indicator: Mark Fisher's Opening Range Breakout Strategy**
**Overview**
The ACD system, developed by legendary trader Mark Fisher in his book *The Logical Trader*, is a powerful methodology for identifying high-probability trade setups based on the market's opening range (OR). This indicator automates Layers 1 and 2 of the ACD strategy, helping you spot breakout opportunities, trend direction, and key support/resistance levels. Perfect for day traders, scalpers, and swing traders in forex, stocks, futures, or crypto.
**How It Works**
1. **Opening Range (OR)**: Calculated from the high/low of the first X minutes (default: 30-60 min) of major sessions (e.g., Tokyo, London, New York).
2. **A Levels**: Drawn at a percentage (default: 0.5% of OR range or ATR-based) above/below the OR. A breakout above A-Up signals a bullish setup; below A-Down signals bearish.
3. **C Levels**: Wider levels (default: 1-2% or ATR multiplier) for stronger confirmation. Breakouts here confirm trend strength and filter fakeouts.
4. **Pivot Ranges**: Includes daily and N-day pivots to gauge overall market bias (above pivots = bullish; below = bearish).
**Key Features**
- **Customizable Sessions**: Tokyo (00:00-01:00 GMT), London (08:00-09:00 GMT), New York (13:30-14:30 GMT) – adjustable.
- **ATR Integration**: Uses Average True Range for dynamic A/C levels (period: 14 by default).
- **Visual Alerts**: Color-coded lines (green for bullish, red for bearish) + optional labels for breakouts.
- **Pivot Display**: Show/hide daily or multi-day pivots with customizable colors.
- **Risk Management**: Built-in stop-loss suggestions based on OR width.
**Trading Rules**
- **Bullish Setup**: Price breaks and holds above A-Up → Enter long at C-Up confirmation. Target: Next pivot or 1:2 risk-reward.
- **Bearish Setup**: Price breaks below A-Down → Enter short at C-Down.
- **Avoid Fakeouts**: Wait for stabilization (e.g., close above/below level).
- **Trend Filter**: Combine with PMA (Pivot Moving Average) for Layer 3 confirmation (search "ACD PMA" in TradingView).
**Settings Guide**
- **OR Timeframe**: Session start time and duration (e.g., 30 min).
- **A Multiplier (%)**: Distance for A levels (default: 0.5).
- **C Multiplier (%)**: Distance for C levels (default: 1.0).
- **ATR Period**: For volatility-based levels (default: 14).
- **Show Pivots**: Toggle daily/N-day ranges.
This indicator balances supply/demand by analyzing volume and price action within the opening range. Backtest on your favorite pairs (e.g., EURUSD, BTCUSD) and adjust for your style. Not financial advice – always use proper risk management!
**Inspired by**: Mark Fisher's ACD Methodology. Open-source for community review. Questions? Comment below!
#ACD #OpeningRange #Breakout #DayTrading #FisherStrategy

Tape Speed Pulse (Pace + Direction) [v6 + Climax]Tape Speed Pulse (Pace + Direction)
One-liner:
A lightweight “tape pulse” that turns intraday bursts of buying/selling into an easy-to-read histogram, with surge, slowdown, and climax (exhaustion) markers for fast decision-making. Use on sec and min charts.
What it measures
Pace (RVOL): current bar volume vs the recent average (smoothed).
Direction proxy: uptick/downtick by comparing close to close .
Pulse (histogram): direction × pace, so you see who’s pushing and how fast.
Colors
- Lime = Buy surge (pace ≥ threshold & upticking)
- Red = Sell surge (pace ≥ threshold & downticking)
- Teal = Buy pressure, sub-threshold
- Orange = Sell pressure, sub-threshold
- Faded/gray = Near-neutral pace (below the Neutral Band)
Lines (toggleable)
-White = Pace (RVOL)
- Yellow = Slowdown line = a drop of X% from the last 30-bar peak pace
Background tint mirrors the current state so you can glance risk: greenish for buy pressure, reddish for sell pressure.
Signals & alerts
- BUY surge – fires when pace crosses above the surge threshold with uptick direction (optional acceleration & uptick streak filters; cooldown prevents spam).
- SELL surge – mirror logic to downside.
- Slowdown – fires when pace crosses below the yellow slowdown line while direction ≤ 0 (early fade warning).
Climax (exhaustion)
- Buy Climax: previous bar was a buy surge with a large upper wick; current bar slows (below slowdown line) and direction ≤ 0.
- Sell Climax: mirror (large lower wick → slowdown → direction ≥ 0).
- Great for trimming/tight stops or fade setups at obvious spikes.
- Create alerts via Add alert → Condition: this indicator → choose the specific alert (BUY surge, SELL surge, Slowdown, Buy Climax, Sell Climax).
How to use it (playbook)
- Longs (e.g., VWAP reclaim / micro pullback)
- Only take entries when the pulse is teal→lime (buy pressure to buy surge).
- Into prior highs/VWAP bands, take partials on lime spikes.
- If you get a Slowdown dot and bars turn orange/red, tighten or exit.
Shorts (failed reclaim / lower-high)
- Look for teal→orange→red with rising pace at a level.
- Add confidence if a Buy Climax printed right before (exhaustion).
- Risk above the spike; don’t fight true ignitions out of bases.
Simple guardrails
- Avoid new longs when the histogram is orange/red; avoid new shorts when teal/lime.
- Use with VWAP + 9/20 EMA or your levels. The pulse is confirmation, not the whole thesis.
Inputs (what they do & when to tweak)
- Pace lookback (bars) – window for average volume. Lower = faster; higher = steadier.
Too jumpy? raise it. Missing quick bursts? lower it.
- Smoothing EMA (bars) – smooths pace. Higher = calmer.
Use 4–6 during the open; 3–4 midday.
- Surge threshold (× RVOL) – how fast counts as a surge.
Too many surges? raise it. Too late? lower it slightly.
- Slowdown drop from 30-bar max (%) – how far below the recent peak pace to call a slowdown.
Higher % = later slowdown; lower % = earlier warning.
- Neutral band (× RVOL) – paces below this fade to gray.
Raise to clean up noise; lower to see subtle pressure.
- Min seconds between signals – cooldown to prevent spam.
Increase in chop; reduce if you want more pings.
- BUY/SELL: min consecutive upticks/downticks – tiny streak filter.
Raise to avoid wiggles; lower for earlier signals.
Require pace accelerating into signal – ON = avoid stall breakouts; OFF = earlier pings.
Climax options: wick % threshold & “require slowdown cross”.
Raise wick% / require cross to be stricter; lower to catch more fades.
Quick presets
- Low-float runner, 5–10s chart
- Lookback 20, Smoothing 3–4, Surge 2.2–2.8, Slowdown 35–45, Neutral 1.0–1.2, Cooldown 15–25s, Streaks 2–3, Accel ON.
- Thick large-cap, 1-min
- Lookback 20–30, Smoothing 5–7, Surge 1.5–1.9, Slowdown 25–35, Neutral 0.8–1.0, Cooldown 30–60s, Streaks 2, Accel ON.
- Open vs Midday vs Power Hour
- Open: higher Surge, more Smoothing, longer Cooldown.
- Midday: lower Surge, less Smoothing to catch subtler pushes.
- Power hour: moderate Surge; keep Slowdown on for exits.
Reading common patterns
- Ignition (likely continuation): lime spike out of a base that holds above a level while pace stays above yellow.
- Exhaustion (likely fade): lime spike late in a run with upper wick → Slowdown → orange/red. The Buy Climax diamond is your tell.
Limits / notes
This is an OHLCV-based proxy (TradingView Pine can’t read raw tape/DOM). It won’t match Bookmap/Jigsaw tick-for-tick, but it’s fast and objective.
Use with levels and a risk plan. Past performance ≠ future results. Educational only.
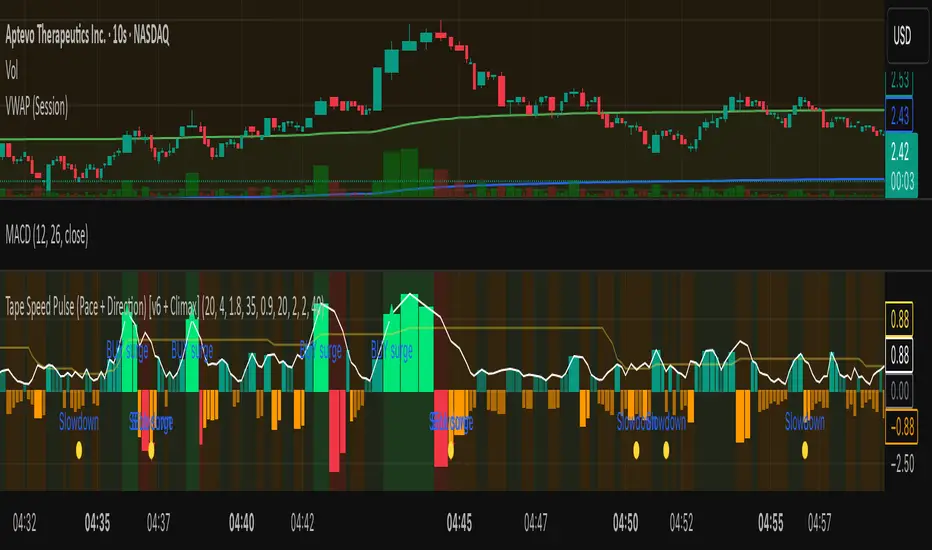
Weinstein Stage Analyzer — Table Only (more padding)What it does
This indicator applies Stan Weinstein’s Stage Analysis (Stages 1–4) and presents the result in a clean, compact table only—no lines, labels, or overlays. It shows:
• Previous Stage
• Current Stage (with Early / Mature / Late tag)
• Duration (how long price has been in the current stage, in HTF bars)
• Sentiment (Bullish / Bearish / Balanced / Cautious, derived from stage & maturity)
Timeframe-aware logic
• Weekly charts: classic 30-period MA (Weinstein’s original 30-week concept).
• Daily & Intraday: computed on Daily 150 as a practical daily translation of the 30-week idea.
• Monthly: ~7-period MA (~30 weeks ≈ 7 months).
The stage classification itself is evaluated on this HTF context and then displayed on your active chart.
EMA/SMA toggle
Choose EMA (default) or SMA for the trend line used in stage detection.
How stages are decided (practical rules)
• Stage 2 (Advance): MA rising with price above an upper band.
• Stage 4 (Decline): MA falling with price below a lower band.
• Flat MA zones become Stage 1 (Base) or Stage 3 (Top) depending on the prior trend.
“Maturity” tags (Early/Mature/Late) come from run length and extension beyond the band.
Inputs you can tweak
• MA Type: EMA / SMA
• Price Band (±%) and Slope Threshold to tighten/loosen stage flips
• Maturity thresholds: min/max bars & late-extension %
Notes
• Duration is for the entire current stage (e.g., total time in Stage 4), not just the maturity slice.
• A Top Padding Rows input is included to nudge the table lower if it overlaps your OHLC readout.
Disclaimer
For educational use only. Not financial advice. Always confirm with your own analysis, risk management, and market context.

Premarket Hi/Lo + Prior Day O/C LevelsPremarket Hi/Lo + Prior Day O/C (today only) shows four clear reference levels for the current regular trading session: the Premarket High and Premarket Low (taken from a user-defined premarket window, 04:00–09:30 by default) and Yesterday’s 09:30 Open and 15:59 Close (sourced from the 1-minute feed for accuracy). The premarket levels “lock” at the opening bell so they don’t move for the rest of the day. All four lines are displayed only during today’s regular hours to keep the chart focused. Small right-edge labels and an optional top-right mini-table show the exact values at a glance.
This indicator is designed to give immediate context without technical jargon. The premarket high/low summarize where price traveled before the bell; the prior-day open/close summarize where the last session began and ended. Checking whether price is above or below these markers helps you quickly judge strength or weakness and anticipate where price may pause, bounce, or break. Typical uses include watching for a clean break and hold above Premarket High (often bullish), a break and hold below Premarket Low (often bearish), drift back toward Prior Day Close after a gap (a common “magnet”), and flips around Prior Day Open that can lead to continuation.
Setup: Turn on Extended Hours in TradingView so premarket bars are visible (Chart Settings → Symbol → Extended Hours). Apply the indicator to any intraday timeframe. In Inputs, you can change the premarket window to match your market, adjust colors and line widths, and toggle the floating labels and the mini-table. Times use the chart’s exchange time (for US stocks, Eastern Time).
Notes and limits: Lines show only for today’s session (default 09:30–16:00). The script looks at the previous calendar day for “prior day,” so values may be empty after weekends or holidays when markets were closed. If your instrument uses different regular hours or you trade futures/crypto, adjust the premarket session in Inputs and—if needed—edit the regular-hours window in code to match. If your data source does not include premarket, the premarket lines will be blank.
Best practice: The first 15–30 minutes after the open are where these levels have the most impact. Reactions are more meaningful when a line aligns with another tool you use (e.g., VWAP or your opening range). If price does not react clearly at a line, avoid forcing a trade.
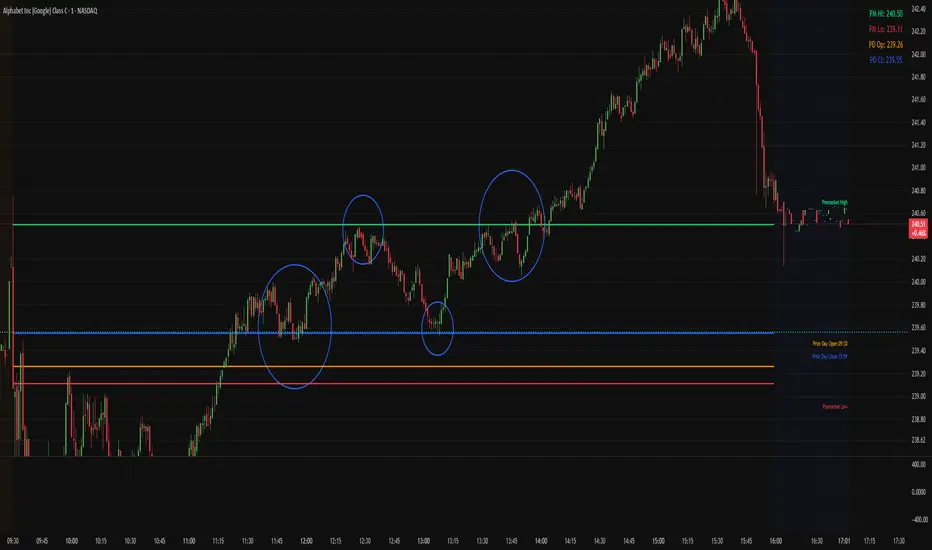
RSI ADX Bollinger Analysis High-level purpose and design philosophy
This indicator — RSI-ADX-Bollinger Analysis — is a compact, educational market-analysis toolkit that blends momentum (RSI), trend strength (ADX), volatility structure (Bollinger Bands) and simple volumetrics to provide traders a snapshot of market condition and trade idea quality. The design philosophy is explicit and layered: use each component to answer a different question about price action (momentum, conviction, volatility, participation), then combine answers to form a more robust, explainable signal. The mashup is intended for analysis and learning, not automatic execution: it surfaces the why behind signals so traders can test, learn and apply rules with risk management.
________________________________________
What each indicator contributes (component-by-component)
RSI (Relative Strength Index) — role and behavior: RSI measures short-term momentum by comparing recent gains to recent losses. A high RSI (near or above the overbought threshold) indicates strong recent buying pressure and potential exhaustion if price is extended. A low RSI (near or below the oversold threshold) indicates strong recent selling pressure and potential exhaustion or a value area for mean-reversion. In this dashboard RSI is used as the primary momentum trigger: it helps identify whether price is locally over-extended on the buy or sell side.
ADX (Average Directional Index) — role and behavior: ADX measures trend strength independently of direction. When ADX rises above a chosen threshold (e.g., 25), it signals that the market is trending with conviction; ADX below the threshold suggests range or weak trend. Because patterns and momentum signals perform differently in trending vs. ranging markets, ADX is used here as a filter: only when ADX indicates sufficient directional strength does the system treat RSI+BB breakouts as meaningful trade candidates.
Bollinger Bands — role and behavior: Bollinger Bands (20-period basis ± N standard deviations) show volatility envelope and relative price position vs. a volatility-adjusted mean. Price outside the upper band suggests pronounced extension relative to recent volatility; price outside the lower band suggests extended weakness. A band expansion (increasing width) signals volatility breakout potential; contraction signals range-bound conditions and potential squeeze. In this dashboard, Bollinger Bands provide the volatility/structural context: RSI extremes plus price beyond the band imply a stronger, volatility-backed move.
Volume split & basic MA trend — role and behavior: Buy-like and sell-like volume (simple heuristic using close>open or closeopen) or sell-like (close1.2 for validation and compare win rate and expectancy.
4. TF alignment: Accept signals only when higher timeframe (e.g., 4h) trend agrees — compare results.
5. Parameter sensitivity: Vary RSI threshold (70/30 vs 80/20), Bollinger stddev (2 vs 2.5), and ADX threshold (25 vs 30) and measure stability of results.
These exercises teach both statistical thinking and the specific failure modes of the mashup.
________________________________________
Limitations, failure modes and caveats (explicit & teachable)
• ADX and Bollinger measures lag during fast-moving news events — signals can be late or wrong during earnings, macro shocks, or illiquid sessions.
• Volume classification by open/close is a heuristic; it does not equal TAPEDATA, footprint or signed volume. Use it as supportive evidence, not definitive proof.
• RSI can remain overbought or oversold for extended stretches in persistent trends — relying solely on RSI extremes without ADX or BB context invites large drawdowns.
• Small-cap or low-liquidity instruments yield noisy band behavior and unreliable volume ratios.
Being explicit about these limitations is a strong point in a TradingView description — it demonstrates transparency and educational intent.
________________________________________
Originality & mashup justification (text you can paste)
This script intentionally combines classical momentum (RSI), volatility envelope (Bollinger Bands) and trend-strength (ADX) because each indicator answers a different and complementary question: RSI answers is price locally extreme?, Bollinger answers is price outside normal volatility?, and ADX answers is the market moving with conviction?. Volume participation then acts as a practical check for real market involvement. This combination is not a simple “indicator mashup”; it is a designed ensemble where each element reduces the others’ failure modes and together produce a teachable, testable signal framework. The script’s purpose is educational and analytical — to show traders how to interpret the interplay of momentum, volatility, and trend strength.
________________________________________
TradingView publication guidance & compliance checklist
To satisfy TradingView rules about mashups and descriptions, include the following items in your script description (without exposing source code):
1. Purpose statement: One or two lines describing the script’s objective (educational multi-indicator market overview and idea filter).
2. Component list: Name the major modules (RSI, Bollinger Bands, ADX, volume heuristic, SMA trend checks, signal tracking) and one-sentence reason for each.
3. How they interact: A succinct non-code explanation: “RSI finds momentum extremes; Bollinger confirms volatility expansion; ADX confirms trend strength; all three must align for a BUY/SELL.”
4. Inputs: List adjustable inputs (RSI length and thresholds, BB length & stddev, ADX threshold & smoothing, volume MA, table position/size).
5. Usage instructions: Short workflow (check TF alignment → confirm participation → define stop & R:R → backtest).
6. Limitations & assumptions: Explicitly state volume is approximated, ADX has lag, and avoid promising guaranteed profits.
7. Non-promotional language: No external contact info, ads, claims of exclusivity or guaranteed outcomes.
8. Trademark clause: If you used trademark symbols, remove or provide registration proof.
9. Risk disclaimer: Add the copy-ready disclaimer below.
This matches TradingView’s request for meaningful descriptions that explain originality and inter-component reasoning.
________________________________________
Copy-ready short publication description (paste into TradingView)
Advanced RSI-ADX-Bollinger Market Overview — educational multi-indicator dashboard. This script combines RSI (momentum extremes), Bollinger Bands (volatility envelope and band expansion), ADX (trend strength), simple SMA trend bias and a basic buy/sell volume heuristic to surface high-quality idea candidates. Signals require alignment of momentum, volatility expansion and rising ADX; volume participation is displayed to support signal confidence. Inputs are configurable (RSI length/levels, BB length/stddev, ADX length/threshold, volume MA, display options). This tool is intended for analysis and learning — not for automated execution. Users should back test and apply robust risk management. Limitations: volume classification here is a heuristic (close>open), ADX and BB measures lag in fast news events, and results vary by instrument liquidity.
________________________________________
Copy-ready risk & misuse disclaimer (paste into description or help file)
This script is provided for educational and analytical purposes only and does not constitute financial or investment advice. It does not guarantee profits. Indicators are heuristics and may give false or late signals; always back test and paper-trade before using real capital. The author is not responsible for trading losses resulting from the use or misuse of this indicator. Use proper position sizing and risk controls.
________________________________________
Risk Disclaimer: This tool is provided for education and analysis only. It is not financial advice and does not guarantee returns. Users assume all risk for trades made based on this script. Back test thoroughly and use proper risk management.

Smart Money Precision Structure [BullByte]Smart Money Precision Structure
Advanced Market Structure Analysis Using Institutional Order Flow Concepts
---
OVERVIEW
Smart Money Precision Structure (SMPS) is a comprehensive market analysis indicator that combines six analytical frameworks to identify high-probability market structure patterns. The indicator uses multi-dimensional scoring algorithms to evaluate market conditions through institutional order flow concepts, providing traders with professional-grade market analysis.
---
PURPOSE AND ORIGINALITY
Why This Indicator Was Developed
• Addresses the gap between retail and institutional analysis methods
• Consolidates multiple analysis techniques that professionals use separately
• Automates complex market structure evaluation into actionable insights
• Eliminates the need for multiple indicators by providing comprehensive analysis
What Makes SMPS Original
• Six-Layer Confluence System - Unique combination of market regime, structure, volume flow, momentum, price action, and adaptive filtering
• Institutional Pattern Recognition - Identifies smart money accumulation and distribution patterns
• Adaptive Intelligence - Parameters automatically adjust based on detected market conditions
• Real-Time Market Scoring - Proprietary algorithm rates market quality from 0-100%
• Structure Break Detection - Advanced pivot analysis identifies trend reversals early
---
HOW IT WORKS - TECHNICAL METHODOLOGY
1. Market Regime Analysis Engine
The indicator evaluates five core market dimensions:
• Volatility Score - Measures current volatility against 50-period historical baseline
• Trend Score - Analyzes alignment between 8, 21, and 50-period EMAs
• Momentum Score - Combines RSI divergence with MACD signal alignment
• Structure Score - Evaluates pivot point formation clarity
• Efficiency Score - Calculates directional movement efficiency ratio
These scores combine to classify markets into five regimes:
• TRENDING - Strong directional movement with aligned indicators
• RANGING - Sideways movement with mixed directional signals
• VOLATILE - Elevated volatility with unpredictable price swings
• QUIET - Low volatility consolidation periods
• TRANSITIONAL - Market shifting between different regimes
2. Market Structure Analysis
Advanced pivot point analysis identifies:
• Higher Highs and Higher Lows for bullish structure
• Lower Highs and Lower Lows for bearish structure
• Structure breaks when established patterns fail
• Dynamic support and resistance from recent pivot points
• Key level proximity detection using ATR-based buffers
3. Volume Flow Decoding
Institutional activity detection through:
• Volume surge identification when volume exceeds 2x average
• Buy versus sell pressure analysis using price-volume correlation
• Flow strength measurement through directional volume consistency
• Divergence detection between volume and price movements
• Institutional threshold alerts when unusual volume patterns emerge
4. Multi-Period Momentum Synthesis
Weighted momentum calculation across four timeframes:
• 1-period momentum weighted at 40%
• 3-period momentum weighted at 30%
• 5-period momentum weighted at 20%
• 8-period momentum weighted at 10%
Result smoothed with 6-period EMA for noise reduction.
5. Price Action Quality Assessment
Each bar evaluated for:
• Range quality relative to 20-period average
• Body-to-range ratio for directional conviction
• Wick analysis for rejection pattern identification
• Pattern recognition including engulfing and hammer formations
• Sequential price movement analysis
6. Adaptive Parameter System
Parameters automatically adjust based on detected regime:
• Trending markets reduce sensitivity and confirmation requirements
• Volatile markets increase filtering and require additional confirmations
• Ranging markets maintain neutral settings
• Transitional markets use moderate adjustments
---
COMPLETE SETTINGS GUIDE
Section 1: Core Analysis Settings
Analysis Sensitivity (0.3-2.0)
• Default: 1.0
• Lower values require stronger price movements
• Higher values detect more subtle patterns
• Scalpers use 0.8-1.2, swing traders use 1.5-2.0
Noise Reduction Level (2-7)
• Default: 4
• Controls filtering of false patterns
• Higher values reduce pattern frequency
• Increase in volatile markets
Minimum Move % (0.05-0.50)
• Default: 0.15%
• Sets minimum price movement threshold
• Adjust based on instrument volatility
• Forex: 0.05-0.10%, Stocks: 0.15-0.25%, Crypto: 0.20-0.50%
High Confirmation Mode
• Default: True (Enabled)
• Requires all technical conditions to align
• Reduces frequency but increases reliability
• Disable for more aggressive pattern detection
Section 2: Market Regime Detection
Enable Regime Analysis
• Default: True (Enabled)
• Activates market environment evaluation
• Essential for adaptive features
• Keep enabled for best results
Regime Analysis Period (20-100)
• Default: 50 bars
• Determines regime calculation lookback
• Shorter for responsive, longer for stable
• Scalping: 20-30, Swing: 75-100
Minimum Market Clarity (0.2-0.8)
• Default: 0.4
• Quality threshold for pattern generation
• Higher values require clearer conditions
• Lower for more patterns, higher for quality
Adaptive Parameter Adjustment
• Default: True (Enabled)
• Enables automatic parameter optimization
• Adjusts based on market regime
• Highly recommended to keep enabled
Section 3: Market Structure Analysis
Enable Structure Validation
• Default: True (Enabled)
• Validates patterns against support/resistance
• Confirms trend structure alignment
• Essential for reliability
Structure Analysis Period (15-50)
• Default: 30 bars
• Period for structure pattern analysis
• Affects support/resistance calculation
• Match to your trading timeframe
Minimum Structure Alignment (0.3-0.8)
• Default: 0.5
• Required structure score for valid patterns
• Higher values need stronger structure
• Balance with desired frequency
Section 4: Analysis Configuration
Minimum Strength Level (3-5)
• Default: 4
• Minimum confirmations for pattern display
• 5 = Maximum reliability, 3 = More patterns
• Beginners should use 4-5
Required Technical Confirmations (4-6)
• Default: 5
• Number of aligned technical factors
• Higher = fewer but better patterns
• Works with High Confirmation Mode
Pattern Separation (3-20 bars)
• Default: 8 bars
• Minimum bars between patterns
• Prevents clustering and overtrading
• Increase for cleaner charts
Section 5: Technical Filters
Momentum Validation
• Default: True (Enabled)
• Requires momentum alignment
• Filters counter-trend patterns
• Essential for trend following
Volume Confluence Analysis
• Default: True (Enabled)
• Requires volume confirmation
• Identifies institutional participation
• Critical for reliability
Trend Direction Filter
• Default: True (Enabled)
• Only shows patterns with trend
• Reduces counter-trend signals
• Disable for reversal hunting
Section 6: Volume Flow Analysis
Institutional Activity Threshold (1.2-3.5)
• Default: 2.0
• Multiplier for unusual volume detection
• Lower finds more institutional activity
• Stock: 2.0-2.5, Forex: 1.5-2.0, Crypto: 2.5-3.5
Volume Surge Multiplier (1.8-4.5)
• Default: 2.5
• Defines significant volume increases
• Adjust per instrument characteristics
• Higher for stocks, lower for forex
Volume Flow Period (12-35)
• Default: 18 bars
• Smoothing for volume analysis
• Shorter = responsive, longer = smooth
• Match to timeframe used
Section 7: Analysis Frequency Control
Maximum Analysis Points Per Hour (1-5)
• Default: 3
• Limits pattern frequency
• Prevents overtrading
• Scalpers: 4-5, Swing traders: 1-2
Section 8: Target Level Configuration
Target Calculation Method
• Default: Market Adaptive
• Three modes available:
- Fixed: Uses set point distances
- Dynamic: ATR-based calculations
- Market Adaptive: Structure-based levels
Minimum Target/Risk Ratio (1.0-3.0)
• Default: 1.5
• Minimum acceptable reward vs risk
• Higher filters lower probability setups
• Professional standard: 1.5-2.0
Fixed Mode Settings:
• Fixed Target Distance: 50 points default
• Fixed Invalidation Distance: 30 points default
• Use for consistent instruments
Dynamic Mode Settings:
• Dynamic Target Multiplier: 1.8x ATR default
• Dynamic Invalidation Multiplier: 1.0x ATR default
• Adapts to volatility automatically
Market Adaptive Settings:
• Use Structure Levels: True (default)
• Structure Level Buffer: 0.1% default
• Places levels at actual support/resistance
Section 9: Visual Display Settings
Color Theme Options
• Professional (Teal/Red)
- Bullish: Teal (#26a69a)
- Bearish: Red (#ef5350)
- Neutral: Gray (#78909c)
- Best for: Traditional traders, clean appearance
• Dark (Neon Green/Pink)
- Bullish: Neon Green (#00ff88)
- Bearish: Hot Pink (#ff0044)
- Neutral: Dark Gray (#333333)
- Best for: Dark theme users, high contrast
• Light (Green/Red Classic)
- Bullish: Green (#4caf50)
- Bearish: Red (#f44336)
- Neutral: Light Gray (#9e9e9e)
- Best for: Light backgrounds, traditional colors
• Vibrant (Cyan/Magenta)
- Bullish: Cyan (#00ffff)
- Bearish: Magenta (#ff00ff)
- Neutral: Medium Gray (#888888)
- Best for: High visibility, modern appearance
Dashboard Position
• Options: Top Left, Top Right, Bottom Left, Bottom Right, Middle Left, Middle Right
• Default: Top Right
• Choose based on chart layout preference
Dashboard Size
• Full: Complete information display (desktop)
• Mobile: Compact view for small screens
• Default: Full
Analysis Display Style
• Arrows : Simple directional markers
• Labels : Detailed text information
• Zones : Colored areas showing pattern regions
• Default: Labels (most informative)
Display Options:
• Display Analysis Strength: Shows star rating
• Display Target Levels: Shows target/invalidation lines
• Display Market Regime: Shows regime in pattern labels
---
HOW TO USE SMPS - DETAILED GUIDE
Understanding the Dashboard
Top Row - Header
• SMPS Dashboard title
• VALUE column: Current readings
• STATUS column: Condition assessments
Market Regime Row
• Shows: TRENDING, RANGING, VOLATILE, QUIET, or TRANSITIONAL
• Color coding: Green = Favorable, Red = Caution
• Status: FAVORABLE or CAUTION trading conditions
Market Score Row
• Percentage from 0-100%
• Above 60% = Strong conditions
• 40-60% = Moderate conditions
• Below 40% = Weak conditions
Structure Row
• Direction: BULLISH, BEARISH, or NEUTRAL
• Status: INTACT or BREAK
• Orange BREAK indicates structure failure
Volume Flow Row
• Direction: BUYING or SELLING
• Intensity: STRONG or WEAK
• Color indicates dominant pressure
Momentum Row
• Numerical momentum value
• Positive = Upward pressure
• Negative = Downward pressure
Volume Status Row
• INST = Institutional activity detected
• HIGH = Above average volume
• NORM = Normal volume levels
Adaptive Mode Row
• ACTIVE = Parameters adjusting
• STATIC = Fixed parameters
• Shows required confirmations
Analysis Level Row
• Minimum strength level setting
• Pattern separation in bars
Market State Row
• Current analysis: BULLISH, BEARISH, NEUTRAL
• Shows analysis price level when active
T:R Ratio Row
• Current target to risk ratio
• GOOD = Meets minimum requirement
• LOW = Below minimum threshold
Strength Row
• BULL or BEAR dominance
• Numerical strength value 0-100
Price Row
• Current price
• Percentage change
Last Analysis Row
• Previous pattern direction
• Bars since last pattern
Reading Pattern Signals
Bullish Structure Pattern
• Upward triangle or "Bullish Structure" label
• Star rating shows strength (★★★★★ = strongest)
• Green line = potential target level
• Red dashed line = invalidation level
• Appears below price bars
Bearish Structure Pattern
• Downward triangle or "Bearish Structure" label
• Star rating indicates reliability
• Green line = potential target level
• Red dashed line = invalidation level
• Appears above price bars
Pattern Strength Interpretation
• ★★★★★ = 6 confirmations (exceptional)
• ★★★★☆ = 5 confirmations (strong)
• ★★★☆☆ = 4 confirmations (moderate)
• ★★☆☆☆ = 3 confirmations (minimum)
• Below minimum = filtered out
Visual Elements on Chart
Lines and Levels:
• Gray Line = 21 EMA trend reference
• Green Stepline = Dynamic support level
• Red Stepline = Dynamic resistance level
• Green Solid Line = Active target level
• Red Dashed Line = Active invalidation level
Pattern Markers:
• Triangles = Arrow display mode
• Text Labels = Label display mode
• Colored Boxes = Zone display mode
Target Completion Labels:
• "Target" = Price reached target level
• "Invalid" = Pattern invalidated by price
---
RECOMMENDED USAGE BY TIMEFRAME
1-Minute Charts (Scalping)
• Sensitivity: 0.8-1.2
• Noise Reduction: 3-4
• Pattern Separation: 3-5 bars
• High Confirmation: Optional
• Best for: Quick intraday moves
5-Minute Charts (Precision Intraday)
• Sensitivity: 1.0 (default)
• Noise Reduction: 4 (default)
• Pattern Separation: 8 bars
• High Confirmation: Enabled
• Best for: Day trading
15-Minute Charts (Short Swing)
• Sensitivity: 1.0-1.5
• Noise Reduction: 4-5
• Pattern Separation: 10-12 bars
• High Confirmation: Enabled
• Best for: Intraday swings
30-Minute to 1-Hour (Position Trading)
• Sensitivity: 1.5-2.0
• Noise Reduction: 5-7
• Pattern Separation: 15-20 bars
• Regime Period: 75-100
• Best for: Multi-day positions
Daily Charts (Swing Trading)
• Sensitivity: 1.8-2.0
• Noise Reduction: 6-7
• Pattern Separation: 20 bars
• All filters enabled
• Best for: Long-term analysis
---
MARKET-SPECIFIC SETTINGS
Forex Pairs
• Minimum Move: 0.05-0.10%
• Institutional Threshold: 1.5-2.0
• Volume Surge: 1.8-2.2
• Target Mode: Dynamic or Market Adaptive
Stock Indices (ES, NQ, YM)
• Minimum Move: 0.10-0.15%
• Institutional Threshold: 2.0-2.5
• Volume Surge: 2.5-3.0
• Target Mode: Market Adaptive
Individual Stocks
• Minimum Move: 0.15-0.25%
• Institutional Threshold: 2.0-2.5
• Volume Surge: 2.5-3.5
• Target Mode: Dynamic
Cryptocurrency
• Minimum Move: 0.20-0.50%
• Institutional Threshold: 2.5-3.5
• Volume Surge: 3.0-4.5
• Target Mode: Dynamic
• Increase noise reduction
---
PRACTICAL APPLICATION EXAMPLES
Example 1: Strong Trending Market
Dashboard Reading:
• Market Regime: TRENDING
• Market Score: 75%
• Structure: BULLISH, INTACT
• Volume Flow: BUYING, STRONG
• Momentum: +0.45
Interpretation:
• Strong uptrend environment
• Institutional buying present
• Look for bullish patterns as continuation
• Higher probability of success
• Consider using lower sensitivity
Example 2: Range-Bound Conditions
Dashboard Reading:
• Market Regime: RANGING
• Market Score: 35%
• Structure: NEUTRAL
• Volume Flow: SELLING, WEAK
• Momentum: -0.05
Interpretation:
• No clear direction
• Low opportunity environment
• Patterns are less reliable
• Consider waiting for regime change
• Or switch to a range-trading approach
Example 3: Structure Break Alert
Dashboard Reading:
• Previous: BULLISH structure
• Current: Structure BREAK
• Volume: INST flag active
• Momentum: Shifting negative
Interpretation:
• Trend reversal potentially beginning
• Institutional participation detected
• Watch for bearish pattern confirmation
• Adjust bias accordingly
• Increase caution on long positions
Example 4: Volatile Market
Dashboard Reading:
• Market Regime: VOLATILE
• Market Score: 45%
• Adaptive Mode: ACTIVE
• Confirmations: Increased to 6
Interpretation:
• Choppy conditions
• Parameters auto-adjusted
• Fewer but higher quality patterns
• Wider stops may be needed
• Consider reducing position size
Below are a few chart examples of the Smart Money Precision Structure (SMPS) indicator in action.
• Example 1 – Bullish Structure Detection on SOLUSD 5m
• Example 2 – Bearish Structure Detected with Strong Confluence on SOLUSD 5m
---
TROUBLESHOOTING GUIDE
No Patterns Appearing
Check these settings:
• High Confirmation Mode may be too restrictive
• Minimum Strength Level may be too high
• Market Clarity threshold may be too high
• Regime filter may be blocking patterns
• Try increasing sensitivity
Too Many Patterns
Adjust these settings:
• Enable High Confirmation Mode
• Increase Minimum Strength Level to 5
• Increase Pattern Separation
• Reduce Sensitivity below 1.0
• Enable all technical filters
Dashboard Shows "CAUTION"
This indicates:
• Market conditions are unfavorable
• Regime is RANGING or QUIET
• Market score is low
• Consider waiting for better conditions
• Or adjust expectations accordingly
Patterns Not Reaching Targets
Consider:
• Market may be choppy
• Volatility may have changed
• Try Dynamic target mode
• Reduce target/risk ratio requirement
• Check if regime is VOLATILE
---
ALERTS CONFIGURATION
Alert Message Format
Alerts include:
• Pattern type (Bullish/Bearish)
• Strength rating
• Market regime
• Analysis price level
• Target and invalidation levels
• Strength percentage
• Target/Risk ratio
• Educational disclaimer
Setting Up Alerts
• Click Alert button on TradingView
• Select SMPS indicator
• Choose alert frequency
• Customize message if desired
• Alerts fire on pattern detection
---
DATA WINDOW INFORMATION
The Data Window displays:
• Market Regime Score (0-100)
• Market Structure Bias (-1 to +1)
• Bullish Strength (0-100)
• Bearish Strength (0-100)
• Bull Target/Risk Ratio
• Bear Target/Risk Ratio
• Relative Volume
• Momentum Value
• Volume Flow Strength
• Bull Confirmations Count
• Bear Confirmations Count
---
BEST PRACTICES AND TIPS
For Beginners
• Start with default settings
• Use High Confirmation Mode
• Focus on TRENDING regime only
• Paper trade first
• Learn one timeframe thoroughly
For Intermediate Users
• Experiment with sensitivity settings
• Try different target modes
• Use multiple timeframes
• Combine with price action analysis
• Track pattern success rate
For Advanced Users
• Customize per instrument
• Create setting templates
• Use regime information for bias
• Combine with other indicators
• Develop systematic rules
---
IMPORTANT DISCLAIMERS
• This indicator is for educational and informational purposes only
• Not financial advice or a trading system
• Past performance does not guarantee future results
• Trading involves substantial risk of loss
• Always use appropriate risk management
• Verify patterns with additional analysis
• The author is not a registered investment advisor
• No liability accepted for trading losses
---
VERSION NOTES
Version 1.0.0 - Initial Release
• Six-layer confluence system
• Adaptive parameter technology
• Institutional volume detection
• Market regime classification
• Structure break identification
• Real-time dashboard
• Multiple display modes
• Comprehensive settings
## My Final Thoughts
Smart Money Precision Structure represents an advanced approach to market analysis, bringing institutional-grade techniques to retail traders through intelligent automation and multi-dimensional evaluation. By combining six analytical frameworks with adaptive parameter adjustment, SMPS provides comprehensive market intelligence that single indicators cannot achieve.
The indicator serves as an educational tool for understanding how professional traders analyze markets, while providing practical pattern detection for those seeking to improve their technical analysis. Remember that all trading involves risk, and this tool should be used as part of a complete analysis approach, not as a standalone trading system.
- BullByte

DYNAMIC TRADING DASHBOARDStudy Material for the "Dynamic Trading Dashboard"
This Dynamic Trading Dashboard is designed as an educational tool within the TradingView environment. It compiles commonly used market indicators and analytical methods into one visual interface so that traders and learners can see relationships between indicators and price action. Understanding these indicators, step by step, can help traders develop discipline, improve technical analysis skills, and build strategies. Below is a detailed explanation of each module.
________________________________________
1. Price and Daily Reference Points
The dashboard displays the current price, along with percentage change compared to the day’s opening price. It also highlights whether the price is moving upward or downward using directional symbols. Alongside, it tracks daily high, low, open, and daily range.
For traders, daily levels provide valuable reference points. The daily high and low are considered intraday support and resistance, while the median price of the day often acts as a pivot level for mean reversion traders. Monitoring these helps learners see how price oscillates within daily ranges.
________________________________________
2. VWAP (Volume Weighted Average Price)
VWAP is calculated as a cumulative average price weighted by volume. The dashboard compares the current price with VWAP, showing whether the market is trading above or below it.
For traders, VWAP is often a guide for institutional order flow. Price trading above VWAP suggests bullish sentiment, while trading below VWAP indicates bearish sentiment. Learners can use VWAP as a training tool to recognize trend-following vs. mean reversion setups.
________________________________________
3. Volume Analysis
The system distinguishes between buy volume (when the closing price is higher than the open) and sell volume (when the closing price is lower than the open). A progress bar highlights the ratio of buying vs. selling activity in percentage.
This is useful because volume confirms price action. For instance, if prices rise but sell volume dominates, it can signal weakness. New traders learning with this tool should focus on how volume often precedes price reversals and trends.
________________________________________
4. RSI (Relative Strength Index)
RSI is a momentum oscillator that measures price strength on a scale from 0 to 100. The dashboard classifies RSI readings into overbought (>70), oversold (<30), or neutral zones and adds visual progress bars.
RSI helps learners understand momentum shifts. During training, one should notice how trending markets can keep RSI extended for longer periods (not immediate reversal signals), while range-bound markets react more sharply to RSI extremes. It is an excellent tool for practicing trend vs. range identification.
________________________________________
5. MACD (Moving Average Convergence Divergence)
The MACD indicator involves a fast EMA, slow EMA, and signal line, with focus on crossovers. The dashboard shows whether a “bullish cross” (MACD above signal line) or “bearish cross” (MACD below signal line) has occurred.
MACD teaches traders to identify trend momentum shifts and divergence. During practice, traders can explore how MACD signals align with VWAP trends or RSI levels, which helps in building a structured multi-indicator analysis.
________________________________________
6. Stochastic Oscillator
This indicator compares the current close relative to a range of highs and lows over a period. Displayed values oscillate between 0 and 100, marking zones of overbought (>80) and oversold (<20).
Stochastics are useful for students of trading to recognize short-term momentum changes. Unlike RSI, it reacts faster to price volatility, so false signals are common. Part of the training exercise can be to observe how stochastic “flips” can align with volume surges or daily range endpoints.
________________________________________
7. Trend & Momentum Classification
The dashboard adds simple labels for trend (uptrend, downtrend, neutral) based on RSI thresholds. Additionally, it provides quick momentum classification (“bullish hold”, “bearish hold”, or neutral).
This is beneficial for beginners as it introduces structured thinking: differentiating long-term market bias (trend) from short-term directional momentum. By combining both, traders can practice filtering signals instead of trading randomly.
________________________________________
8. Accumulation / Distribution Bias
Based on RSI levels, the script generates simplified tags such as “Accumulate Long”, “Accumulate Short”, or “Wait”.
This is purely an interpretive guide, helping learners think in terms of accumulation phases (when markets are low) and distribution phases (when markets are high). It reinforces the concept that trading is not only directional but also involves timing.
________________________________________
9. Overall Market Status and Score
Finally, the dashboard compiles multiple indicators (VWAP position, RSI, MACD, Stochastics, and price vs. median levels) into a Market Score expressed as a percentage. It also labels the market as Overbought, Oversold, or Normal.
This scoring system isn’t a recommendation but a learning framework. Students can analyze how combining different indicators improves decision-making. The key training focus here is confluence: not depending on one indicator but observing when several conditions align.
Extended Study Material with Formulas
________________________________________
1. Daily Reference Levels (High, Low, Open, Median, Range)
• Day High (H): Maximum price of the session.
DayHigh=max(Hightoday)DayHigh=max(Hightoday)
• Day Low (L): Minimum price of the session.
DayLow=min(Lowtoday)DayLow=min(Lowtoday)
• Day Open (O): Opening price of the session.
DayOpen=OpentodayDayOpen=Opentoday
• Day Range:
Range=DayHigh−DayLowRange=DayHigh−DayLow
• Median: Mid-point between high and low.
Median=DayHigh+DayLow2Median=2DayHigh+DayLow
These act as intraday guideposts for seeing how far the price has stretched from its key reference levels.
________________________________________
2. VWAP (Volume Weighted Average Price)
VWAP considers both price and volume for a weighted average:
VWAPt=∑i=1t(Pricei×Volumei)∑i=1tVolumeiVWAPt=∑i=1tVolumei∑i=1t(Pricei×Volumei)
Here, Price_i can be the average price (High + Low + Close) ÷ 3, also known as hlc3.
• Interpretation: Price above VWAP = bullish bias; Price below = bearish bias.
________________________________________
3. Volume Buy/Sell Analysis
The dashboard splits total volume into buy volume and sell volume based on candle type.
• Buy Volume:
BuyVol=Volumeif Close > Open, else 0BuyVol=Volumeif Close > Open, else 0
• Sell Volume:
SellVol=Volumeif Close < Open, else 0SellVol=Volumeif Close < Open, else 0
• Buy Ratio (%):
VolumeRatio=BuyVolBuyVol+SellVol×100VolumeRatio=BuyVol+SellVolBuyVol×100
This helps traders gauge who is in control during a session—buyers or sellers.
________________________________________
4. RSI (Relative Strength Index)
RSI measures strength of momentum by comparing gains vs. losses.
Step 1: Compute average gains (AG) and losses (AL).
AG=Average of Upward Closes over N periodsAG=Average of Upward Closes over N periodsAL=Average of Downward Closes over N periodsAL=Average of Downward Closes over N periods
Step 2: Calculate relative strength (RS).
RS=AGALRS=ALAG
Step 3: RSI formula.
RSI=100−1001+RSRSI=100−1+RS100
• Used to detect overbought (>70), oversold (<30), or neutral momentum zones.
________________________________________
5. MACD (Moving Average Convergence Divergence)
• Fast EMA:
EMAfast=EMA(Close,length=fast)EMAfast=EMA(Close,length=fast)
• Slow EMA:
EMAslow=EMA(Close,length=slow)EMAslow=EMA(Close,length=slow)
• MACD Line:
MACD=EMAfast−EMAslowMACD=EMAfast−EMAslow
• Signal Line:
Signal=EMA(MACD,length=signal)Signal=EMA(MACD,length=signal)
• Histogram:
Histogram=MACD−SignalHistogram=MACD−Signal
Crossovers between MACD and Signal are used in studying bullish/bearish phases.
________________________________________
6. Stochastic Oscillator
Stochastic compares the current close against a range of highs and lows.
%K=Close−LowestLowHighestHigh−LowestLow×100%K=HighestHigh−LowestLowClose−LowestLow×100
Where LowestLow and HighestHigh are the lowest and highest values over N periods.
The %D line is a smooth version of %K (using a moving average).
%D=SMA(%K,smooth)%D=SMA(%K,smooth)
• Values above 80 = overbought; below 20 = oversold.
________________________________________
7. Trend and Momentum Classification
This dashboard generates simplified trend/momentum logic using RSI.
• Trend:
• RSI < 40 → Downtrend
• RSI > 60 → Uptrend
• In Between → Neutral
• Momentum Bias:
• RSI > 70 → Bullish Hold
• RSI < 30 → Bearish Hold
• Otherwise Neutral
This is not predictive, only a classification framework for educational use.
________________________________________
8. Accumulation/Distribution Bias
Based on extreme RSI values:
• RSI < 25 → Accumulate Long Bias
• RSI > 80 → Accumulate Short Bias
• Else → Wait/No Action
This helps learners understand the idea of accumulation at lows (strength building) and distribution at highs (profit booking).
________________________________________
9. Overall Market Status and Score
The tool adds up 5 bullish conditions:
1. Price above VWAP
2. RSI > 50
3. MACD > Signal
4. Stochastic > 50
5. Price above Daily Median
BullishScore=ConditionsMet5×100BullishScore=5ConditionsMet×100
Then it categorizes the market:
• RSI > 70 or Stoch > 80 → Overbought
• RSI < 30 or Stoch < 20 → Oversold
• Else → Normal
This encourages learners to think in terms of probabilistic conditions instead of single-indicator signals.
________________________________________
⚠️ Warning:
• Trading financial markets involves substantial risk.
• You can lose more money than you invest.
• Past performance of indicators does not guarantee future results.
• This script must not be copied, resold, or republished without authorization from aiTrendview.
By using this material or the code, you agree to take full responsibility for your trading decisions and acknowledge that this is not financial advice.
________________________________________
⚠️ Disclaimer and Warning (From aiTrendview)
This Dynamic Trading Dashboard is created strictly for educational and research purposes on the TradingView platform. It does not provide financial advice, buy/sell recommendations, or guaranteed returns. Any use of this tool in live trading is completely at the user’s own risk. Markets are inherently risky; losses can exceed initial investment.
The intellectual property of this script and its methodology belongs to aiTrendview. Unauthorized reproduction, modification, or redistribution of this code is strictly prohibited. By using this study material or the script, you acknowledge personal responsibility for any trading outcomes. Always consult professional financial advisors before making investment decisions.

VWAP For Loop [BackQuant]VWAP For Loop
What this tool does—in one sentence
A volume-weighted trend gauge that anchors VWAP to a calendar period (day/week/month/quarter/year) and then scores the persistence of that VWAP trend with a simple for-loop “breadth” count; the result is a clean, threshold-driven oscillator plus an optional VWAP overlay and alerts.
Plain-English overview
Instead of judging raw price alone, this indicator focuses on anchored VWAP —the market’s average price paid during your chosen institutional period. It then asks a simple question across a configurable set of lookback steps: “Is the current anchored VWAP higher than it was i bars ago—or lower?” Each “yes” adds +1, each “no” adds −1. Summing those answers creates a score that reflects how consistently the volume-weighted trend has been rising or falling. Extreme positive scores imply persistent, broad strength; deeply negative scores imply persistent weakness. Crossing predefined thresholds produces objective long/short events and color-coded context.
Under the hood
• Anchoring — VWAP using hlc3 × volume resets exactly when the selected period rolls:
Day → session change, Week → new week, Month → new month, Quarter/Year → calendar quarter/year.
• For-loop scoring — For lag steps i = , compare today’s VWAP to VWAP .
– If VWAP > VWAP , add +1.
– Else, add −1.
The final score ∈ , where N = (end − start + 1). With defaults (1→45), N = 45.
• Signal logic (stateful)
– Long when score > upper (e.g., > 40 with N = 45 → VWAP higher than ~89% of checked lags).
– Short on crossunder of lower (e.g., dropping below −10).
– A compact state variable ( out ) holds the current regime: +1 (long), −1 (short), otherwise unchanged. This “stickiness” avoids constant flipping between bars without sufficient evidence.
Why VWAP + a breadth score?
• VWAP aggregates both price and volume—where participants actually traded.
• The breadth-style count rewards consistency of the anchored trend, not one-off spikes.
• Thresholds give you binary structure when you need it (alerts, automation), without complex math.
What you’ll see on the chart
• Sub-pane oscillator — The for-loop score line, colored by regime (long/short/neutral).
• Main-pane VWAP (optional) — Even though the indicator runs off-chart, the anchored VWAP can be overlaid on price (toggle visibility and whether it inherits trend colors).
• Threshold guides — Horizontal lines for the long/short bands (toggle).
• Cosmetics — Optional candle painting and background shading by regime; adjustable line width and colors.
Input map (quick reference)
• VWAP Anchor Period — Day, Week, Month, Quarter, Year.
• Calculation Start/End — The for-loop lag window . With 1→45, you evaluate 45 comparisons.
• Long/Short Thresholds — Default upper=40, lower=−10 (asymmetric by design; see below).
• UI/Style — Show thresholds, paint candles, background color, line width, VWAP visibility and coloring, custom long/short colors.
Interpreting the score
• Near +N — Current anchored VWAP is above most historical VWAP checkpoints in the window → entrenched strength.
• Near −N — Current anchored VWAP is below most checkpoints → entrenched weakness.
• Between — Mixed, choppy, or transitioning regimes; use thresholds to avoid reacting to noise.
Why the asymmetric default thresholds?
• Long = score > upper (40) — Demands unusually broad upside persistence before declaring “long regime.”
• Short = crossunder lower (−10) — Triggers only on downward momentum events (a fresh breach), not merely being below −10. This combination tends to:
– Capture sustained uptrends only when they’re very strong.
– Flag downside turns as they occur, rather than waiting for an extreme negative breadth.
Tuning guide
Choose an anchor that matches your horizon
– Intraday scalps : Day anchor on intraday charts.
– Swing/position : Month or Quarter anchor on 1h/4h/D charts to capture institutional cycles.
Pick the for-loop window
– Larger N (bigger end) = stronger evidence requirement, smoother oscillator.
– Smaller N = faster, more reactive score.
Set achievable thresholds
– Ensure upper ≤ N and lower ≥ −N ; if N=30, an upper of 40 can never trigger.
– Symmetric setups (e.g., +20/−20) are fine if you want balanced behavior.
Match visuals to intent
– Enabling VWAP coloring lets you see regime directly on price.
– Background shading is useful for discretionary reading; turn it off for cleaner automation displays.
Playbook examples
• Trend confirmation with disciplined entries — On Month anchor, N=45, upper=38–42: when the long regime engages, use pullbacks toward anchored VWAP on the main pane for entries, with stops just beyond VWAP or a recent swing.
• Downside transition detection — Keep lower around −8…−12 and watch for crossunders; combine with price losing anchored VWAP to validate risk-off.
• Intraday bias filter — Day anchor on a 5–15m chart, N=20–30, upper ~ 16–20, lower ~ −6…−10. Only take longs while score is positive and above a midline you define (e.g., 0), and shorts only after a genuine crossunder.
Behavior around resets (important)
Anchored VWAP is hard-reset each period. Immediately after a reset, the series can be young and comparisons to pre-reset values may span two periods. If you prefer within-period evaluation only, choose end small enough not to bridge typical period length on your timeframe, or accept that the breadth test intentionally spans regimes.
Alerts included
• VWAP FL Long — Fires when the long condition is true (score > upper and not in short).
• VWAP FL Short — Fires on crossunder of the lower threshold (event-driven).
Messages include {{ticker}} and {{interval}} placeholders for routing.
Strengths
• Simple, transparent math — Easy to reason about and validate.
• Volume-aware by construction — Decisions reference VWAP, not just price.
• Robust to single-bar noise — Needs many lags to agree before flipping state (by design, via thresholds and the stateful output).
Limitations & cautions
• Threshold feasibility — If N < upper or |lower| > N, signals will never trigger; always cross-check N.
• Path dependence — The state variable persists until a new event; if you want frequent re-evaluation, lower thresholds or reduce N.
• Regime changes — Calendar resets can produce early ambiguity; expect a few bars for the breadth to mature.
• VWAP sensitivity to volume spikes — Large prints can tilt VWAP abruptly; that behavior is intentional in VWAP-based logic.
Suggested starting profiles
• Intraday trend bias : Anchor=Day, N=25 (1→25), upper=18–20, lower=−8, paint candles ON.
• Swing bias : Anchor=Month, N=45 (1→45), upper=38–42, lower=−10, VWAP coloring ON, background OFF.
• Balanced reactivity : Anchor=Week, N=30 (1→30), upper=20–22, lower=−10…−12, symmetric if desired.
Implementation notes
• The indicator runs in a separate pane (oscillator), but VWAP itself is drawn on price using forced overlay so you can see interactions (touches, reclaim/loss).
• HLC3 is used for VWAP price; that’s a common choice to dampen wick noise while still reflecting intrabar range.
• For-loop cap is kept modest (≤50) for performance and clarity.
How to use this responsibly
Treat the oscillator as a bias and persistence meter . Combine it with your entry framework (structure breaks, liquidity zones, higher-timeframe context) and risk controls. The design emphasizes clarity over complexity—its edge is in how strictly it demands agreement before declaring a regime, not in predicting specific turns.
Summary
VWAP For Loop distills the question “How broadly is the anchored, volume-weighted trend advancing or retreating?” into a single, thresholded score you can read at a glance, alert on, and color through your chart. With careful anchoring and thresholds sized to your window length, it becomes a pragmatic bias filter for both systematic and discretionary workflows.

NAS100 Component Sentiment Scanner# NAS100 Component Sentiment Scanner
## 🎯 Overview
The NAS100 Component Sentiment Scanner analyzes the top-weighted stocks in the NASDAQ-100 index to provide real-time bullish/bearish sentiment signals that can help predict NAS100 price movements. This indicator combines multiple technical analysis methods to give traders a comprehensive view of underlying market sentiment.
## 📊 How It Works
The indicator calculates sentiment scores for major NASDAQ-100 components (AAPL, MSFT, NVDA, GOOGL, AMZN, META, TSLA, AVGO, COST, NFLX) using:
- **RSI Analysis**: Identifies overbought/oversold conditions
- **Moving Average Trends**: Compares fast vs slow MA positioning
- **Volume Confirmation**: Validates moves with volume thresholds
- **Price Momentum**: Analyzes recent price direction
- **Market Cap Weighting**: Uses actual NASDAQ-100 weightings for accuracy
## 🚀 Key Features
### Real-Time Sentiment Analysis
- Weighted composite score based on individual stock analysis
- Color-coded sentiment line (Green = Bullish, Red = Bearish)
- Dynamic background coloring for strong signals
### Interactive Data Table
- Shows individual stock scores and signals
- Bullish/Bearish stock count summary
- Customizable position and size
### Smart Signal System
- **Bullish Signals**: Green triangle up when sentiment crosses threshold
- **Bearish Signals**: Red triangle down when sentiment falls below threshold
- **Alert Conditions**: Automatic notifications for signal changes
## ⚙️ Customization Options
### Technical Analysis Settings
- **RSI Period**: Adjust lookback period (default: 14)
- **RSI Levels**: Set overbought/oversold thresholds
- **Moving Averages**: Configure fast/slow MA periods
- **Volume Threshold**: Set volume confirmation multiplier
### Signal Thresholds
- **Bullish/Bearish Levels**: Customize trigger points
- **Strong Signal Levels**: Set extreme sentiment thresholds
- Fine-tune sensitivity to market conditions
### Display Options
- **Toggle Table**: Show/hide sentiment data table
- **Table Position**: 6 position options (Top/Bottom/Middle + Left/Right)
- **Table Size**: Choose from Tiny, Small, Normal, or Large
- **Background Colors**: Enable/disable signal backgrounds
- **Signal Arrows**: Show/hide buy/sell indicators
### Stock Selection
- **Individual Control**: Enable/disable any of the 10 major stocks
- **Dynamic Weighting**: Automatically adjusts calculations based on selected stocks
- **Flexible Analysis**: Focus on specific sectors or market leaders
## 📈 How to Use
### 1. Basic Setup
1. Add the indicator to your NAS100 chart
2. Default settings work well for most traders
3. Observe the sentiment line and signals
### 2. Signal Interpretation
- **Score > 30**: Bullish bias for NAS100
- **Score > 50**: Strong bullish signal
- **Score -30 to 30**: Neutral/consolidation
- **Score < -30**: Bearish bias for NAS100
- **Score < -50**: Strong bearish signal
### 3. Trading Strategies
**Trend Following:**
- Buy NAS100 when bullish signals appear
- Sell/short when bearish signals trigger
- Use background colors for quick visual confirmation
**Divergence Trading:**
- Watch for sentiment/price divergences
- Strong sentiment with weak NAS100 price = potential breakout
- Weak sentiment with strong NAS100 price = potential reversal
**Consensus Trading:**
- Monitor bullish/bearish stock counts in table
- 8+ stocks aligned = strong directional bias
- Mixed signals = wait for clearer consensus
### 4. Advanced Usage
- Combine with your existing NAS100 trading strategy
- Use multiple timeframes for confirmation
- Adjust thresholds based on market volatility
- Focus on specific stocks by disabling others
## 🔔 Alert Setup
The indicator includes built-in alert conditions:
1. Go to TradingView Alerts
2. Select "NAS100 Component Sentiment Scanner"
3. Choose from available alert types:
- NAS100 Bullish Signal
- NAS100 Bearish Signal
- Strong Bullish Consensus
- Strong Bearish Consensus
## 💡 Pro Tips
### Optimization
- **High Volatility**: Increase signal thresholds (±40, ±60)
- **Low Volatility**: Decrease thresholds (±20, ±40)
- **Day Trading**: Use smaller table, focus on real-time signals
- **Swing Trading**: Enable background colors, larger thresholds
### Best Practices
- Don't use as a standalone system - combine with price action
- Check individual stock table for context
- Monitor during market open for most reliable signals
- Consider earnings seasons for individual stock impacts
### Market Conditions
- **Trending Markets**: Higher accuracy, use with trend following
- **Ranging Markets**: Watch for false signals, increase thresholds
- **News Events**: Individual stock news can skew sentiment temporarily
## 🎨 Visual Guide
- **Green Line Above Zero**: Bullish sentiment building
- **Red Line Below Zero**: Bearish sentiment building
- **Background Color Changes**: Strong signal confirmation
- **Triangle Arrows**: Entry/exit signal points
- **Table Colors**: Quick sentiment overview
## ⚠️ Important Notes
- This indicator analyzes component stocks, not NAS100 directly
- Market cap weightings approximate real NASDAQ-100 weightings
- Sentiment can change rapidly during volatile periods
- Always use proper risk management
- Combine with other technical analysis tools
## 🔧 Troubleshooting
- **No signals**: Check if thresholds are too extreme
- **Too many signals**: Increase threshold sensitivity
- **Table not showing**: Ensure "Show Sentiment Table" is enabled
- **Missing stocks**: Verify individual stock toggles in settings
---
**Suitable for**: Day traders, swing traders, NAS100 specialists, index traders
**Best Timeframes**: 5min, 15min, 1H, 4H
**Market Sessions**: US market hours for highest accuracy
