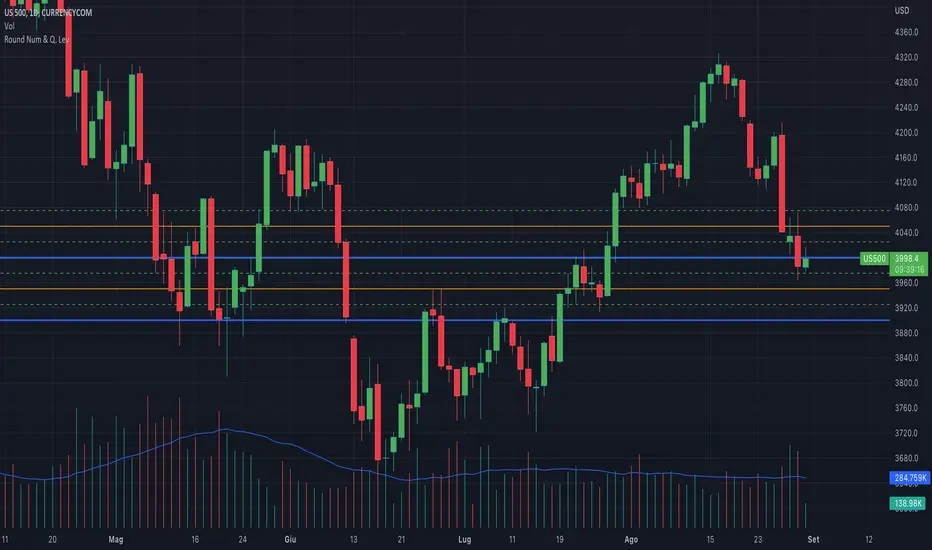
Round Numbers and Quarter LevelsThis script is based on "Round Numbers Above and Below" by BitcoinJesus-Not-Roger-Ver, but unlike this script that only shows "Round Numbers" levels, my script also shows "Quarter Number" levels like 25 and 75 that are very important for those who follow the quarters theory.
Also the original script doesn't have different colors for different levels while my script has different colors and different styles for every level, this way it will be much easyer to recognize the levels at first sight.
Finally the origianl script only works with Forex while my script also works with indexes like SP500 and others.
Round Numbers are very important psychological levels in trading but also quarters levels (25 and 75) have a huge importance, so I created this script that shows all these levels with different colors and different lines style.
You can edit the color and the style of the lines as you wish and you can add all the levels you want.
In 1 hour chart 4 levels is usually enough but if you watch a daily chart then 8 levels is way better.
Features:
Personalize color to 00 round levels
Personalize color to 50 round levels
Personalize color to Quarters levels
Personalize line style to 00 round levels
Personalize line style to 50 round levels
Personalize line style to Quarters levels
Choose number of lines above and below price level (4 is default)
"汇丰股票25"に関するスクリプトを検索
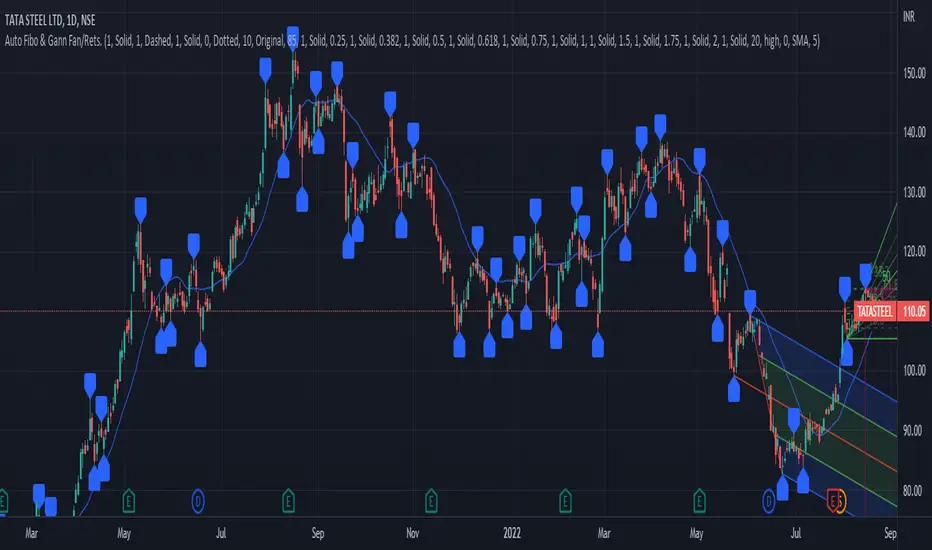
PrasiGanFanFibntroduction
This is a combination of Fibonacci and Gann fan /retracements.
The script can automatically draw as many:
Fibonacci Retracements
Fibonacci Fan
Gann Retracements
Gann Fan
as the user requires on the chart. Each level set or fan consists of 7 lines based on the most important ratios of Fibonacci/ Gann .
Basics
What are Fibonacci retracements?
Fibonacci retracement levels are horizontal lines that indicate where support and resistance are likely to occur. They stem from Fibonacci’s sequence. Each level is associated with a percentage which is how much of a prior move the price has retraced. The Fibonacci retracement levels are 23.6%, 38.2%, 61.8%, and 78.6%. While not officially a Fibonacci ratio, 50% is also used. The indicator is useful because it can be drawn between any two significant price points, such as a high and a low. The indicator will then create the levels between those two points.
What are Gann retracements?
A developer of technical analysis and trading was W.D. Gann . Gann theory expects a normal retracement of 50 percent. This means that under normal selling pressure, the stock price will decline half the amount of its most recent rise, and vice versa. It also suggests that retracements occur at the halfway point of a move, such as 25 percent (half of 50 percent), 12.5 percent (half of 25 percent), and so on.
What is Fibonacci fan?
Fibonacci fan is a set of sequential trend lines drawn from a trough or peak through a set of points dictated by Fibonacci retracements. The first step to create it is to draw a trend line covering the local lowest and highest prices of a security. To reach retracement levels, the trader divides the difference in price at the low and high end by ratios determined by the Fibonacci series. The lines formed by connecting the starting point for the base trend line and each retracement level create the Fibonacci fan.
What is Gann fan?
A Gann fan consists of a series of lines called Gann angles. These angles are superimposed over a price chart to show potential support and resistance levels. The resulting image is supposed to help technical analysts predict price changes. Gann believed the 45-degree angle to be most important, but the Gann fan also draws angles at degrees like 75, 63.75, 26.25 and 15. The Gann fan originates at a low or high point. The resulting lines show areas of potential future support and resistance . The 45-degree line is known as the 1:1 line because the price will rise or fall at a 45-degree angle when the price moves up/down one unit for each unit of time. All other lines in the Gann fan are drawn above and below the 1:1 line. The other angles are associated with 2:1, 3:1, 4:1, 8:1 and 1:8, 1:4, 1:3, and 1:2 time-to-price moves.
Challenges
The most of the time I dedicated to writing this script has been spent on handling these problems:
1. Finding Local Highest/Lowest Prices
In order to draw Fibonacci and Gann fan /retracements, it's necessary to find local highest and lowest price points (Extrema) on the chart. As this could be so challenging, most traders and coders draw the lines covering the low and high prices over a given period of time or a limited number of bars back instead. I already wrote an indicator using this approach (Auto Fibonacci Combo).
In this new script I tried to find the exact highest and lowest prices based on this idea that: if a high point is formed lower than previous high which was after a lowest point, then that previous one was the local highest point, and vice versa if a low point is formed higher than previous low which was after a highest point, then that previous one was the local lowest point. So logically an extremum price on the chart won't be found until the next high/low point is formed.
2. Finding Proper Chart Scale for Gann Fan
Based on the theory, Gann angles are sensitive to the chart price scale and in order to have the right angles, the chart must be made with the proper scale. J.A. Hyerczyk in his book "Pattern, Price & Time - Using Gann Theory in Technical Analysis" suggests that the easiest way to determine the scale of a market is by taking the difference between top-to-top and bottom-to-bottom and dividing it by the time it took the market to move from top to top and bottom to bottom.
Thus on a properly constructed chart, the basic equation for calculating Gann angles is: Price * Time.
3. Drawing Fans and Relocating Fan Labels at Each New Bar in Pine (A Programming-Related Subject)
To do this, I used linear equations and line slopes. Of course it was so complicated and exhausting, but finally I overcame that thanks to my genius cousin.
Settings and Usage
By default, the script shows detected extremum points plus 1 Fibonacci fan, 1 Gann fan , 1 set of Fibonacci retracements and no Gann retracements on the chart. All of these could be changed in the indicator settings beside the color and transparency of each line.
Feel free to use this and send me your thoughts!
Ultimate IndicatorThis is a combination of all the price chart indicators I frequently switch between. It contains my day time highlighter (for day trading), multi-timeframe long-term trend indicator for current commodity in the bottom right, customizable trend EMA which also has multi-timeframe drawing capabilities, VWAP, customizable indicators with separate settings from the trend indicator including: EMA, HL2 over time, Donchian Channels, Keltner Channels, Bollinger Bands, and Super Trend. The settings for these are right below the trend settings and can have their length and multiplier adjusted. All of those also have multi-timeframe capabilities separate from the trend multi-time settings.
The Day Trade Highlight option will draw faint yellow between 9:15-9:25, red between 9:25-9:45, yellow between 9:45-10:05. There will be one white background at 9:30am to show the opening of the market. while the market is open there will be a very faint blue background. For the end of the day there will be yellow between 15:45-15:50, red between 15:50-16:00, and yellow between 16:00-16:05. During the night hours, there is no coloring. The purpose of this highlight is to show the opening / closing times of the market and the hot times for large moves.
The indicators can also be colored in the following ways:
1. Simple = Makes all colors for the indicator Gray
2. Trend = Will use the Donchian Channels to get the short-trend direction and by default will color the short-term direction as Blue or Red. Unless using Super Trend, the Donchian Channel is used to find short-term trend direction.
3. Trend Adv = Will use the Donchian Channels to get the short-trend direction and by default will color the short-term direction as Blue or Red. Unless using Super Trend, the Donchian Channel is used to find short-term trend direction. If there is a short-term up-trend during a long-term down-trend, the Blue will become Navy. If short-term down-trend during long-term up-trend, the Red will be Brown.
4. Squeeze = Compares the Bollinger Bands width to the Keltner Channels width and will color based on relative squeeze of the market: Teal = no squeeze. Yellow = little squeeze. Red = decent squeeze. White = huge squeeze. if you do not understand this one, try drawing the Bollinger Bands while using the Squeeze color option and it should become more apparent how this works. I also recommend leaving the length and multiplier to the default 20 and 2 if using this setting and only changing the timeframe to get longer/shorter lengths as I've seen that changing the length or multiplier can more or less make it not work at all.
Along with the indicator settings are options to draw lines/labels/fills for the indicator. I enjoy having only fills for a cleaner look.
The Labels option will show Buy/Sell signals when the short-term trend flips to agree with the long-term trend.
The Trend Bars option will do the same as the Labels option but instead will color the bars white when a Buy/Sell option is given.
The Range Bars option shows will color a bar white when the Close of a candle is outside of a respective ranging indicator option (Bollinger or Keltner).
The Trend Bars will draw white candles no matter which indicator selection you make (even "Off"). However, Range Bars will only draw white when either Bollinger or Keltner are selected.
The Donchian Channels and Super Trend are trending indicators and should be used during trending markets. I like to use the MACD in conjunction with these indicators for possibly earlier entries.
The Bollinger Bands and Keltner Channel are ranging indicators and should be used during ranging markets. I like to use the RSI in conjunction with these indicators and will use 60/40 for overbought and oversold areas rather than 70/30. During a range, I wait for an overbought or oversold indication and will buy/sell when it crosses back into the middle area and close my position when it touches the opposite band.
I have a MACD/RSI combination indicator if you'd like that as well :D
As always, trade at your own risk. This is not some secret indicator that will 100% win. As always, the trades you see in the picture use a 1:1.5 or 1:2 risk to reward ratio, for today (August 8, 2022) it won 5/6 times with one trade still open at the end of the day. Manage your account correctly and you'll win in the long term. Hit me up with any questions or suggestions. Happy Trading!

TASC 2022.08 Trading The Fear Index█ OVERVIEW
TASC's August 2022 edition of Traders' Tips includes an article by Markos Katsanos titled "Trading The Fear Index". This script implements a trading strategy called the “daily long/short trading system for volatility ETFs” presented in this article.
█ CONCEPTS
This long-term strategy aims to capitalize on stock market volatility by using exchange-traded funds (ETFs or ETNs) linked to the VIX index.
The strategy rules (see below) are based on a combination of the movement of the Cboe VIX index, the readings of the stochastic oscillator applied to the SPY ETF relative to the VIX, and a custom indicator presented in the article and called the correlation trend . Thus, they are not based on the price movement of the traded ETF itself, but rather on the movement of the VIX and of the S&P 500 index. This allows the strategy to capture most of the spikes in volatility while profiting from the long-term time decay of the traded ETFs.
█ STRATEGY RULES
Long rules
Rising volatility: The VIX should rise by more than 50% in the last 6 days.
Trend: The correlation trend of the VIX should be 0.8 or higher and also higher than yesterday's value.
VIX-SPY relative position: The 25-day and 10-day VIX stochastics should be above the 25-day and 10-day SPY stochastics respectively. In addition, the 10-day stochastic of the VIX should be above its yesterday's value.
Long positions are closed if the 10-day stochastic of the SPY rises above the 10-day stochastic of the VIX or falls below the yesterday's value.
Short rules
Declining volatility: The VIX should drop over 20% in the last 6 days and should be down during the last 3 days.
VIX threshold: The VIX should spend less than 35% of time below 15.
VIX-SPY relative position: The 10-day VIX stochastic should be below the 10-day SPY stochastic. In addition, the 10-day SPY stochastic should be higher than the yesterday's value.
Long positions are closed if the first two Long rules are triggered (Rising volatility and Trend).
The script allows you to display the readings of the indicators used in the strategy rules in the form of oscillator time series (as in the preview chart) and/or in the form of a table.

LTF -> HTF volume delta Up/DownThis script derives from my previous Educational LTF -> HTF volume delta script.
Total volume is displayed as columns in the background.
With request.security_lower_tf() we get data from a lower timeframe.
In this case, volume, which is placed in an 'up-array' when the 'lower timeframe close' > 'lower timeframe open',
or in an 'down-array' when the 'lower timeframe close' < 'lower timeframe open'.
This is displayed here as 2 (red/green) lines
When you're at a chart timeframe (Higher timeframe), lower than Daily, the lower timeframe is automatically 50x smaller than the higher timeframe.
Example D = 1440 minutes -> divided by 50 = 28.8 or rounded a lower timeframe of 29 minutes
When this number is below 1, it will take the '1 minute timeframe' as lower timeframe
If the higher timeframe chart is Daily or higher, a 'x minute-lower timeframe' chart is calculated from the timeframe.multiplier multiplied by 25,
for example a 2D higher timeframe will do the 'lower timeframe calculations' with a 50 minute TF (25 * 2 'D')
Looking at for example BTC on the Daily higher timeframe, some interesting observations can be done when looking at the 'spikes'
This script doesn't have build in arrows, it is merely made to give some stimulation,
and hopefully some of you can work further on this technique, because I think it is very promising!
I want to thank Tradingview very deeply, why?
Just so many reasons, development, moderation, organisation, helpdesk, ...
The amount of work they are doing is incredible!

VXD SupercycleVXD is a brand new indicator and still developing. to minimize stop losses and overcome sideways market conditions, Higher Timeframe are recommended
Trend lines
-using Rolling VWAP as trend line to determined if Volume related to a certain price.
-you can switch RVWAP to EMA in the setting
ATR
-trailing 12*ATR and 2.4 Mutiplier
Pivot point and Rejected Block
Pivot show last High and low of a price in past bars
Rejected Block show when that High or Low price are important level to determined if it's Hidden Divergence or Divergence
Symbols on chart show Premium and Discount Prices
X-Cross - show potential reversal trend with weak volume .
O-circle - show potential reversal trend with strong volume .
Setting
Momentum: RSI = 25 , RSI MA = 14
Trend: Rolling VWAP and ATR and Subhag
Trailing STOP: ATR 12 x 2.4
Highlight Bars color when volume is above SMA 6
SMA200 act as TP Line
Risk:Reward Calculation
if Buy your Stoploss will be previous Pivot low
if Sell your Stoploss will be previous Pivot high and will be calculated form there, then show TP in Orange color line
VXD เป็นระบบเทรดที่ผมทดลองเอาหลาย ๆ ไอเดีย ทั้งจาก Youtube facebook และกลุ่มคนต่าง ๆ มารวบรวมไว้ แล้วตกผลึกขึ้นมาเป็นระบบนี้ ใน Timeframe ใหญ่ ๆ สามารถลากได้ทั้ง Cycle กันเลย
Trend lines
-ใช้ Rolling VWAP ของแอพ Tradingview (สามารถตั้งแค่าเป็น EMA ได้)
ATR
-ใช้ค่า ATR 12 Mutiplier 2.4
Pivot point and Rejected Block
Pivot โชว์เส้น High low และมีผลกับออเดอร์ หากแท่งเทียนปิดทะลุเส้นนี้
Rejected Block วาดแนวรับ-ต้าน อัตโนมัติ ใช้ประกอบ RSI ว่ามี Divergence หรือไม่
สัญลักษณ์ต่าง ๆ
X-Cross - แท่งกลืนกิน วอลุ่มน้อย
O-circle - แท่งกลืนกิน มีวอลุ่ม
Setting
Momentum: RSI = 25 , RSI MA = 14
Trend: Rolling VWAP and ATR and Subhag
Trailing STOP: ATR 12 x 2.4
Highlight Bars color when volume is above SMA 6
SMA200 act as TP Line
Risk:Reward Calculation
หาก Buy จุด SL จะอยู่ที่ Pivot low
หาก Sell จุด SL จะอยู่ที่ Pivot high และระบบจะคำนวณจากตรงนั้น จากนั้นแสดงเป็นเส้น TP สีส้ม
This Strategy Combined the following indicators and conditioning by me
ATR , RSI , EMA , SMA
Rolling VWAP - /script/ZU2UUu9T-Rolling-VWAP/
Regression Lines - Subhag form Subhag Ghosh /script/LHHBVpQu-Subhag-Ghosh-Algo-Version-for-banknifty/
Rejection Block , Pivots , High Volume Bars and PPDD form Super OrderBlock / FVG / BoS Tools by makuchaku & eFe /script/aZACDmTC-Super-OrderBlock-FVG-BoS-Tools-by-makuchaku-eFe/
ขอให้รวยครับ.

Real Woodies CCIAs always, this is not financial advice and use at your own risk. Trading is risky and can cost you significant sums of money if you are not careful. Make sure you always have a proper entry and exit plan that includes defining your risk before you enter a trade.
Ken Wood is a semi-famous trader that grew in popularity in the 1990s and early 2000s due to the establishment of one of the earliest trading forums online. This forum grew into "Woodie's CCI Club" due to Wood's love of his modified Commodity Channel Index (CCI) that he used extensively. From what I can tell, the website is still active and still follows the same core principles it did in the early days, the CCI is used for entries, range bars are used to help trader's cut down on the noise, and the optional addition of Woodie's Pivot Points can be used as further confirmation of support and resistance. This is my take on his famous "Woodie's CCI" that has become standard on many charting packages through the years, including a TradingView sponsored version as one of the many stock indicators provided by TradingView. Woodie has updated his CCI through the years to include several very cool additions outside of the standard CCI. I will have to say, I am a bit biased, but I think this is hands down one of the best indicators I have ever used, and I am far too young to have been part of the original CCI Club. Being a daytrader primarily, this fits right in my timeframe wheel house. Woodie designed this indicator to work on a day-trading time scale and he frequently uses this to trade futures and commodity contracts on the 30 minute, often even down to the one minute timeframe. This makes it unique in that it is probably one of the only daytrading-designed indicators out there that I am aware of that was not a popular indicator, like the MACD or RSI, that was just adopted by daytraders.
The CCI was originally created by Donald Lambert in 1980. Over time, it has become an extremely popular house-hold indicator, like the Stochastics, RSI, or MACD. However, like the RSI and Stochastics, there are extensive debates on how the CCI is actually meant to be used. Some trade it like a reversal indicator, where values greater than 100 or less than -100 are considered overbought or oversold, respectively. Others trade it like a typical zero-line cross indicator, where once the value goes above or below the zero-line, a trade should be considered in that direction. Lastly, some treat it as strictly a momentum indicator, where values greater than 100 or less than -100 are seen as strong momentum moves and when these values are reached, a new strong trend is establishing in the direction of the move. The CCI itself is nothing fancy, it just visualizes the distance of the closing price away from a user-defined SMA value and plots it as a line. However, Woodie's CCI takes this simple concept and adds to it with an indicator with 5 pieces to it designed to help the trader enter into the highest probability setups. Bear with me, it initially looks super complicated, but I promise it is pretty straight-forward and a fun indicator to use.
1) The CCI Histogram. This is your standard CCI value that you would find on the normal CCI. Woodie's CCI uses a value of 14 for most trades and a value of 20 when the timeframe is equal to or greater than 30minutes. I personally use this as a 20-period CCI on all time frames, simply for the fact that the 20 SMA is a very popular moving average and I want to know what the crowd is doing. This is your coloured histogram with 4 colours. A gray colouring is for any bars above or below the zero line for 1-4 bars. A yellow bar is a "trend bar", where the long period CCI has been above/below the zero line for 5 consecutive bars, indicating that a trend in the current direction has been established. Blue bars above and red bars below are simply 6+n number of bars above or below the zero line confirming trend. These are used for the Zero-Line Reject Trade (explained below). The CCI Histogram has a matching long-period CCI line that is painted the same colour as the histogram, it is the same thing but is used just to outline the Histogram a bit better.
2) The CCI Turbo line. This is a sped-up 6 period CCI. This is to be used for the Zero-Line Reject trades, trendline breaks, and to identify shorter term overbought/oversold conditions against the main trend. This is coloured as the white line.
3) The Least Squares Moving Average Baseline (LSMA) Zero Line. You will notice that the Zero Line of the indicator is either green or red. This is based on when price is above or below the 25-period LSMA on the chart. The LSMA is a 25 period linear regression moving average and is one of the best moving averages out there because it is more immune to noise than a typical MA. Statistically, an LSMA is designed to find the line of best fit across the lookback periods and identify whether price is advancing, declining, or flat, without the whipsaw that other MAs can be privy to. The zero line of the indicator will turn green when the close candle is over the LSMA or red when it is below the LSMA. This is meant to be a confirmation tool only and the CCI Histogram and Turbo Histogram can cross this zero line without any corresponding change in the colour of the zero line on that immediate candle.
4) The +100 and -100 lines are used in two ways. First, they can be used by the CCI Histogram and CCI Turbo as a sort of minor price resistance and if the CCI values cannot get through these, it is considered weakness in that trade direction until they do so. You will notice that both of these lines are multi-coloured. They have been plotted with the ChopZone Indicator, another TradingView built-in indicator. The ChopZone is a trend identification tool that uses the slope and the direction of a 34-period EMA to identify when price is trending or range bound. While there are ~10 different colours, the main two a trader needs to pay attention to are the turquoise/cyan blue, which indicates price is in an uptrend, and dark red, which indicates price is in a downtrend based on the slope and direction of the 34 EMA. All other colours indicate "chop". These colours are used solely for the Zero-Line Reject and pattern trades discussed below. They are plotted both above and below so you can easily see the colouring no matter what side of the zero line the CCI is on.
5) The +200 and -200 lines are also used in two ways. First, they are considered overbought/oversold levels where if price exceeds these lines then it has moved an extreme amount away from the average and is likely to experience a pullback shortly. This is more useful for the CCI Histogram than the Turbo CCI, in all honesty. You will also notice that these are coloured either red, green, or yellow. This is the Sidewinder indicator portion. The documentation on this is extremely sparse, only pointing to a "relationship between the LSMA and the 34 EMA" (see here: tlc.thinkorswim.com). Since I am not a member of Woodie's CCI Club and never intend to be I took some liberty here and decided that the most likely relationship here was the slope of both moving averages. Therefore, the Sidewinder will be green when both the LSMA and the 34 EMA are rising, red when both are falling, and yellow when they are not in agreement with one another (i.e. one rising/flat while the other is flat/falling). I am a big fan of Dr. Alexander Elder as those who follow me know, so consider this like Woodie's version of the Elder Impulse System. I will fully admit that this version of the Sidewinder is a guess and may not represent the real Sidewinder indicator, but it is next to impossible to find any information on this, so I apologize, but my version does do something useful anyways. This is also to be used only with the Zero-Line Reject trades. They are plotted both above and below so you can easily see the colouring no matter what side of the zero line the CCI is on.
How to Trade It According to Woodie's CCI Club:
Now that I have all of my components and history out of the way, this is what you all care about. I will only provide a brief overview of the trades in this system, but there are quite a few more detailed descriptions listed in the Woodie's CCI Club pamphlet. I have had little success trading the "patterns" but they do exist and do work on occasion. I just prefer to trade with the flow of the markets rather than getting overly scalpy. If you are interested in these patterns, see the pamphlet here (www.trading-attitude.com), hop into the forums and see for yourself, or check out a couple of the YouTube videos.
1) Zero line cross. As simple as any other momentum oscillator out there. When the long period CCI crosses above or below the zero line open a trade in that direction. Extra confirmation can be had when the CCI Turbo has already broken the +100/-100 line "resistance or support". Trend traders may wish to wait until the yellow "trend confirmation bar" has been printed.
2) Zero Line Reject. This is when the CCI Turbo heads back down to the zero line and then bounces back in the same direction of the prevailing trend. These are fantastic continuation trades if you missed the initial entry either on the zero line cross or on the trend bar establishment. ZLR trades are only viable when you have the ChopZone indicator showing a trend (turquoise/cyan for uptrend, dark red for downtrend), the LSMA line is green for an uptrend or red for a downtrend, and the SideWinder is either green confirming the uptrend or red confirming the downtrend.
3) Hook From Extreme. This is the exact same as the Zero Line Reject trade, however, the CCI Turbo now goes to the +100/-100 line (whichever is opposite the currently established trend) and then hooks back into the established trend direction. Ideally the HFE trade needs to have the Long CCI Histogram above/below the corresponding 100 level and the CCI Turbo both breaks the 100 level on the trend side and when it does break it has increased ~20 points from the previous value (i.e. CCI Histogram = +150 with LSMA, CZ, and SW all matching up and trend bars printed on CCI Histogram, CCI Turbo went to -120 and bounced to +80 on last 2 bars, current bar closes with CCI Turbo closing at +110).
4) Trend Line Break. Either the CCI Turbo or CCI Histogram, whichever you prefer (I find the Turbo a bit more accurate since its a faster value) creates a series of higher highs/lows you can draw a trend line linking them. When the line breaks the trendline that is your signal to take a counter trade position. For example, if the CCI Turbo is making consistently higher lows and then breaks the trendline through the zero line, you can then go short. This is a good continuation trade.
5) The Tony Trade. Consider this like a combination zero line reject, trend line break, and weak zero line cross all in one. The idea is that the SW, CZ, and LSMA values are all established in one direction. The CCI Histogram should be in an established trend and then cross the zero line but never break the 100 level on the new side as long as it has not printed more than 9 bars on the new side. If the CCI Histogram prints 9 or less bars on the new side and then breaks the trendline and crosses back to the original trend side, that is your signal to take a reversal trade. This is best used in the Elder Triple Screen method (discussed in final section) as a failed dip or rip.
6) The GB100 Trade. This is a similar trade as the Tony Trade, however, the CCI Histogram can break the 100 level on the new side but has to have made less than 6 bars on the new side. A trendline break is not necessary here either, it is more of a "pop and drop" or "momentum failure" trade trying in the new direction.
7) The Famir Trade. This is a failed CCI Long Histogram ZLR trade and is quite complicated. I have never traded this but it is in the pamphlet. Essentially you have a typical ZLR reject (i.e. all components saying it is likely a long/short continuation trade), but the ZLR only stays around the 50 level, goes back to the trend side, fails there as well immediately after 1 bar and then rebreaks to the new side. This is important to be considered with the LSMA value matching the side of the trade, so if the Famir says to go long, you need the LSMA indicator to also say to go long.
8) The Vegas Trade. This is essentially a trend-reversal trade that takes into account the LSMA and a cup and handle formation on the CCI Long Histogram after it has reached an extreme value (+200/-200). You will see the CCI Histogram hit the extreme value, head towards the zero line, and then sort of round out back in the direction of the extreme price. The low point where it reversed back in the direction of the extreme can be considered support or resistance on the CCI and once the CCI Long Histogram breaks this level again, with LSMA confirmation, you can take a counter trend trade with a stop under/over the highest/lowest point of the last 2 bars as you want to be out quickly if you are wrong without much damage but can get a huge win if you are right and add later to the position once a new trade has formed.
9) The Ghost Trade. This is nothing more than a(n) (inverse) head and shoulders pattern created on the CCI. Draw a trend line connecting the head and shoulders and trade a reversal trade once the CCI Long Histogram breaks the trend line. Same deal as the Vegas Trade, stop over/under the most recent 2 bar high/low and add later if it is a winner but cut quickly if it is a loser.
Like I said, this is a complicated system and could quite literally take years to master if you wanted to go into the patterns and master them. I prefer to trade it in a much simpler format, using the Elder Triple Screen System. First, since I am a day trader, I look to use the 20 period Woodie's on the hourly and look at the CZ, SW, and LSMA values to make sure they all match the direction of the CCI Long Histogram (a trend establishment is not necessary here). It shows you the hourly trend as your "tide". I then drill down to the 15 minute time frame and use the Turbo CCI break in the opposite direction of the trend as my "wave" and to indicate when there is a dip or rip against the main trend. Lastly, I drill down to a 3 minute time frame and enter when the CCI Long Histogram turns back to match the main trend ("ripple") as long as the CCI Turbo has broken the 100 level in the matched direction.
Enjoy, and please read the pamphlet if you have any questions about the patterns as they are not how I use these and will not be able to answer those questions.

OpenCipher AOpenCipher A is an open-source and free to use Overlay.
Features:
EMA Ribbons (Lengths: 5, 11, 15, 18, 21, 25, 29, 33)
Symbols ("Be careful" and "attention required" signals)
EMA Ribbons
The EMA RIbbons are a set of exponential moving averages. Blue and white ribbons = uptrend, gray ribbons = downtrend. The ribbons can act as support in uptrends and as resistance in downtrends.
Lengths and source of the ribbons are customizable.
Symbols
Green Dots: The green dot is a bullish symbol that appears whenever the EMA 11 crosses over EMA 33.
Red Cross: The red cross is a bearish symbol that appears whenever the EMA 5 crosses under EMA 11.
Blue Triangle: The blue triangle marks a possible trend reversal that appears whenever the EMA 5 crosses over EMA 25 while EMA 29 is below EMA 33.
Red Diamond: The red diamond is a bearish symbol that marks a potential local top whenever a bearish wavecross occurs (fast wave crosses under slow wave).
Yellow X: The yellow X is a warning signal that appears whenever a bearish wavecross occurs while the slow wave of the wavetrend is below -40 and the moneyflow is in the red (below zero).
Blood Diamond: The blood diamond is a bearish symbol that highlights whenever the red diamond and the red cross appear on the same candle.
Usage
Treat the symbols as signs that your attention might be required and don't trade based on them.

BB-RSI-ADX Entry PointsThis is a combination of indicators used to find oversold and overbought entry points for possible reversion.
A Green arrow will appear when all condition are met for an ENTER LONG position.
A Red arow will appear when all condition are met for an ENTER SHORT position.
You can modify all of these condition parameters from the indicator's settings.
How does the indicator work
The signals are using Bollinger Bands , BB %B , RSI and ADX indicators to try and find points of reversal
Enter LONG Conditions
Current candle low is below BB lower band.
The BB %B is more than 0.
RSI > 30
ADX > 25
Enter SHORT Conditions
Current candle high is above BB upper band.
The BB %B is less than 1.
RSI < 70
ADX > 25
Those are the default settings that seem to work for me but you can customize all of these from the indicator settings.
I find this strategy to best work on a 3 minute timeframe
Note: The bb %B is calculated for stDev - 1. This will help you see a change happening faster.

MTF RSI ScannerThis RSI scanner can be use to identify the relative strength of 10 symbols over multiple timeframes
it will give you a quick overview which pair is more bearish or more bullish and also signals tops and bottoms in the AVG row
light red/green cell = weak bearish (RSI = 45-35) / bullish (RSI = 55-65)
medium red/green cell = bearish (RSI = 35-25) / bullish (RSI = 65-75)
dark red/green cell = strong bearish (RSI <= 25) / bullish (RSI >= 75)
gray cell = neutral (RSI= 45-55)
Usage
If AVG (average of all 4 timeframes) falls below 30, the cell will get green, indicating a good time to enter long (buy)
If AVG (average of all 4 timeframes) rises above 70, the cell will get red, indicating a good time to enter short (sell)
Use the "MTF RSI Scanner" in combination with the "MTF Stochastic Scanner"
to find tops (RSI MTF avg >=70 AND Stochastic MTF avg >= 80)
or bottoms (RSI MTF avg <= 30 AND Stochastic MTF avg <= 20)
Here is how the two MTF scanners looked on Nov 08 2021 (ATH) »
and here how the MTF scanners looked on June 21 2022
use TradingViews Replay function to check how it would have worked in the past and when not.
As always… there NOT a single indicator that can show to the top & bottom 100% every single time. So use with caution, with other indicators and/or deeper understanding of technicals analysis ☝️☝️☝️
Settings
You can change the timeframes, symbols, RSI settings, overbought/oversold levels and colors to your liking
Drag the table onto the price chart, if you want to use it as an overlay.
NOTE:
Because of the 4x10 security requests, it can take up to 1 minute for changed settings to take effect! Please be patient 🙃
If you have any idea on how to optimise the code, please feel free to share 🙏
*** Inspired by "Binance CHOP Dashboard" from @Cazimiro and "RSI MTF Table" from @mobester16 ***

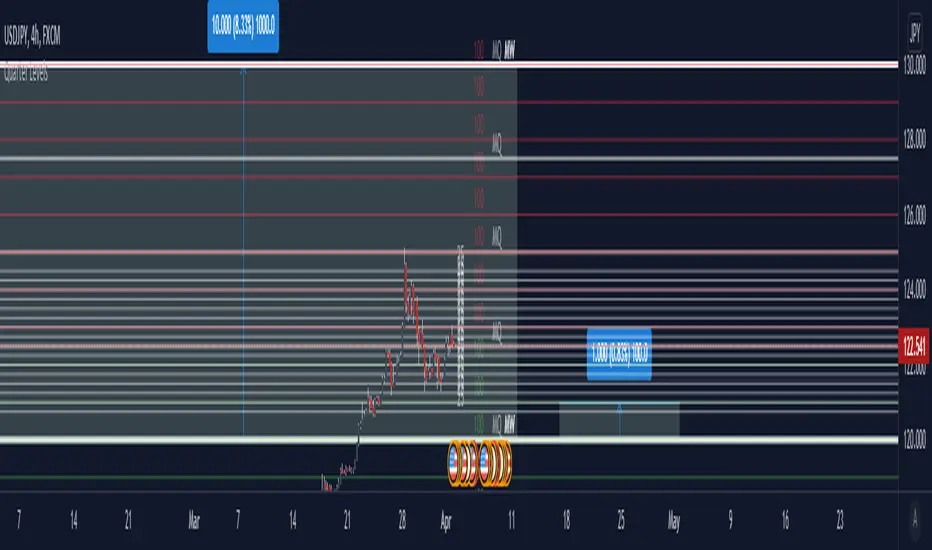
Quarter theory and whole numbersThis is an indicator that marks off Major whole/quarter levels
Between each major whole they are 1000 pips and that can be quarter and give you major quarter levels of 250 pips
Each of the major whole number can be divided into 10 - 100 pip ranges(giving you minor whole number), and you can in turn quarter these to give you 25 pips.
This is the lowest value you would need as price moves in 25 pip.
You can use this on any market as long as you can figure out the conversion from price into pips for you assets (This varies).
crypto futures hourly scalping with ma & rsi - ogcheckershi to all lovable traders,
hereby i want to share a combination of trade ideas for scalping
i've chosen hourly timeframe
indicators used: moving averages and rsi
moving averages:
ema 3, ema 5, ema 7
sma 3, sma 5, sma 7
daily_ema_3, daily_ema_5
daily_ema_5, daily_sma_5
rsi:
rsi 7, rsi 14, rsi 26
daily_rsi_7, daily_rsi_14, daily_rsi_26
as per the analysis over moving average behavioral patterns & rsi movements, useful points are given below which will be helpful while choosing good entry points & exit points,
strategical points for LONG:
* when ema3 crosses above sma3 - green candles start to form
* it's followed by ema5 > sma5 and ema7 > sma7
* when ema3 crosses down sma3 - it's considered as an indication of exit
* if rsi supports then can wait for ema5 crossing down sma5
* as similar, when daily_ema_3 crosses above daily_sma_3, its an higher timeframe bullish indication, so the lower timeframe entries inside this higher timeframe is a sure shot confident entry
* for LONG always take entries when rsi_14 < 30 or 25 else check rsi_7 < 25 or below
* as along the above, bullish CANDLE patterns like bullish engulfing , morning star is been used for entry at lower levels
* so here i've used OPEN as rsi_source in majority
* exit points also indicated at high_rsi and moving average crossunders or reverse crossovers
* for SHORTING, the above said ideas can be used in viceversa
* inputs in the indicator were tailored for users needs so that you will enjoy the magics of customization
if i am wrong in anyways regarding the above indicator strategy, please forgive me and help me improve in this aspect by commenting.
after few more studies and analysis and mainly QUERIES & COMMENTS, i'm planning to backtest these strategies here in tradingview.
also if these strategies are coded in python, we can link it to Binance Futures Algo or Bot Trading.
thankyou for this opportunity,
thanks to tradingview and pinecoders
thanks to Pranab (for 365MA)
thanks to Gandalf (for inspiring)
Special Thanks & Love to Chartbank for Everything

BTC Cap Dominance RSI StrategyThis strategy is based on the BTC Cap Dominance RSI indicator, which is a combination of the RSI of Bitcoin Market Cap and the RSI of Bitcoin Dominance. The concept of this strategy is to get a good grasp of the bitcoin market flow by combining bitcoin dominance as well as bitcoin market cap.
BTC Cap Dominance (BCD) RSI is defined as:
BCD RSI = (BTC Cap RSI + BTC Dominance RSI) / 2
Case 1 (Bull market):
Both Cap RSI and Dominance RSI values are high
Case 2 (Neutral market):
Cap RSI is high but Dominance RSI is low
Cap RSI is low but Dominance RSI is high
Case 3 (Bear market):
Both Cap RSI and Dominance RSI values are low
When the BCD RSI value closes the candle above the Bull level, it triggers a long signal and when the value closes below the Bear level, it triggers a short signal.
(Note) Please note that TradingView's market cap symbols (CRYPTOCAP:TOTAL and CRYPTOCAP:TOTAL2) started in January 2020, so strategy backtesting is possible from this point on.
(Note) Since the real-time BCD RSI value does not come out with this strategy, it is recommended to use it together because the current value can be known and the long-short signal can be predicted in advance by using a separate BCD RSI Index together.
If "Use Combination of dominance RSI ?" is not checked in addition to the recommended default value of the strategy, the recommended values are Length (14), Bull level (74), Bear level (25).
_______________________________________________________________________
이 전략은 비트코인 시가총액의 RSI와 비트코인 도미넌스 RSI를 조합하여 만든 BTC Cap Dominance RSI 지표를 기반으로 만들어졌습니다. 이 전략의 컨셉은 비트코인 시가총액뿐만 아니라 비트코인 도미넌스를 조합함으로써 비트코인 시장 흐름을 잘 파악할 수 있도록 하는 것입니다.
BTC Cap Dominance (BCD) RSI는 다음과 같이 정의하였습니다.
BCD RSI = (BTC Cap RSI + BTC Dominance RSI) / 2
Case 1 (강세 장):
Cap RSI와 Dominance RSI 값 모두 높은 경우
Case 2 (횡보 장):
Cap RSI는 높지만 Dominance RSI는 낮은 경우
Cap RSI는 낮지만 Dominance RSI는 높은 경우
Case 3 (약세 장):
Cap RSI와 Dominance RSI 값 모두 낮은 경우
BCD RSI 값이 Bull level 위에서 캔들 마감할 경우 long 신호를 트리거하고 Bear level 아래에서 캔들 마감할 경우 short 신호를 트리거합니다.
(주의) 트레이딩뷰의 시가총액 심볼들 (CRYPTOCAP:TOTAL과 CRYPTOCAP:TOTAL2)이 2020년 1월부터 시작하였으므로 이 시점부터 전략 백테스팅이 가능한 점을 유의하십시오.
(주의) 이 전략은 실시간 BCD RSI 값이 나오지 않기 때문에 별도의 BCD RSI Index를 함께 사용하면 현재 값을 알 수 있어 롱숏 신호를 사전에 예측할 수 있으므로 함께 사용하기를 권장합니다.
전략의 추천 기본값 외에 "Use Combination of dominance RSI ?"를 체크하지 않는 경우 권장하는 값은 Length (14), Bull level (74), Bear level (25) 입니다.

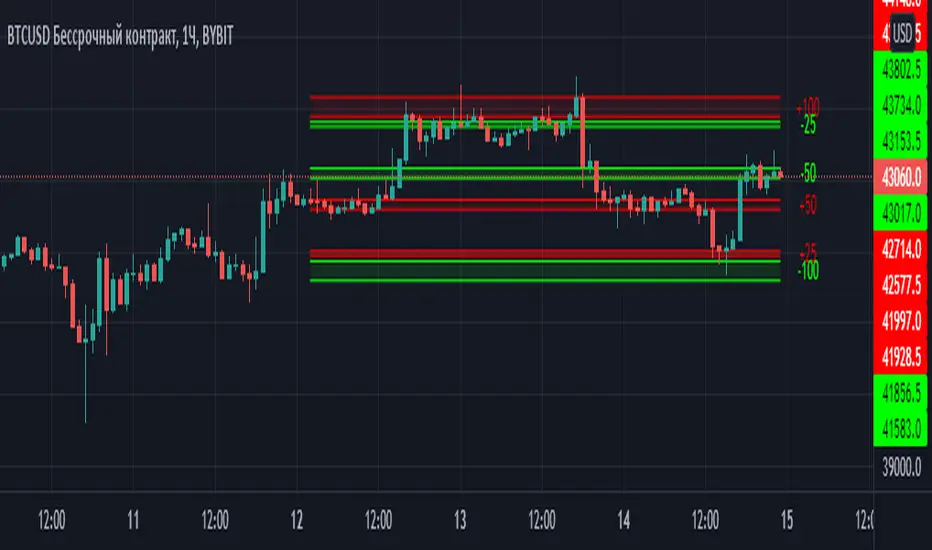
Margin Zones[kryptodude]This indicator is based on the margin requirements of the CME exchange.
Zones act as support and resistance levels, which are more likely to have a price reaction.
The recommended zones for entering a position, as well as taking profits, are zones 50 and 100.
For example, you decide to open a short position on the +100 zone,
in which case it is recommended to place a stop-loss behind the zone.
Take-profit part at -50 and -100, based on the zones from the formed maximum at the +100 zone.
Settings:
Select the currency pair and the exchange on which the indicator will work, For example BINANCE:BTCUSD
"Margin" (for example,now 68280, the next day the margin will be different)
"Tick cost" for BTC = 25 or 12.5
taken from the CME exchange.
"Price max"- High yesterday (for example 44451).
"Price min"- Low yesterday (for example 41280).
Please note, with strong volatility,
it is recommended to change the Tick cost instead of 25 to put 12.5
And also, only dots " . " not commas ", " work in the indicator.
Joint Conditions Strategy Suite + TradingConnector alerts bot"Please give us combined alerts with the possibility of having several conditions in place to trigger the alert." - was the top voted request from users under one of the recent blogposts by TradingView.
Ask and you shall receive ;)
TradingView is a great platform, with unmatched set of functionalities, yet this particular combo of features indeed seems not to be in place. Fortunately, TradingView is also very open platform, thanks to PineScript coding language, which enables developing combos like the requried one and plenty of other magic.
I have already published numerous "educational" scripts, showing how to code indicators and alerts with PineScript, but... this is not one of them. This one is for real. READY FOR USE on real markets, also by the non-coding traders. Just take my script, set parameters with dropdowns, backtest the strategy, fire the alerts and execute them.
HOW TO USE IT
In "Settings" popup I tried to mimic the CreateAlert popup dropdowns for selecting logic. Let's say you want to enter Long position at Stochastic KxD crossover. In first line of Long Entry conditions set "StochK" + "Crossing Up" + "StochD". Last field doesn't matter because in 3rd dropdown something else than "value" was selected. In second line you could set "maB" + "Greater Than" + "maC" to filter out those entries which are in direction of the uptrend. And yeah, add ADX>25 to make sure the market is actually moving: "ADX" + "Greater Than" + "value" + "25". All condition lines must be TRUE (or skipped) for the entry to be triggered. Toghether with an alert.
The same for Short entries. Combinations are limitless.
INDICATORS AND MTF (MULTI-TIMEFRAME)
In those dropdowns you can select candle values like open/close/high/low/ohlc4, but also some most popular indicators, which I have pre-built into this script: RSI, various Moving Averages, ADX-DMI, Stochastic and Bollinger Bands for start. You can configure parameters of those indicators also in "Settings" popup, in "Indicator Definitions" section. What's important, you can use any of these indicators from higher timeframe, setting MTF multiplier. So if you applied this indicator to 1h chart, but want to use rsi(close,14) from 4h chart, set MTF to 4. If you want to use current timeframe indicators, keep MTF at 1, which is a default setting here.
Note for coders: to keep focus of this script on joining conditions, entire logic for those indicators has been moved to external library, also open source. I encourage you to dig into the code and see how it's done. I love the addition of libraries concept in PineScript.
CUSTOM INDICATOR
Following the "openness" spirit of my master - which is TradingView itself - my work is also open, in 2 ways:
1. This script is open source. So you can grab it, modify or add any functionalities you want. I cannot and don't want to stop you from doing that. I'm asking for only one favor - please mention this source script in your credits.
2. You can import the plot (series) from any other indicator on TradingView. In Settings popup of my script, scroll down to "Indicator Definitions" section, and select the series of your choice in the first dropdown. Now it is ready to use in conditions dropdowns on top of the Settings popup.
Let me give you an example of that last scenario. Take another script of mine, "Pivot Points on SR lines DEMO". You can find it in "Indicators & Strategies" library or here: (). Attach it to your chart. Now come back to THIS script, open Settings popup and in "Custom Indicator aka Imported Source" select "Pivot Points on SR lines: ...". The way it works - it detects if a pivot point happened on Support/Resistance line from the past and returns 1 for PivotLow and -1 for Pivot High. Now in first Long Entry condition set: "custom indicator" + "Greater Than" + "value" + "0" and long entries will be marked on every pivot low noticed on Support/Resistance line.
ALERTS
Last but not least - the alerts. This script produces alerts on the entries calculated by strategy logic, as marked on the chart by the backtester. Moreover, syntax of those alerts is already prepared and fully compatible with TradingConnector - alerts executing tool (bot), if you want to auto-execute those trades. Apart from installing the tool, you need to set
up the alerts in TradingView, here is how:
open CreateAlert popup
in first dropdown select "Joint Conditions Strategy Template"
in second dropdown select "alert() function calls only"
And that's all. You only need to set one alert for the whole script, not one for Longs and one for Shorts as it was in the past. Also, you don't need to setup closing alerts, because stop-loss/take-profit/trailing-stop information is embedded in the entry alert so your broker receives it as early as possible. Alerts sent will look like this: "long sl=40 tp=80", which is exactly what TradingConnector expects.
Phew, that's all folks. If you think I should add something to this template (maybe other indicators?) please let me know in comments or via DM. Happy trading!
P.S. Pyramiding is not supported in this script.
Disclaimer : I'm not saying above combination of conditions will make you money. Actually none of this can be considered financial advice. It is only a software tool. Use it wisely, be aware of the risk and do your own research!

Kirill ChannelThis indicator shows overbought and oversold zones. Can be used on all time frames. I personally use 15m - 30m.
How to apply ?:
- There can be many strategies for use! I use this indicator to buy an asset in the green zone and then sell it in the middle of the channel or in the red zone.
- I strongly advise against entering counter-trend positions in a growing market if you have little trading experience and understanding of price action.
How do I place orders ?:
- I place orders in a grid.
- If the price is very close to the edge, but it is difficult to reach it, then it is better to open a position on the market and place orders deep into the grid.
- If the price is at the edge of the channel for a very long time, then you need to look at a higher timeframe.
Algorithm composition:
- ALMA
- Keltner Channel
- Fibonacci Retracement
- Custom price percent offset calculations and manipulations.
Settings:
- I strongly do not recommend changing ALMA. These numbers have been specially calculated.
- It's better not to change Borders either. The current algorithm dynamically changes the width of the extreme channels depending on the price movement.
- The Keltner Channel was specially selected.
- Fibonacci Retracement can be changed. This part of the algorithm can be modified to suit your needs. At the moment, there are settings for aggressive trading.
Channel type:
- Conservative: Fibonacci Retracement settings (100 ma, 100 atr, 8 mult, 100 smooth)
- Aggressive: Fibonacci Retracement settings (25 ma, 25 atr, 3.5 mult, 100 smooth)
Сonservative channel does not allow a large number of points to enter positions, however, it is more straightforward and safer for very large movements.
I prefer aggressive settings because they allow me to make more profit on the number of trades.
Try to use both modes and choose what is preferable for you.

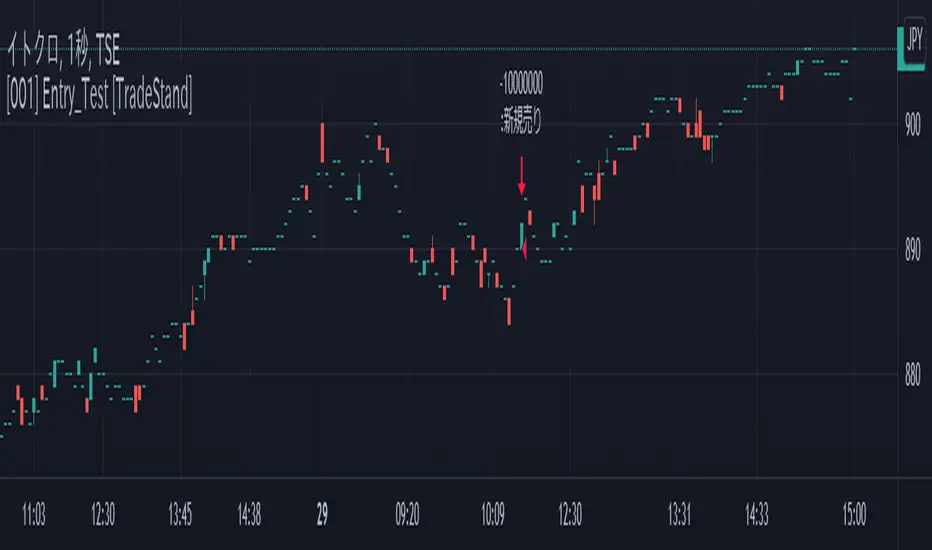
[001] Entry_Test [TradeStand]Entry_Exit_Test .
------------------------------------
Function description
------------------------------------
You can automatically receive an entry alert when the conditions you specify are met.
Settlement alerts can be sent automatically when the conditions you specify are met.
Three types of moving averages can be displayed.
------------------------------------
Entry and Settlement Conditions
------------------------------------
Trade Mode: Select the trade you wish to execute.
Date and time: Enter the date and time you wish to execute the trade.
Number of seconds: If you want to specify the number of seconds, please enter it.
Daily MA: The 5, 25, and 75 day moving averages are displayed.
------------------------------------
------------------------------------
Entry_Exit_Test .
------------------------------------
■機能説明
------------------------------------
あなたが指定した条件を満たした時に、エントリーアラートを自動的に配信することが出来ます。
あなたが指定した条件を満たした時に、決済アラートを自動的に配信することが出来ます。
3種類の移動平均線を表示することが出来ます。
------------------------------------
■エントリー・決済条件
------------------------------------
・トレードモード:実行したいトレードを選択します
・日時:実行したい日時を入力、または選択します
・秒数:秒数まで指定したい場合は入力してください
・日足MA:5、25、75日移動平均線が表示できます

[002] DAY_MA_Pass [TradeStand]Cond_for_Day_MA
------------------------------------
Function description
------------------------------------
You can automatically receive an entry alert when the conditions you specify are met.
Settlement alerts can be sent automatically when the conditions you specify are met.
Three types of moving averages can be displayed.
------------------------------------
Entry and Settlement Conditions
------------------------------------
Trade Mode: Select the trade you wish to execute.
Date and time: Enter the date and time you wish to execute the trade.
Number of seconds: If you want to specify the number of seconds, please enter it.
Daily MA: The 5, 25, and 75 day moving averages are displayed.
Daily MA Trade: Select for this function
Select MA: Select the moving average you want to use as a reference.
Select conditions: Select the current position relative to the moving average
------------------------------------
------------------------------------
Cond_for_Day_MA
日足移動平均線を基準としたエントリー・決済
------------------------------------
■機能説明
------------------------------------
あなたが指定した条件を満たした時に、エントリーアラートを自動的に配信することが出来ます。
あなたが指定した条件を満たした時に、決済アラートを自動的に配信することが出来ます。
3種類の移動平均線を表示することが出来ます。
------------------------------------
■エントリー・決済条件
------------------------------------
選択した時間に、移動平均線を「超えているか」「割っているか」で
エントリー・決済を実行できます。
・トレードモード:実行したいトレードを選択します
・日足MA表示:5、25、75日移動平均線が表示できます
・実行日時:実行したい日時を入力、または選択します
・秒数:秒数まで指定したい場合は入力してください
・日足MA基準トレード:この機能の「OFF/ON」を選択します
・指定 日足移動平均線:基準となる日足移動平均を選択します
・条件:移動平均線に対する現在の位置関係を選択します
WMA Combo Crossover V2Before I begin I want to mention:
1. This is an upgrade of my indicator WMA Combo Crossover. (Link: www.tradingview.com)
2. The upgrade was inspired from the CCI and Bollinger Bands indicator by matsu_bitmex. (Link: www.tradingview.com)
3. I have combined the indictor with Bollinger Bands , coloring those sections as yellow, to increase winning trades as well as avoid losing trades by spotting potential reversals with the aid of news avoidance
4. This indicator is designed primarily for NNFX (No Nonsense Forex) though it can be used for any type of trading style
5. Also, I want to thank kurtisbu for helping me out. Thank you!
The indicator:
1. When WMA 25 is blue and is going upwards, it means there is an uptrend
2. When WMA 25 is red and is going down, it means there is a downtrend
3. During a trend, the color may switch to red and blue occasionally. When the color switches back to the direction of the trend, it can be used for re-entries
4. All trades based on the yellow color MUST be during a trend
5. When the color changes to yellow that means price is very volatile and only on the 1st candle is it advisable to enter a trade. (I have not backtested entering on the 2nd candle of a yellow color change)
6. During a trend, when the color changes to yellow and there is an incoming news event, then the chances of a reversal increase and I recommended avoid entering

Auto Fibonacci and Gann Fan/Retracements ComboIntroduction
This is a combination of Fibonacci and Gann fan/retracements.
The script can automatically draw as many:
Fibonacci Retracements
Fibonacci Fan
Gann Retracements
Gann Fan
as the user requires on the chart. Each level set or fan consists of 7 lines based on the most important ratios of Fibonacci/Gann.
Basics
What are Fibonacci retracements?
Fibonacci retracement levels are horizontal lines that indicate where support and resistance are likely to occur. They stem from Fibonacci’s sequence. Each level is associated with a percentage which is how much of a prior move the price has retraced. The Fibonacci retracement levels are 23.6%, 38.2%, 61.8%, and 78.6%. While not officially a Fibonacci ratio, 50% is also used. The indicator is useful because it can be drawn between any two significant price points, such as a high and a low. The indicator will then create the levels between those two points.
What are Gann retracements?
A developer of technical analysis and trading was W.D. Gann. Gann theory expects a normal retracement of 50 percent. This means that under normal selling pressure, the stock price will decline half the amount of its most recent rise, and vice versa. It also suggests that retracements occur at the halfway point of a move, such as 25 percent (half of 50 percent), 12.5 percent (half of 25 percent), and so on.
What is Fibonacci fan?
Fibonacci fan is a set of sequential trend lines drawn from a trough or peak through a set of points dictated by Fibonacci retracements. The first step to create it is to draw a trend line covering the local lowest and highest prices of a security. To reach retracement levels, the trader divides the difference in price at the low and high end by ratios determined by the Fibonacci series. The lines formed by connecting the starting point for the base trend line and each retracement level create the Fibonacci fan.
What is Gann fan?
A Gann fan consists of a series of lines called Gann angles. These angles are superimposed over a price chart to show potential support and resistance levels. The resulting image is supposed to help technical analysts predict price changes. Gann believed the 45-degree angle to be most important, but the Gann fan also draws angles at degrees like 75, 63.75, 26.25 and 15. The Gann fan originates at a low or high point. The resulting lines show areas of potential future support and resistance. The 45-degree line is known as the 1:1 line because the price will rise or fall at a 45-degree angle when the price moves up/down one unit for each unit of time. All other lines in the Gann fan are drawn above and below the 1:1 line. The other angles are associated with 2:1, 3:1, 4:1, 8:1 and 1:8, 1:4, 1:3, and 1:2 time-to-price moves.
Challenges
The most of the time I dedicated to writing this script has been spent on handling these problems:
1. Finding Local Highest/Lowest Prices
In order to draw Fibonacci and Gann fan/retracements, it's necessary to find local highest and lowest price points (Extrema) on the chart. As this could be so challenging, most traders and coders draw the lines covering the low and high prices over a given period of time or a limited number of bars back instead. I already wrote an indicator using this approach ( Auto Fibonacci Combo ).
In this new script I tried to find the exact highest and lowest prices based on this idea that: if a high point is formed lower than previous high which was after a lowest point, then that previous one was the local highest point, and vice versa if a low point is formed higher than previous low which was after a highest point, then that previous one was the local lowest point. So logically an extremum price on the chart won't be found until the next high/low point is formed.
2. Finding Proper Chart Scale for Gann Fan
Based on the theory, Gann angles are sensitive to the chart price scale and in order to have the right angles, the chart must be made with the proper scale. J.A. Hyerczyk in his book "Pattern, Price & Time - Using Gann Theory in Technical Analysis" suggests that the easiest way to determine the scale of a market is by taking the difference between top-to-top and bottom-to-bottom and dividing it by the time it took the market to move from top to top and bottom to bottom.
Thus on a properly constructed chart, the basic equation for calculating Gann angles is: Price * Time.
3. Drawing Fans and Relocating Fan Labels at Each New Bar in Pine (A Programming-Related Subject)
To do this, I used linear equations and line slopes. Of course it was so complicated and exhausting, but finally I overcame that thanks to my genius cousin.
Settings and Usage
By default, the script shows detected extremum points plus 1 Fibonacci fan, 1 Gann fan, 1 set of Fibonacci retracements and no Gann retracements on the chart. All of these could be changed in the indicator settings beside the color and transparency of each line.
Feel free to use this and send me your thoughts!

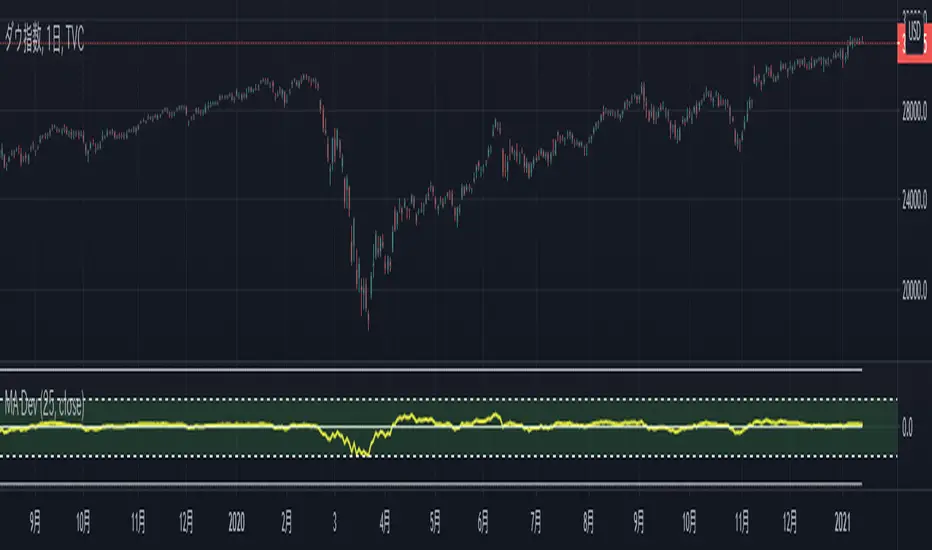
MA Deviation
Script description
A script that displays the deviation rate of the specified moving average line.
You can non-display the oscillator line by setting it.
Default setting
Moving average divergence rate : 25 SMA
Oscillator line (50) : display
Oscillator line (75) : non-display
Oscillator line (100) : non-display
スクリプトの説明
指定した移動平均線の乖離率を表示するスクリプトです。
設定によりオシレーター上の水平線の表示非表示を切り替えることができます。
デフォルト設定
移動平均乖離率:25 SMA
水平線(50):表示
水平線(75):非表示
水平線(100):非表示
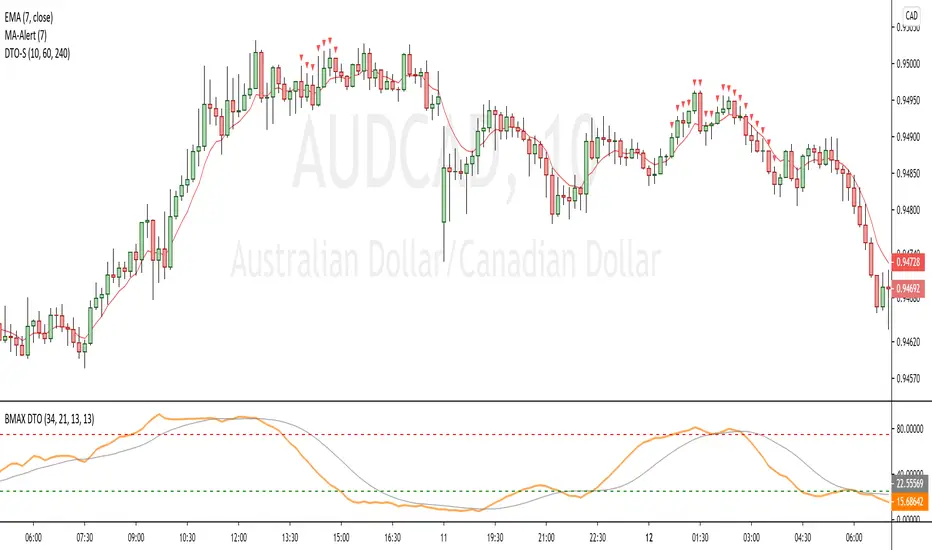
[BMAX] DTO Signal(ENGLISH)
This indicator is a variation of the original DT Oscillator that uses Stochastic and RSI calculations to find momentum opportunities. The purpose of it is to facilitate traking of multiple timeframes for overbought or oversold conditions.
As you can see on the example, we use the DT Oscillator in the selected timeframe, but in order to decide if we take a trade opportunity, we may want to see multiple timeframes in order to check a fractal scenario. DTO Signal indicates when 3 timeframes you select on the configurations are in the same condition, so overbought (above 75) or oversold (bellow 25).
(PORTUGUÊS)
Este indicador é uma variação do indicador DT Oscillator original que utiliza Estocástico e cálculos do RSI para encontrar oportunidades em "momentum". A proposta é facilitar o monitoramento de múltiplos tempos gráficos para condições de sobrecompra ou sobrevenda. Como você pode ver no example, com o uso do DT Oscillator no tempo gráfico escolhido, para que decidamos se tomamos uma posição no mercado, gostaríamos de verificar em múltiplos tempos gráficos uma condição fractal que construa um cenário provavel. DTO Signal indica quando 3 tempos gráficos escolhidos na configuração estão em uma mesma condição, de sobrecompra (acima de 75) ou de sobrevenda (abaixo de 25).
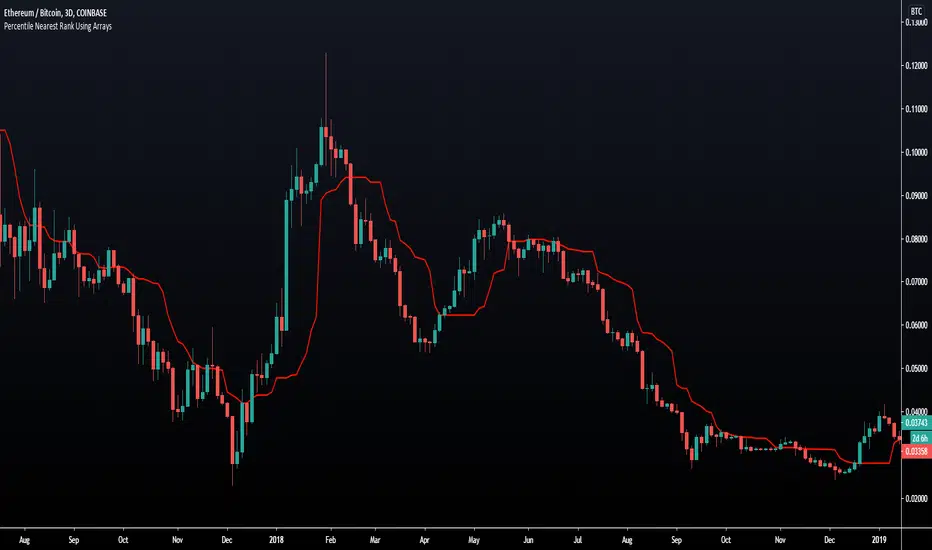
Percentile Nearest Rank Using Arrays [LuxAlgo]The new array feature is extremely powerful, as it will allow pinescript users to do more complex things, or compute existing calculations more efficiently, it will also be possible to shine some light to some already existing functions, one of them being percentile_nearest_rank .
We have been working on this new feature with our pal alexgrover, and made this script which computes a rolling percentile using the nearest rank method.
Settings
Length: Window of the rolling percentile, determine the number of past data to be used.
Percentage: Return the current value if Percentage % of the data fall below that value, the setting is in a range (0,100).
Src: Input source of the indicator.
Usage
A rolling percentile can have many usages when it comes to technical analysis, this is due to its ability to return the value of three common rolling statistics, the rolling median, which can be obtained using a percentage equal to 50, the rolling maximum, obtained with a percentage equal to 100, and the rolling minimum, obtained with a percentage equal to 0.
When we use our rolling percentile as a rolling median, we can obtain a robust estimation of the underlying trend in the price, while using it as a rolling maximum/minimum can allow us to determine if the market is trending, and at which direction. The rolling maximum/minimum is a rolling statistic used to calculate the well known stochastic oscillator and Donchian channel indicator.
We can also compute rolling quartiles, which can be obtained using a percentage of 25 or 75, with one of 25 returning the lower quartile and 75 the upper quartile.
In blue the upper rolling quartile (%75), in orange the lower rolling quartile (%25), both using a window size of 100.
Details
In order to compute a rolling percentile nearest rank, we must first take the most recent length closing prices, then order them in ascending order, we then return the value of the ordered observations at index (percentage/100*length) - 1 (we use - 1 because our array index starts at 0).