Trend Strength Detector TSDTrend Strength Detector (TSD)
*Objective Trend Quality Measurement for Educational Market Analysis*
Note: This mathematical framework is a proprietary quantitative model developed by Ario Pinelab, inspired by classical EMA, ADX, RSI and MACD principles, yet not documented in any public technical or academic publication.
## 🎯 Purpose & Design Philosophy
The ** Trend Strength Detector- TSD ** is an educational research tool that provides **quantitative measurement of trend quality** through two independent scoring systems (0-100 scale). It answers the analytical question: *"How strong and aligned is the current market trend environment?"*
This indicator is designed with a **modular, complementary approach** to work alongside various analysis methodologies, particularly pattern-based recognition systems.
## 🔗 Complementary Research Framework
### Designed to Work With Pattern Detection Systems
This indicator provides **environmental context measurement** that complements qualitative pattern recognition tools. It works particularly well alongside systems like:
- **RMBS Smart Detector - Multi-Factor Momentum System**
- Traditional chart pattern analyzers
- Any momentum-based pattern identification tools
🔍 **To find RMBS Smart Detector:**
- Search in TradingView Indicators Library: `" RMBS Smart Detector - Multi-Factor Momentum System"`
- Look for: *Multi-Factor Momentum System*
- By author: ` `
### Why This Complementary Approach?
**Trend Quality Measurement** (TSD - this tool) provides:
- ✅ Structural trend alignment (0-100 score)
- ✅ Momentum intensity levels (0-100 score)
- ✅ Environment classification (Strong/Moderate/Weak)
- 📌 **Answers:** *"HOW STRONG is the underlying trend environment?"*
### Educational Research Value
When used together in a research context, these tools enable systematic study of questions like:
- How do reversal patterns behave when Strength Score is above 70 vs below 30?
- Do continuation patterns in weakening environments (declining scores) show different characteristics?
- What is the correlation between high Alignment Scores and pattern "success rates"?
- Can environment classification help identify genuine trend initiation vs false starts?
⚠️ **Important Note:** Both tools are **independent and work standalone**. TSD provides value whether used alone or with other analysis methods. The relationship with RMBS (or any pattern tool) is **complementary for research purposes**, not dependent.
---
###Mathematical Foundation
##TSA Formula: scoring method developed by Ario
-Trend Model (0 – 100)
TAS = EMA Alignment (0–40) + Price Position (0–30) + Trend Consistency (0–30)
EMA Alignment checks EMA_fast vs EMA_slow vs EMA_trend structure.
Price Position evaluates if Close is above/below all EMAs.
Consistency = 3 × max(bullish,bearish bars within 10 candles).
-Strength Model (0 – 100)
Strength = ADX (0–50) + EMA Slope (0–25) + RSI (0–15) + MACD (0–10)
ADX measures trend energy; Slope shows EMA momentum %;
RSI assesses zone positioning; MACD confirms directional agreement.
Note: This formula represents a proprietary quantitative model by Ario_Pinelab, inspired by classical technical concepts but not published in any external reference.________________________________________
📊 Environment Classification
Based on Total Strength Score:
🟢 Strong Environment: Score ≥ 60
→ Well-defined momentum, clear directional bias
🟡 Moderate Environment: 40 ≤ Score < 60
→ Mixed signals, transitional conditions
🔴 Weak Environment: Score < 40
→ Ranging, choppy, low conviction movement
Color Coding:
• Green background: Strong (≥60)
• Yellow background: Moderate (40-59)
• Red background: Weak (<40)
________________________________________
📈 Visual Components
Main Chart Display
Score Labels (Top-Right Corner):
┌─────────────────────────────────┐
│ 📊 Alignment: 75 | Strength: 82 │
│ Environment: Strong 🟢 │
└─────────────────────────────────┘
Color-Coded Background:
• Environment strength visually indicated via background color
• Helps quick identification of market regime
• Customizable transparency (default: 90%)
Reference Lines:
• Dotted line at 60: Strong/Moderate threshold
• Dotted line at 40: Moderate/Weak threshold
• Mid-line at 50: Neutral reference
________________________________________
🔧 Customization Settings
Input Parameters
The best setting is the default mode.
🚫 Important Disclaimers & Limitations
What This Indicator IS:
✅ Educational measurement tool for trend quality research
✅ Quantitative assessment of current market environment
✅ Complementary analysis tool for pattern-based systems
✅ Historical data analyzer for systematic study
✅ Multi-factor scoring system based on technical calculations
What This Indicator IS NOT:
❌ NOT a trading system or signal generator
❌ NOT financial advice or trade recommendations
❌ NOT predictive of future price movements
❌ NOT a guarantee of pattern success/failure
❌ NOT a substitute for comprehensive risk management
________________________________________
Known Limitations
1. Lagging Nature:
⚠️ All components (EMA, ADX, RSI, MACD) are calculated
from historical price data
→ Scores reflect CURRENT and RECENT conditions
→ Cannot predict sudden reversals or black swan events
→ Trend measurements lag actual price turning points
2. Whipsaw Risk:
⚠️ In choppy/ranging markets, scores may fluctuate rapidly
→ Moderate zone (40-60) can see frequent transitions
→ Low timeframes more susceptible to noise
→ Consider higher timeframes for stable measurements
3. Component Conflicts:
⚠️ Individual components may disagree
→ Example: Strong ADX but weak RSI alignment
→ Scores average these conflicts (may hide nuance)
→ Check individual components for deeper insight
4. Not Predictive:
⚠️ High scores do NOT guarantee continuation
⚠️ Low scores do NOT guarantee reversal
→ Measurement ≠ Prediction
→ Use for CONTEXT, not SIGNALS
→ Combine with comprehensive analysis
________________________________________
Risk Acknowledgments
Market Risk:
• All trading involves substantial risk of loss
• Past performance (even systematic studies) does not guarantee future results
• No indicator, system, or methodology can eliminate market risk
Measurement Limitations:
• Scores are mathematical calculations, not market predictions
• Environmental classification is descriptive, not prescriptive
• Strong measurements can deteriorate rapidly without warning
Educational Purpose:
• This tool is designed for LEARNING about market structure
• Not designed, tested, or validated as a standalone trading system
• Any trading decisions are user’s sole responsibility
No Warranty:
• Indicator provided “as-is” for educational purposes
• No guarantee of accuracy, reliability, or profitability
• Users must verify calculations and apply critical thinking
Open Source
Full Pine Script code available for educational study and modification. Feedback and improvement suggestions welcome.
“All logic is presented for research and educational visualization.”
---
**Attribution & Fair Use Notice**
The Trend Strength Detector (TSD) scoring framework (Multi-Factor Momentum System) was originally designed and formulated by *Ahmadrezarahmati( Ario or Ario_ Pine Lab)*.
If you build upon, modify, or republish this logic—please include proper attribution to the original author. This request is made under a spirit of open collaboration and educational fairness.
"父亲把15万藏被子里被儿子误扔"に関するスクリプトを検索
ZS Game Changer Pump & Dump DetectorZS GAME CHANGER PUMP AND DUMP DETECTOR - TOP 2 MOMENTUM TRACKER
Created by Zakaria Safri
An intelligent indicator specifically designed to identify and highlight the two most significant pump and dump candles within your selected lookback period. Perfect for traders who want to focus on the game-changing moves that truly matter in volatile markets like cryptocurrency, stocks, and forex.
CORE FEATURES
AUTOMATIC GAME CHANGER DETECTION
The indicator continuously scans your specified lookback period and automatically identifies the top 2 strongest pump candles and top 2 strongest dump candles. These game-changing candles are highlighted with distinctive gold labels and horizontal reference lines, making them instantly visible on your chart. Unlike other indicators that show every small move, this focuses exclusively on the market-moving moments that define trends and create opportunities.
INTELLIGENT PUMP AND DUMP CLASSIFICATION
Uses advanced percentage-based calculations to classify candles as pumps when price surges significantly upward and dumps when price plunges sharply downward. The detection system accounts for candle body size, wick proportions, and volume confirmation to ensure only legitimate momentum moves trigger signals. Customizable thresholds allow adaptation to any market volatility profile from calm stocks to wild altcoins.
ADVANCED WICK EXCLUSION FILTER
Eliminates false signals caused by candles with large wicks and small bodies. This filter focuses analysis exclusively on candles with substantial body sizes that indicate genuine directional conviction rather than temporary spikes followed by rejection. The body to candle ratio is fully adjustable to match your preferred signal quality standards.
VOLUME CONFIRMATION SYSTEM
Optional volume filter ensures detected pumps and dumps are backed by real market participation. The indicator compares current volume against a moving average and only triggers signals when volume exceeds your specified multiplier threshold. This eliminates low-volume noise and focuses on moves supported by institutional or crowd participation.
RALLY SEQUENCE DETECTION
Identifies and highlights consecutive sequences of pump or dump candles with colored background overlays. Green background indicates sustained buying pressure across multiple candles while red background shows sustained selling pressure. The rally detection system includes an optional one-miss allowance that prevents the sequence from breaking due to a single neutral candle.
HORIZONTAL REFERENCE LINES
Draws dashed lines from each game changer candle extending to the current bar, providing constant visual reference to the most significant support and resistance levels created by extreme momentum. The top game changer gets a thick dashed line while the second gets a dotted line for easy differentiation. Labels on the right side display the exact percentage move.
COMPREHENSIVE STATISTICS DASHBOARD
Real-time information panel showing current market status as pumping, dumping, or neutral along with the current candle percentage change. Displays the exact percentage values for top pump number 1, top pump number 2, top dump number 1, and top dump number 2. Shows running totals of all pumps and dumps detected since chart load. Tracks consecutive candle counts during active rally sequences.
TESTING AND VERIFICATION MODE
Built-in debug mode displays percentage change directly on each qualifying pump and dump candle, allowing instant verification that calculations are accurate. Shows which filters are currently active with a simple code in the dashboard. Helps traders understand exactly why certain candles qualified as game changers.
HOW THE GAME CHANGER DETECTION WORKS
SCANNING ALGORITHM
Every bar close, the indicator scans backward through your specified lookback period examining every candle's percentage change from its previous close. For bullish moves, it identifies the two candles with the largest positive percentage change that meet your threshold requirements. For bearish moves, it identifies the two candles with the largest negative percentage change meeting threshold requirements.
RANKING SYSTEM
Candles are ranked purely by their percentage move magnitude. The number 1 game changer is always the single strongest move in the lookback period. The number 2 game changer is the second strongest move. Rankings update dynamically as new candles form and old candles exit the lookback window.
VISUAL IDENTIFICATION
Game changer number 1 for both pumps and dumps receives a large gold label reading GAME CHANGER NUMBER 1 with zero transparency for maximum visibility. Game changer number 2 receives a slightly smaller gold label with partial transparency. The candle bars themselves are colored in gold instead of the standard green or red. Horizontal lines extend from the game changer price level to current bar.
FILTER APPLICATION
Only candles that pass your configured filters qualify for game changer consideration. If wick exclusion is enabled, candles with large wicks and small bodies are ignored. If volume confirmation is enabled, only candles with above-average volume qualify. This ensures game changers represent legitimate market moves rather than aberrations.
PRACTICAL APPLICATIONS
FOR CRYPTOCURRENCY TRADERS
Crypto markets experience extreme volatility with occasional massive pump and dump candles that define entire trends. This indicator instantly identifies which candles represent true market structure shifts versus normal noise. Use the game changer levels as key support and resistance for entries, exits, and stop placement. The top pump often marks the local high to watch for breakouts while the top dump marks the local low for reversal trades.
FOR DAY TRADERS
Intraday charts contain hundreds of candles but only a few truly matter for the session outcome. Game changer detection filters out 98 percent of candles to show you the 2 percent that drove the actual price movement. Enter trades on the side of the strongest recent game changer. Use game changer levels as magnet prices where algorithmic trading often returns.
FOR SWING TRADERS
On daily and four-hour timeframes, game changers represent major institutional activity or news-driven moves. The top dump often marks capitulation selling that creates reversal opportunities. The top pump often marks FOMO buying that creates resistance levels. Swing traders can build positions knowing these levels will be defended or tested multiple times.
FOR VOLATILITY ANALYSIS
Understanding which candles created the most volatility helps assess market risk. Multiple game changers clustered together indicate unstable choppy conditions. Game changers separated by many neutral candles indicate trending stable conditions. Use this context to adjust position sizing and stop distances appropriately.
FOR SUPPORT AND RESISTANCE TRADING
Game changer candles create the strongest support and resistance levels because they represent prices where massive volume transacted in short time periods. These levels have higher probability of holding on retest compared to arbitrary moving averages or pivot points. Trade bounces off game changer levels or breakouts through them.
RECOMMENDED SETTINGS BY MARKET
CRYPTOCURRENCY 15-MINUTE TO 1-HOUR CHARTS
Candle Size Threshold: 2.0 percent
Body to Candle Ratio: 0.5
Volume Multiplier: 1.5 times average
Game Changer Lookback: 100 bars
Extreme Threshold: 3.5 percent
Enable Wick Filter: Yes
Enable Volume Confirmation: Yes
Minimum Rally Candles: 3
STOCKS DAILY CHARTS
Candle Size Threshold: 1.0 percent
Body to Candle Ratio: 0.6
Volume Multiplier: 2.0 times average
Game Changer Lookback: 50 bars
Extreme Threshold: 2.5 percent
Enable Wick Filter: Yes
Enable Volume Confirmation: Yes
Minimum Rally Candles: 2
FOREX 1-HOUR TO 4-HOUR CHARTS
Candle Size Threshold: 0.5 percent
Body to Candle Ratio: 0.5
Volume Multiplier: Not applicable
Game Changer Lookback: 80 bars
Extreme Threshold: 1.0 percent
Enable Wick Filter: Yes
Enable Volume Confirmation: No
Minimum Rally Candles: 3
SCALPING 1-MINUTE TO 5-MINUTE CHARTS
Candle Size Threshold: 0.8 percent
Body to Candle Ratio: 0.4
Volume Multiplier: 1.2 times average
Game Changer Lookback: 50 bars
Extreme Threshold: 1.5 percent
Enable Wick Filter: No
Enable Volume Confirmation: Yes
Minimum Rally Candles: 2
WHAT IS INCLUDED
Automatic identification of top 2 pump candles
Automatic identification of top 2 dump candles
Gold colored game changer labels with size differentiation
Gold colored candle bars for game changers
Horizontal reference lines from game changers to current price
Regular pump and dump detection with green and red candles
Rally sequence detection with background highlighting
Extreme move detection and labeling system
Real-time statistics dashboard with all key metrics
Percentage change debug mode for verification
Volume confirmation filter with adjustable multiplier
Wick exclusion filter with adjustable body ratio
Customizable lookback period from 20 to 500 bars
Consecutive candle counter for rally tracking
Alert system for game changers, pumps, dumps, and rallies
Works on all timeframes from 1 minute to monthly
Compatible with stocks, forex, cryptocurrency, and futures
UNDERSTANDING GAME CHANGERS
WHAT MAKES A CANDLE A GAME CHANGER
A game changer is not just a large move but the largest move within context. In a volatile crypto market, a 5 percent pump might not rank in the top 2. In a stable stock, a 2 percent pump could be the number 1 game changer. The indicator adapts to your specific instrument and timeframe to find what truly matters in that context.
WHY FOCUS ON TOP 2 ONLY
Markets are driven by a small number of significant moves rather than the average of all moves. By focusing exclusively on the top 2 in each direction, traders can ignore noise and concentrate on the price levels that actually matter for support, resistance, and momentum. This creates clarity in decision making.
GAME CHANGERS AS MARKET STRUCTURE
The top pump often marks the recent high that bulls must break to continue uptrend. The top dump often marks the recent low that bears must break to continue downtrend. These become the key levels around which all other price action rotates. Understanding this structure is essential for profitable trading.
GAME CHANGERS AS SENTIMENT INDICATORS
Consecutive pump game changers signal strong bullish sentiment and FOMO conditions. Consecutive dump game changers signal fear and capitulation. Alternating pump and dump game changers signal indecision and range conditions. Read the pattern of game changers to gauge market psychology.
VERIFICATION AND TESTING
HOW TO VERIFY ACCURACY
Enable Show Debug Info on Chart in the Testing and Debug settings group. This displays the percentage change calculation directly on every qualifying pump and dump candle. Manually verify by calculating open minus close divided by close multiplied by 100. The debug percentage should match your manual calculation exactly.
HOW TO TEST FILTERS
Toggle wick exclusion filter on and off while watching how many candles qualify. With filter on, candles with long wicks and small bodies should disappear. Toggle volume confirmation on and off to see how low-volume candles get excluded. Adjust the thresholds and watch the real-time impact on signal count.
HOW TO VERIFY GAME CHANGERS
Look at your chart and visually identify which candle had the biggest green body in the lookback period. The game changer number 1 pump label should be on that exact candle. Repeat for the biggest red candle to verify game changer number 1 dump. The rankings should match your visual assessment.
LOOKBACK PERIOD EFFECTS
Decrease the lookback period to 20 bars and watch game changers update to only recent moves. Increase to 500 bars and watch game changers potentially change to older historic moves. The optimal lookback balances recency with significance. Too short misses important levels, too long includes irrelevant history.
DASHBOARD INFORMATION GUIDE
STATUS ROW
Shows PUMPING when current candle qualifies as a pump, DUMPING when current candle qualifies as a dump, or NEUTRAL when current candle does not meet threshold requirements. This updates in real-time on every bar close.
CURRENT CHANGE ROW
Displays the percentage change of the current candle from its previous close. Positive percentages indicate bullish candle, negative indicate bearish candle. This number may or may not meet your threshold to qualify as pump or dump.
TOP PUMP NUMBER 1
The highest positive percentage change found in your lookback period. This candle is marked with the large gold GAME CHANGER NUMBER 1 label below it. Shows N/A if no pumps exist in the lookback period.
TOP PUMP NUMBER 2
The second highest positive percentage change found in your lookback period. Marked with smaller gold GAME CHANGER NUMBER 2 label. Shows N/A if only one or zero pumps exist.
TOP DUMP NUMBER 1
The highest negative percentage change magnitude found in your lookback period. This candle is marked with the large gold GAME CHANGER NUMBER 1 label above it. Shows N/A if no dumps exist.
TOP DUMP NUMBER 2
The second highest negative percentage change magnitude found in your lookback period. Marked with smaller gold GAME CHANGER NUMBER 2 label. Shows N/A if only one or zero dumps exist.
TOTAL PUMPS
Running count of all pump candles detected since you loaded the indicator on this chart. This number continuously increases as new qualifying pumps form. Resets when you reload the chart.
TOTAL DUMPS
Running count of all dump candles detected since chart load. Increases as new qualifying dumps form and resets on chart reload.
CONSECUTIVE
Shows the current count of consecutive pump or dump candles during an active rally. Displays 3 UP during a 3-candle pump rally or 5 DN during a 5-candle dump rally. Shows 0 when no rally is active.
ALERT SYSTEM
GAME CHANGER DETECTED ALERT
Triggers whenever the current candle becomes one of the top 2 pumps or top 2 dumps. This is the highest priority alert indicating a market-moving event just occurred. Use this alert for immediate notification of significant opportunities.
PUMP DETECTED ALERT
Triggers on every candle that qualifies as a pump according to your threshold and filter settings. This includes regular pumps and extreme pumps but excludes game changers which have their separate alert. Use for general upward momentum monitoring.
DUMP DETECTED ALERT
Triggers on every candle that qualifies as a dump according to your settings. Includes regular and extreme dumps but excludes game changers. Use for general downward momentum monitoring.
PUMP RALLY STARTED ALERT
Triggers when consecutive pump candles reach your minimum rally threshold. Indicates the beginning of a sustained upward movement sequence. Use to catch trends early.
DUMP RALLY STARTED ALERT
Triggers when consecutive dump candles reach your minimum rally threshold. Indicates the beginning of a sustained downward movement sequence. Use for trend following or reversal timing.
ALERT MESSAGE FORMAT
All alerts include the ticker symbol and current price using TradingView placeholders. Messages are descriptive and specify which type of signal triggered. Alerts work with TradingView notification system including email, SMS, webhook, and app notifications.
TECHNICAL SPECIFICATIONS
CALCULATION METHODOLOGY
Percentage change calculated as current close minus previous close divided by previous close multiplied by 100. Body ratio calculated as absolute value of close minus open divided by high minus low. Volume elevation calculated as current volume divided by 20-period simple moving average of volume. Game changer ranking uses absolute value comparison across entire lookback array.
PERFORMANCE CHARACTERISTICS
Lightweight calculations optimized for speed on all timeframes. No repainting of signals ensuring all triggers are final on bar close. Variables properly scoped with var keyword for memory efficiency. Maximum bars back set to 500 to prevent excessive historical loading. Updates in real-time on every bar close without lag.
COMPATIBILITY
Works on all TradingView plans including free, pro, and premium. Compatible with stocks, forex, cryptocurrency, futures, indices, and commodities. Functions correctly on all timeframes from 1 second to monthly. No external data requests ensuring fast loading. Overlay true setting places directly on price chart.
RISK DISCLAIMER
This indicator is a technical analysis tool for identifying momentum and should not be used as the sole basis for trading decisions. Game changer levels can be broken during strong trends and are not guaranteed support or resistance. Pump and dump detection does not predict future price direction. Always use proper risk management with stop losses on every trade. Combine this indicator with other forms of analysis including fundamentals, market context, and risk assessment. Practice on demo accounts before live trading. Past performance of game changer signals does not guarantee future results. Trading carries substantial risk of loss and is not suitable for all investors. The creator is not responsible for trading losses incurred while using this tool.
SUPPORT AND UPDATES
Regular updates based on user feedback and market evolution. Built following PineCoders industry standards and best practices for code quality. Clean well-documented code structure for transparency and auditability. Optimized performance across all timeframes and instruments. Active development with continuous improvements and feature additions.
WHY CHOOSE ZS GAME CHANGER PUMP AND DUMP DETECTOR
Focuses on what matters by highlighting only the top 2 moves in each direction instead of cluttering your chart with every small fluctuation. Saves time by automatically identifying the most significant candles rather than requiring manual scanning. Provides clarity through visual gold labels and reference lines that make game changers unmistakable. Adapts to any market with customizable thresholds for volatility and volume. Eliminates noise with advanced wick and volume filters ensuring signal quality. Offers verification through debug mode proving calculations are accurate and trustworthy. Includes comprehensive statistics showing exact percentages and counts. Works everywhere across all markets, timeframes, and instruments without modification.
Transform your chart analysis by focusing exclusively on the game-changing moments that define trends and create opportunities.
Version 1.1 | Created by Zakaria Safri | Pine Script Version 5 | PineCoders Compliant

Curved Radius Supertrend [BOSWaves]Curved Radius Supertrend — Adaptive Parabolic Trend Framework with Dynamic Acceleration Geometry
Overview
The Curved Radius Supertrend introduces an evolution of the classic Supertrend indicator - engineered with a dynamic curvature engine that replaces rigid ATR bands with parabolic, radius-based motion. Traditional Supertrend systems rely on static band displacement, reacting linearly to volatility and often lagging behind emerging price acceleration. The Curved Radius Supertend model redefines this by integrating controlled acceleration and curvature geometry, allowing the trend bands to adapt fluidly to both velocity and duration of price movement.
The result is a smoother, more organic trend flow that visually captures the momentum curve of price action - not just its direction. Instead of sharp pivots or whipsaws, traders experience a structurally curved trajectory that mirrors real market inertia. This makes it particularly effective for identifying sustained directional phases, detecting early trend rotations, and filtering out noise that plagues standard Supertrend methodologies.
Unlike conventional band-following systems, the Curved Radius framework is time-reactive and velocity-aware, providing a nuanced signal structure that blends geometric precision with volatility sensitivity.
Theoretical Foundation
The Curved Radius Supertrend draws from the intersection of mathematical curvature dynamics and adaptive volatility processing. Standard Supertrend algorithms extend from Average True Range (ATR) envelopes - a linear measure of volatility that moves proportionally with price deviation. However, markets do not expand or contract linearly. Trend velocity typically accelerates and decelerates in nonlinear arcs, forming natural parabolas across price phases.
By embedding a radius-based acceleration function, the indicator models this natural behavior. The core variable, radiusStrength, controls how aggressively curvature accelerates over time. Instead of simply following price distance, the band now evolves according to temporal acceleration - each bar contributes incremental velocity, bending the trend line into a radius-like curve.
This structural design allows the indicator to anticipate rather than just respond to price action, capturing momentum transitions as curved accelerations rather than binary flips. In practice, this eliminates the stutter effect typical of standard Supertrends and replaces it with fluid directional motion that better reflects actual trend geometry.
How It Works
The Curved Radius Supertrend is constructed through a multi-stage process designed to balance price responsiveness with geometric stability:
1. Baseline Supertrend Core
The framework begins with a standard ATR-derived upper and lower band calculation. These define the volatility envelope that constrains potential price zones. Directional bias is determined through crossover logic - prices above the lower band confirm an uptrend, while prices below the upper band confirm a downtrend.
2. Curvature Acceleration Engine
Once a trend direction is established, a curvature engine is activated. This system uses radiusStrength as a coefficient to simulate acceleration per bar, incrementally increasing velocity over time. The result is a parabolic displacement from the anchor price (the price level at trend change), creating a curved motion path that dynamically widens or tightens as the trend matures.
Mathematically, this acceleration behaves quadratically - each new bar compounds the previous velocity, forming an exponential rate of displacement that resembles curved inertia.
3. Adaptive Smoothing Layer
After the radius curve is applied, a smoothing stage (defined by the smoothness parameter) uses a simple moving average to regulate curve noise. This ensures visual coherence without sacrificing responsiveness, producing flowing arcs rather than jagged band steps.
4. Directional Visualization and Outer Envelope
Directional state (bullish or bearish) dictates both the color gradient and band displacement. An outer envelope is plotted one ATR beyond the curved band, creating a layered trend visualization that shows the extent of volatility expansion.
5. Signal Events and Alerts
Each directional transition triggers a 'BUY' or 'SELL' signal, clearly labeling phase shifts in market structure. Alerts are built in for automation and backtesting.
Interpretation
The Curved Radius Supertrend reframes how traders visualize and confirm trends. Instead of simply plotting a trailing stop, it maps the dynamic curvature of trend development.
Uptrend Phases : The band curves upward with increasing acceleration, reflecting the market’s growing directional velocity. As curvature steepens, conviction strengthens.
Downtrend Phases : The band bends downward in a mirrored acceleration pattern, indicating sustained bearish momentum.
Trend Change Points : When the direction flips and a new anchor point forms, the curve resets - providing a clean, early visual confirmation of structural reversal.
Smoothing and Radius Interplay : A lower radius strength produces a tighter, more reactive curve ideal for scalping or short timeframes. Higher values generate broad, sweeping arcs optimized for swing or positional analysis.
Visually, this curvature system translates market inertia into shape - revealing how trends bend, accelerate, and ultimately exhaust.
Strategy Integration
The Curved Radius Supertrend is versatile enough to integrate seamlessly into multiple trading frameworks:
Trend Following : Use BUY/SELL flips to identify emerging directional bias. Strong curvature continuation confirms sustained momentum.
Momentum Entry Filtering : Combine with oscillators or volume tools to filter entries only when the curve slope accelerates (high momentum conditions).
Pullback and Re-entry Timing : The smooth curvature of the radius band allows traders to identify shallow retracements without premature exits. The band acts as a dynamic, self-adjusting support/resistance arc.
Volatility Compression and Expansion : Flattening curvature indicates volatility compression - a potential pre-breakout zone. Rapid re-steepening signals expansion and directional conviction.
Stop Placement Framework : The curved band can serve as a volatility-adjusted trailing stop. Because the curve reflects acceleration, it adapts naturally to market rhythm - widening during momentum surges and tightening during stagnation.
Technical Implementation Details
Curved Radius Engine : Parabolic acceleration algorithm that applies quadratic velocity based on bar count and radiusStrength.
Anchor Logic : Resets curvature at each trend change, establishing a new reference base for directional acceleration.
Smoothing Layer : SMA-based curve smoothing for noise reduction.
Outer Envelope : ATR-derived band offset visualizing volatility extension.
Directional Coloring : Candle and band coloration tied to current trend state.
Signal Engine : Built-in BUY/SELL markers and alert conditions for automation or script integration.
Optimal Application Parameters
Timeframe Guidance :
1-5 min (Scalping) : 0.08–0.12 radius strength, minimal smoothing for rapid responsiveness.
15 min : 0.12–0.15 radius strength for intraday trends.
1H : 0.15–0.18 radius strength for structured short-term swing setups.
4H : 0.18–0.22 radius strength for macro-trend shaping.
Daily : 0.20–0.25 radius strength for broad directional curves.
Weekly : 0.25–0.30 radius strength for smooth macro-level cycles.
The suggested radius strength ranges provide general structural guidance. Optimal values may vary across assets and volatility regimes, and should be refined through empirical testing to account for instrument-specific behavior and prevailing market conditions.
Asset Guidance :
Cryptocurrency : Higher radius and multiplier values to stabilize high-volatility environments.
Forex : Midrange settings (0.12-0.18) for clean curvature transitions.
Equities : Balanced curvature for trending sectors or momentum rotation setups.
Indices/Futures : Moderate radius values (0.15-0.22) to capture cyclical macro swings.
Performance Characteristics
High Effectiveness :
Trending environments with directional expansion.
Markets exhibiting clean momentum arcs and low structural noise.
Reduced Effectiveness :
Range-bound or low-volatility conditions with repeated false flips.
Ultra-short-term timeframes (<1m) where curvature acceleration overshoots.
Integration Guidelines
Confluence Framework : Combine with structure tools (order blocks, BOS, liquidity zones) for entry validation.
Risk Management : Trail stops along the curved band rather than fixed points to align with adaptive market geometry.
Multi-Timeframe Confirmation : Use higher timeframe curvature as a trend filter and lower timeframe curvature for execution timing.
Curve Compression Awareness : Treat flattening arcs as potential exhaustion zones - ideal for scaling out or reducing exposure.
Disclaimer
The Curved Radius Supertrend is a geometric trend model designed for professional traders and analysts. It is not a predictive system or a guaranteed profit method. Its performance depends on correct parameter calibration and sound risk management. BOSWaves recommends using it as part of a comprehensive analytical framework, incorporating volume, liquidity, and structural context to validate directional signals.
ZS Master Vision Pro - Advanced Multi-Timeframe Trading SystemZS MASTER VISION PRO - PROFESSIONAL TRADING SUITE
Created by Zakaria Safri
A comprehensive, all-in-one trading system combining multiple proven technical analysis methods into a single, powerful indicator. Designed for traders who demand precision, clarity, and actionable signals across all timeframes.
KEY FEATURES
CORE TREND ALGORITHM
Adaptive ATR-based trend detection with dynamic support and resistance zones. Features Type A and Type B signal modes for different trading styles, strong signal detection in key reversal zones, and optional EMA source smoothing for noise reduction.
MULTI-LAYER EMA CLOUD SYSTEM
Five customizable EMA cloud layers for multi-timeframe analysis with theme-adaptive color coding across five professional themes. Optional line display for detailed MA tracking with configurable periods from scalping to position trading.
WAVE TREND OSCILLATOR
Advanced momentum oscillator with channel-based calculations featuring smart reversal detection at extreme overbought and oversold levels. Includes directional strength confirmation and customizable sensitivity with adjustable reaction periods.
DIVERGENCE SCANNER
Detects four types of divergence automatically:
- Regular Bullish: Price making lower lows while oscillator making higher lows
- Regular Bearish: Price making higher highs while oscillator making lower highs
- Hidden Bullish: Trend continuation signals in uptrends
- Hidden Bearish: Trend continuation signals in downtrends
Automatic fractal-based detection with clear visual labels on chart.
MARKET BIAS INDICATOR
Heikin Ashi-based trend strength analysis with real-time bias calculation showing Bullish or Bearish combined with Strong or Weak conditions. Smoothed for cleaner signals and perfect for trend confirmation.
MOMENTUM SYSTEM
Proprietary momentum calculation using adaptive smoothing with growing and falling state detection. Normalized values for consistent interpretation and responsive to rapid market changes.
DYNAMIC SUPPORT AND RESISTANCE
Automatic pivot-based support and resistance level detection with adjustable left and right bar lookback. Non-repainting levels with visual clarity through color-coded lines.
LIVE INFORMATION DASHBOARD
Real-time market analysis panel displaying current trend direction, market bias based on Heikin Ashi, Wave Trend status and value, and momentum trend with state. Customizable display options with theme-adaptive colors.
VISUAL CUSTOMIZATION
FIVE PROFESSIONAL COLOR THEMES:
Pro - Modern green and red color scheme (default)
Classic - Traditional teal and red combination
Cyberpunk - Neon cyan and magenta contrast
Ocean - Blue and orange contrast
Sunset - Gold and red warmth
SIGNAL STYLES:
Labels with emoji indicators (BUY with rocket, SELL with bear, STRONG with lightning)
Arrows for clean minimal appearance
Triangles for classic approach
DISPLAY OPTIONS:
Color-coded candles following trend direction
Trend background highlighting for instant trend recognition
Optional EMA line display for detailed analysis
Adjustable transparency levels for personal preference
SMART ALERTS
Pre-configured alert conditions for all major signals:
Buy signals for standard entry opportunities
Sell signals for standard exit or short opportunities
Strong buy signals for high-confidence long entries
Strong sell signals for high-confidence short entries
Bullish divergence detection alerts
Bearish divergence detection alerts
Alert messages automatically include ticker symbol, current price, and specific signal type for quick decision making.
HOW TO USE
FOR TREND TRADERS:
Enable EMA Clouds with focus on Cloud 5 featuring 50 and 200 period moving averages. Wait for trend background color change to confirm direction. Enter on STRONG signals aligned with higher timeframe trend direction. Use support and resistance levels for strategic exits.
FOR SWING TRADERS:
Enable Wave Trend Oscillator information display. Look for oversold and overbought reversal setups. Confirm potential reversals with divergence scanner. Enter on smart reversal signals with proper risk management.
FOR SCALPERS:
Use Type B signal mode for more frequent trading signals. Enable Cloud 1 with 5 and 13 periods for quick trend confirmation. Focus on momentum growing and falling states for entry timing. Take quick entries on regular buy and sell signals.
FOR POSITION TRADERS:
Use Type A mode with higher ATR multiplier set to 3.0 or above. Enable only Cloud 5 with 50 and 200 periods for major trend confirmation. Only take STRONG signals for highest probability setups. Hold positions through minor pullbacks and noise.
RECOMMENDED SETTINGS
STOCKS ON DAILY TIMEFRAME:
Trend Period: 180
ATR Period: 155
ATR Multiplier: 2.1
Signal Mode: Type A
FOREX ON HOURLY AND 4-HOUR TIMEFRAMES:
Trend Period: 150
ATR Period: 120
ATR Multiplier: 2.5
Signal Mode: Type A
CRYPTOCURRENCY ON 15-MINUTE AND 1-HOUR TIMEFRAMES:
Trend Period: 100
ATR Period: 80
ATR Multiplier: 3.0
Signal Mode: Type B
SCALPING ON 1-MINUTE AND 5-MINUTE TIMEFRAMES:
Trend Period: 50
ATR Period: 40
ATR Multiplier: 2.0
Signal Mode: Type B
WHAT IS INCLUDED
Trend Analysis using ATR-based adaptive algorithm
Five EMA Cloud Layers for multi-timeframe confluence
Wave Trend Oscillator for momentum and reversal detection
Divergence Scanner detecting four types of divergence
Market Bias using Heikin Ashi-based trend strength
Momentum System with advanced momentum tracking
Support and Resistance Levels with automatic pivot detection
Live Dashboard showing real-time market analysis
Smart Alerts featuring six pre-configured alert types
Five Color Themes offering professional visual options
TECHNICAL DETAILS
CALCULATION METHODS:
Average True Range (ATR) for volatility adaptation
Exponential Moving Average (EMA) and Simple Moving Average (SMA) for trend smoothing
Wave Trend channel oscillator for momentum analysis
Fractal-based divergence detection algorithm
Heikin Ashi transformation for bias calculation
Logarithmic momentum calculation for precision
PERFORMANCE CHARACTERISTICS:
Optimized for maximum speed and efficiency
No repainting signals ensuring reliability
Works on all timeframes from 1 minute to monthly
Compatible with all instruments including stocks, forex, crypto, and futures
RISK DISCLAIMER
This indicator is a technical analysis tool and should not be used as the sole basis for trading decisions. Always use proper risk management and never risk more than you can afford to lose. Combine with other analysis methods and practice on demo accounts first. Past performance does not guarantee future results. Trading carries substantial risk and is not suitable for all investors.
SUPPORT AND UPDATES
Regular updates and continuous improvements
Based on proven technical analysis principles
Developed following Pine Coders best practices and standards
Clean, well-documented, and optimized code structure
WHY CHOOSE ZS MASTER VISION PRO
All-in-one solution eliminating the need for multiple indicators
Highly customizable to adapt to your specific trading style
Professional grade analysis with institutional-quality standards
Clean interface that is not cluttered or confusing
Works everywhere across all markets and all timeframes
Smart signals filtered for quality over quantity
Beautiful design featuring five professional color themes
Active development with regular improvements and updates
Transform your trading with ZS Master Vision Pro today.
Version 2.0 | Created by Zakaria Safri | Pine Script Version 5

🚀 DocBrown V73++ EstrategiaStrategy Overview
The "DocBrown V73+ Unified Strategy" is a complex and multifaceted algorithmic trading system designed to operate in trending markets. Its core strategy is following the main trend, but its main strength lies in the numerous risk management modules and market filters it uses to protect capital and optimize trade exits.
The strategy combines classic trend indicators (EMAs, MACD, ADX) with volatility analysis (Bollinger Band Width) and volume to identify high-probability entry points. However, its most distinctive feature is its sophisticated exit system, which includes multiple Stop Loss (SL) and Take Profit (TP) types that adapt to various market conditions.
Entry Logic
To open a position (long or short), the strategy evaluates a set of conditions. The main entry is based on:
Market Regime Filter: This is a master filter that ensures trading is only carried out in favorable trend conditions. To do this, it simultaneously requires:
A minimum ADX to confirm the strength of the trend.
A minimum Bollinger Band Width (BBW) to ensure sufficient volatility.
A minimum slope in the slow EMA to confirm the market's direction.
EMA Alignment: Uses three Exponential Moving Averages (fast, medium, and slow). A long entry requires the fast EMA to be above the average, and the average above the slow EMA. For a short entry, the condition is the reverse.
Momentum Confirmation: The MACD must be crossed in the direction of the trade (the MACD line must be above the signal line for longs, and vice versa for shorts).
Volume Filter: The volume of the current candle must exceed a minimum ratio compared to its moving average to avoid signals of low market interest.
Trend Exhaustion Filter: Prevents new entries if the ADX, after reaching a very high peak, begins to decline, suggesting that the trend may be losing strength.
It also includes an alternative entry condition based on a "3-Candle Momentum," which looks for three consecutive candles in the same direction with progressively increasing volume, signaling a possible explosive move.
Risk Management and Exit Strategies
This is the most complex and robust part of the strategy, with multiple defense and profit-taking mechanisms:
Take Profit (TP)
Dynamic TP (Enabled by default): Instead of a fixed target, the strategy calculates the TP based on the nearest support and resistance levels. For a long position, it will look for the next resistance, and for a short position, the next support.
Trailing After a Breakout: If the price breaks an S&R level and the trade continues in favor, the strategy can move the SL to that broken level and recalculate a new TP target.
Stop Loss (SL) and Defensive Closes
The strategy features an arsenal of different types of Stop Losses for different situations:
Breakeven SL: Once the trade reaches a predefined profit percentage, the SL automatically moves to the entry price plus a small buffer to cover commissions. This ensures that a winning trade doesn't turn into a losing one.
Safety Bracket (Anti-Liquidation): This is an "emergency stop" that can be activated to prevent catastrophic losses. It is calculated based on the ATR or a fixed percentage of the price.
Adverse Volume Spike SL: Closes the position if a candle appears against the trade with abnormally high volume, which may indicate a violent reversal.
Consecutive Candle SL: If a certain number of candles (for example, 3.5) form in a row against the position, the strategy closes the trade to cut the loss.
Stagnant Stop: Closes the trade if it enters a loss and the price then remains sideways (without movement) for a defined number of bars, avoiding being trapped in a directionless position.
Derivative Stop (Anti-Trend and Counter-Trend): An advanced system that monitors price momentum and acceleration. If it detects that the price begins to move sharply against the trend after accumulating a certain amount of profit, it closes the position to protect profits.
Drawdown Stop (Loss): A special trailing stop that is only activated while the trade is in a loss. If the price attempts to recover but then falls again, this Stop is adjusted to minimize the loss from the peak of that small recovery.
Counter-Trend SL (BB-CT): Closes the position if, despite being in profit, the market shows clear signs of a trend reversal, such as the price returning within the Bollinger Bands and the MACD crossing against it.
Additional Features
Multi-Timeframe (MTF) Analysis: The strategy can run on a single chart (e.g., 1-minute) but makes all its decisions based on data from a longer timeframe (e.g., 5 or 15 minutes), allowing it to filter out market noise.
Frequency Control: Includes options to limit trades to one per candle and to set a cooldown period after closing a trade, preventing overtrading.
Date Filter: Allows backtesting over a specific timeframe.
Information Panel: Displays key data such as the strategy status, current TP/SL levels, unrealized profits (MFE), and the status of internal signals in real time on the chart.
Full Display: Draws S&R levels, EMAs, Bollinger Bands, and active entry, TP, and SL levels on the chart.
IMPORTANT:
Use in Isolated Leverage x5 (limit), start small and test tokens before jumping in.
DONATIONS: Token: USDT - Network: BSC Binance Smart Chain
Wallet: 0xe87b4589a53443d8ffed2e9b5a7ef58f261f087c

Index of Civilization DevelopmentIndex of Civilization Development Indicator
This Pine Script (version 6) creates a custom technical indicator for TradingView, titled Index of Civilization Development. It generates a composite index by averaging normalized stock market performances from a selection of global country indices. The normalization is relative to each index's 100-period simple moving average (SMA), scaled to a percentage (100% baseline). This allows for a comparable "development" or performance metric across diverse markets, potentially highlighting trends in global economic or "civilizational" progress based on equity markets.The indicator plots as a single line in a separate pane (non-overlay) and is designed to handle up to 40 symbols to respect TradingView's request.security() call limits.Key FeaturesComposite Index Calculation: Fetches the previous bar's close (close ) and its 100-period SMA for each selected symbol.
Normalizes each: (close / SMA(100)) * 100.
Averages the valid normalizations (ignores invalid/NA data) to produce a single "Index (%)" value.
Symbol Selection Modes:Top N Countries: Selects from a predefined list of the top 50 global stock indices (by market cap/importance, e.g., SPX for USA, SHCOMP for China). Options: Top 5, 15, 25, or 50.
Democratic Countries: ~38 symbols from democracies (e.g., SPX, NI225, NIFTY; based on democracy indices ≥6/10, including flawed/parliamentary systems).
Dictatorships: ~12 symbols from authoritarian/hybrid regimes (e.g., SHCOMP, TASI, IMOEX; scores <6/10).
Customization:Line color (default: blue).
Line width (1-5, default: 2).
Line style: Solid line (default), Stepline, or Circles.
Data Handling:Uses request.security() with lookahead enabled for real-time accuracy, gaps off, and invalid symbol ignoring.
Runs calculations on every bar, with max_bars_back=2000 for historical depth.
Arrays are populated only on the first bar (barstate.isfirst) for efficiency.
Predefined Symbol Lists (Examples)Top 50: SPX (USA), SHCOMP (China), NI225 (Japan), ..., BAX (Bahrain).
Democratic: Focuses on free-market democracies like USA, Japan, UK, Canada, EU nations, Australia, etc.
Dictatorships: Authoritarian markets like China, Saudi Arabia, Russia, Turkey, etc.
Usage TipsAdd to any chart (e.g., daily/weekly timeframe) to view the composite line.
Ideal for macro analysis: Compare democratic vs. authoritarian performance, or track "top world" equity health.
Potential Limitations: Relies on TradingView's symbol availability; some exotic indices (e.g., KWSEIDX) may fail if not supported. The 40-symbol cap prevents errors.
Interpretation: Values >100 indicate above-trend performance; <100 suggest underperformance relative to recent averages.
This script blends financial data with geopolitical categorization for a unique "civilization index" perspective on global markets. For modifications, ensure symbol tickers match TradingView's format.

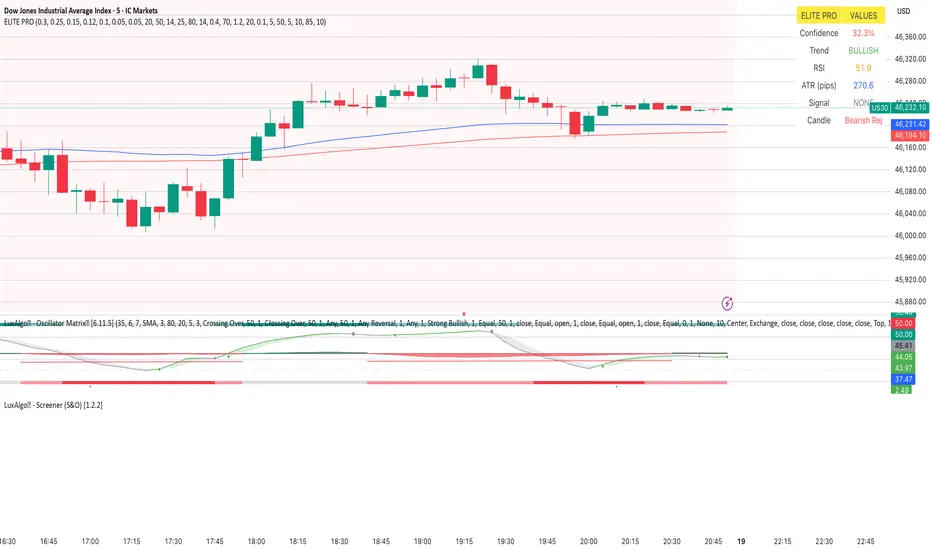
Elite_Pro_SignalsA sophisticated trading indicator that combines 8 powerful technical factors into a single confidence score to identify high-probability reversal signals.
8-Factor Confidence Scoring - Weighted analysis of multiple technical aspects
Smart Trend Alignment - Multi-timeframe EMA convergence
Advanced Pattern Recognition - Pin Bars, Engulfing, Inside Bars, Hammer/Shooting Star
Supply/Demand Zones - Automatic key level detection
Support/Resistance Confluence - Price action at significant levels
⚡ Smart Filters
Market Regime Detection - Avoid choppy/low-volatility conditions
Volume Confirmation - Ensure institutional participation
Liquidity Sweep Validation - Smart money movement detection
Candle Quality Filter - Eliminate false signals from tiny candles
🔧 How It Works
Confidence Scoring System (0-100%)
text
Wick Strength (30%) + Trend Alignment (25%) + Pattern Recognition (15%) +
Supply/Demand Zones (12%) + Support/Resistance (10%) + RSI Momentum (5%) +
Volume & Liquidity (5%)
Signal Generation
🟢 BUY Signals - Bullish rejection + Uptrend + High confidence
🔴 SELL Signals - Bearish rejection + Downtrend + High confidence
🎨 Visual Features
Clear Buy/Sell Arrows - Easy-to-spot signals
Confidence Background - Color-coded confidence levels
Info Table - Real-time metrics and analysis
Multi-Timeframe EMAs - Trend direction visualization
Professional Alerts - Real-time notifications
⚙️ Customization
Confidence Weights
Adjust the importance of each factor to match your trading style
Strategy Parameters
EMA periods (Fast: 20, Slow: 50)
RSI levels (Oversold: 25, Overbought: 80)
Minimum confidence threshold (70% recommended)
Advanced Filters
Volume multiplier settings
Liquidity sweep sensitivity
Market regime filters
Zone detection parameters
📈 Recommended Usage
Timeframes
Primary: 5-minute to 1-hour charts
Best Results: 15-minute with 1-hour trend alignment
Markets
Forex Pairs (EURUSD, GBPUSD, XAUUSD)
Indices (US30, NAS100, DE40)
Commodities (Gold, Oil)
Trading Sessions
London & New York overlap (Highest volatility)
Avoid Asian session (Low signal quality)
🔍 Signal Interpretation
High-Confidence Signals (80%+)
Strong trend alignment
Clear rejection patterns
Volume confirmation
Multiple confluence factors
Medium-Confidence Signals (60-80%)
Good setup but missing 1-2 factors
Requires additional confirmation
Low-Confidence Signals (<60%)
Avoid trading
Wait for better setups
Elite_Pro SignalsTrial version to get the signals. used various indicators including candle pattern. Works on 5 min candle but checks multi time frames to see if it is inline with 15 min and 1 hr. Best works on Gold and Indices.
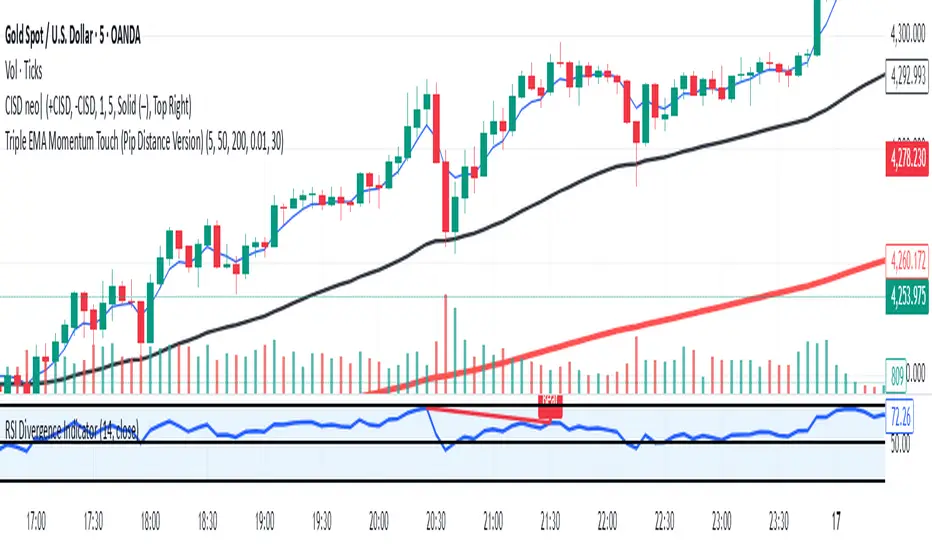
Triple EMA strategy by kingtraderthis strategy is purely based on moving everages, ema5, ema50 and ema200, avoid ranging market. in 1 mint your tp should 15-20pips, in 3mint tp should be 25pips, in 5mint tp should not above 50pips, in 15mints make tp 60 to 80 pips, in 30 mints tp 150 and 1h and h4 ur tp above 200pips, when target achieves have partial closing and keep ur trade breakeven. this indicator is for educational purpose only any loss by using this indicator, the author will not be responsible.
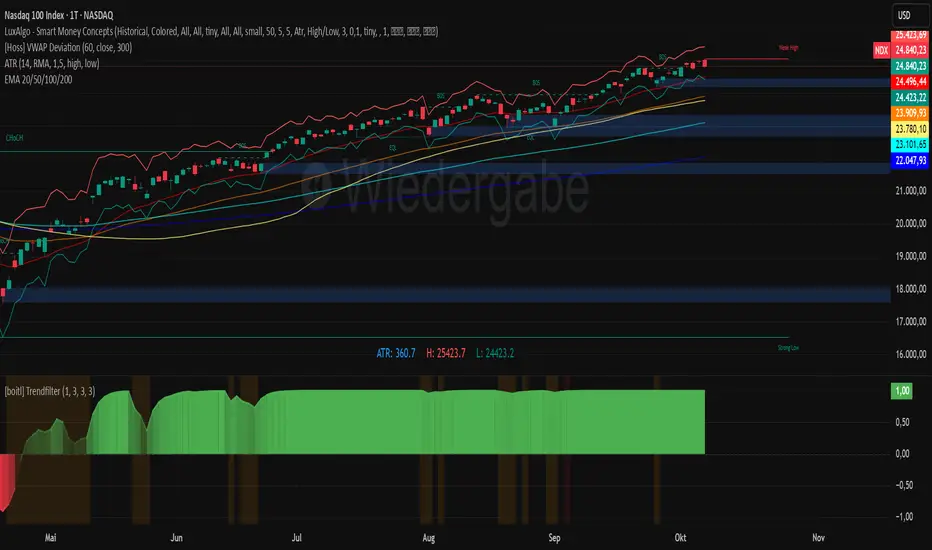
[boitl] Trendfilter🧭 Trend Filter – Curve View (1D / 1H + M15 Check)
A multi-timeframe trend filter that blends daily, hourly, and 15-minute data into a smooth, color-coded curve displayed in a separate panel.
It visualizes both trend direction and strength while accounting for overextension, providing a reliable “context indicator” for entries and filters.
🔍 Concept
The indicator evaluates three timeframes:
1D (Daily) → SMA200 for long-term trend bias
1H (Hourly) → EMA50 for medium-term confirmation
15M (Intraday) → EMA20 + ATR to detect overextension or mean reversion zones
It computes a continuous trend score between −1 and +1:
+1 → Strong bullish alignment (D1 & H1 both up)
−1 → Strong bearish alignment (D1 & H1 both down)
≈ 0 → Neutral, conflicting, or overextended conditions
The score is smoothed and normalized for a clean visual curve —
green for bullish, red for bearish, with dynamic transparency based on strength.
⚙️ Logic Overview
Timeframe Indicator Purpose
1D SMA200 Long-term trend direction
1H EMA50 Medium-term confirmation
15M EMA20 + ATR Overextension control
Alignment between D1 and H1 defines clear trend bias
Conflicts between them reduce the trend score
M15 overextension (price far from EMA20) softens the signal further
The result is a responsive trend-strength oscillator, ideal for multi-timeframe setups.
🧩 Use Cases
As a trend filter for strategies (e.g. allow entries only if score > 0.3 or < −0.3)
As a visual confirmation of higher-timeframe direction
To avoid trades during conflict or exhaustion
💡 Visualization
Single curve (area plot):
Green = bullish bias
Red = bearish bias
Transparency increases with weaker trend
Background colors:
🟠 Orange → D1/H1 conflict
🔴 Light red → M15 overextension active
Optional: binary alignment line (+1 / 0 / −1) for simplified display
⚙️ Parameters
Proximity to EMA20 (M15) = X×ATR → defines “near” condition
Overextension threshold = X×ATR → sets exhaustion boundary
EMA smoothing → reduces noise for a smoother score
Toggle overextension impact on/off
Tristan's Devil Mark (Short)"Devil's Mark" in trading refers to a specific candlestick pattern where a candle opens and moves significantly in one direction without creating a wick on that side. This creates an "inefficiency" in the market, and traders use this as a signal that price will likely return to that level to "rebalance" the imbalance and print the missing wick.
This strategy marks every green candle with no bottom wick using a purple downward wedge above the candle. This is highlighting a candle where buyers dominated from the open, but creating inefficiency below.
The purple wedge marks candles that opened at their lowest point and closed higher.
These candles indicate buyer dominance from the start of the period. In downtrends, a green candle with no bottom wick may indicate a potential short-term reversal.
Wait for the candle to close, and short it. Wait for the price to go below the bottom of the body of the marked candle.
Combine with Trend Analysis
Look for these candles in uptrends to confirm continuation momentum.
In downtrends, a green candle with no bottom wick may indicate a potential short-term reversal.
Support/Resistance Filters
Use horizontal support/resistance levels or moving averages to filter trades.
A green no-wick candle bouncing off support is a stronger bullish signal.
Timeframe Consideration
Works on any timeframe; adjust your strategy accordingly.
For intraday scalping, use 1–15 minute charts; for swing trades, use daily or 4-hour charts.
Backtesting and Pattern Recognition
Since the indicator works on historical bars, review past setups to identify patterns where this candle type reliably predicts price movement.

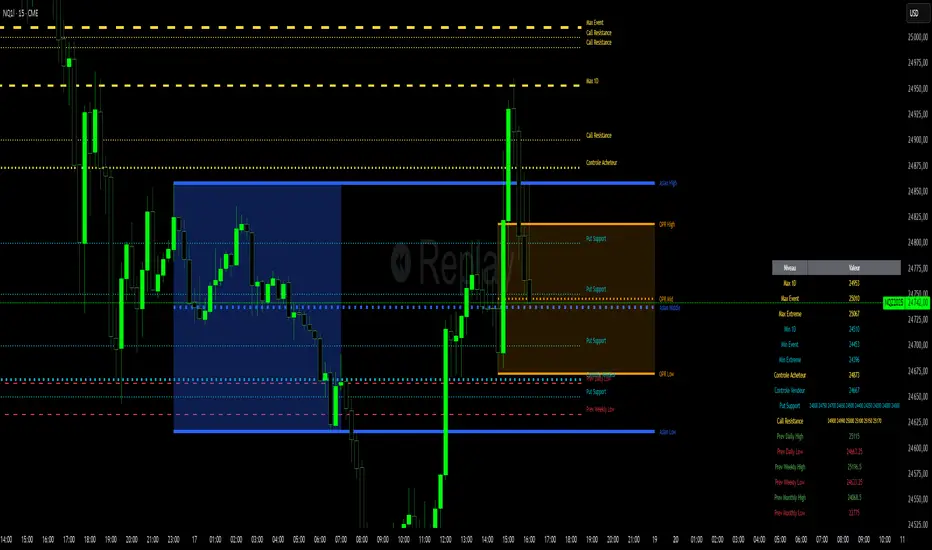
Niv Deal + Previ D W M + OPR + Asian🧭 Indicator Description (English)
Name: Niveaux Dealers + Previous D/W/M Auto + OPR + Asian Session
Platform: TradingView (Pine Script v6)
Type: Multi-module visual indicator for market structure and session ranges
🧩 Overview
This indicator combines three complementary modules to help traders visualize key market levels, opening ranges, and session dynamics — all in one comprehensive tool.
It is designed primarily for index and futures trading (e.g. NQ, ES, DAX), but can be applied to any market or timeframe.
MODULE 1 — Dealers Levels + Previous High/Low (Auto)
This first module automatically extracts and plots custom Dealer Levels and Previous Period Levels.
It can parse manually entered price levels (from a single text input) such as daily max/min, control levels, put supports, and call resistances — then draw horizontal lines and labels on the chart.
Features:
One text input for all dealer levels (easy copy-paste format).
Automatic parsing of prices from text (ignores irrelevant characters).
Groups of levels:
Maxima (Max 1D / Event / Extreme)
Minima (Min 1D / Event / Extreme)
Buyer/Seller Controls
Put Supports and Call Resistances
Independent color, style, and width for each line.
Transparent rectangular labels positioned perfectly on the levels.
Previous Daily, Weekly, and Monthly High/Low levels added automatically.
Optional summary table showing all levels and values in real time.
MODULE 2 — OPR (Opening Price Range)
The second module highlights the Opening Price Range, defined by the first 15 minutes (or any chosen period) of the trading session.
Features:
Fully configurable start and end time (local chart timezone).
Displays:
High, Low, and Midline (median)
Optional rectangle between high/low
Optional labels on each line
Independent color, line style, and thickness.
Works perfectly with non-standard sessions (e.g. 13:30–22:00 UTC for U.S. futures).
Uses local chart time instead of exchange time for intuitive control.
MODULE 3 — Asian Session Range
The third module draws the Asian trading session range, automatically detecting price action between configurable hours (default 17:00 → 01:00).
Features:
Adjustable start and end time (supports overnight sessions).
Plots Asian High, Asian Low, and Asian Middle (mid-range line).
Highlights the Asian box area with semi-transparent color.
Optional labels at the end of each level.
Fully synchronized with the chart’s local timezone (same logic as OPR).
Simple toggle to enable or disable the entire Asian module.
⚙️ Customization & Display
Each module can be toggled independently.
Colors, line styles (solid, dashed, dotted), and thickness are customizable.
Label visibility and extensions (left/right) can be adjusted.
The indicator is lightweight and optimized for real-time performance.
💡 Use Case
Traders can use this multi-module setup to:
Identify dealer reaction zones and institutional levels.
Track previous highs/lows for potential liquidity sweeps.
Monitor session ranges (Opening and Asian) for volatility shifts.
Combine all three perspectives (Dealer, Session, Historical) into one unified view.
Would you like me to rewrite this description in TradingView publication form
Smart Structure Pro - Market Structure & Smart Money Concepts═══════════════════════════════════════════════════════════════════════════════
SMART STRUCTURE PRO
═══════════════════════════════════════════════════════════════════════════════
A comprehensive market structure analysis tool that identifies institutional trading
patterns and smart money concepts for improved trade timing and decision-making.
═══════════════════════════════════════════════════════════════════════════════
📊 WHAT IT DOES
═══════════════════════════════════════════════════════════════════════════════
This indicator automatically detects and visualizes key market structure elements:
🔹 BOS (Break of Structure)
- Identifies trend continuation patterns
- Marks when price breaks above previous highs (bullish) or below previous lows (bearish)
- Confirms trend strength and momentum
🔹 CHoCH (Change of Character)
- Detects potential trend reversals
- Alerts when market structure shifts from bullish to bearish or vice versa
- Helps identify early reversal opportunities
🔹 Order Blocks
- Highlights institutional entry zones
- Identifies the last opposite candle before a structure break
- Shows areas where smart money likely entered positions
🔹 Fair Value Gaps (FVG)
- Detects price imbalances and inefficiencies
- Shows areas where price moved rapidly leaving gaps
- Often act as support/resistance when retested
🔹 Liquidity Zones
- Marks swing high and low levels
- Identifies areas where stop losses likely cluster
- Shows potential stop hunt and liquidity grab zones
═══════════════════════════════════════════════════════════════════════════════
🎯 HOW TO USE
═══════════════════════════════════════════════════════════════════════════════
BULLISH SETUP:
1. Wait for Bullish CHoCH (trend reversal signal) or BOS ↑ (continuation)
2. Look for price to pull back into an Order Block or Fair Value Gap
3. Enter long when price bounces from these zones
4. Place stop loss below the Order Block
5. Target the next liquidity zone or resistance level
BEARISH SETUP:
1. Wait for Bearish CHoCH (trend reversal signal) or BOS ↓ (continuation)
2. Look for price to retrace into an Order Block or Fair Value Gap
3. Enter short when price rejects from these zones
4. Place stop loss above the Order Block
5. Target the next liquidity zone or support level
DASHBOARD INTERPRETATION:
• Trend: Current market direction (Bullish/Bearish)
• Volume: Confirmation strength (High volume = stronger signals)
• Signal: Latest structure break detected
• Key High/Low: Critical levels for the current trend
• Position: Price location (Premium = expensive, Discount = cheap)
═══════════════════════════════════════════════════════════════════════════════
⚙️ SETTINGS GUIDE
═══════════════════════════════════════════════════════════════════════════════
STRUCTURE DETECTION:
• Pivot Length (Default: 10)
- Lower values = More signals but potentially weaker
- Higher values = Fewer signals but stronger/more reliable
- Recommended: 8-12 for intraday, 10-15 for higher timeframes
• Structure Line Extension
- Visual preference for how far lines extend
- Does not affect signal detection
SMART MONEY CONCEPTS:
• Order Block Extension: How long OB boxes remain visible
• FVG Extension: How long gap boxes remain visible
• Min FVG Size: Filter out small gaps (0 = show all)
- Set to 10-20% to reduce noise
- Set to 0 to see all gaps
VOLUME FILTER:
• Volume Confirmation (Recommended: ON)
- Filters weak signals without volume support
- Reduces false breakouts
• Volume Multiplier (Default: 1.5)
- Higher = Stricter filtering (fewer but stronger signals)
- Lower = More signals (but may include weak ones)
DISPLAY:
• Dashboard: Toggle information panel
• Trend Background: Subtle color tint showing current trend
• Dashboard Position: Choose corner placement
═══════════════════════════════════════════════════════════════════════════════
🔔 ALERTS
═══════════════════════════════════════════════════════════════════════════════
Available alert conditions:
✓ Bullish BOS - Uptrend continuation confirmed
✓ Bearish BOS - Downtrend continuation confirmed
✓ Bullish CHoCH - Reversal to uptrend detected
✓ Bearish CHoCH - Reversal to downtrend detected
✓ Structure Break - Any significant market structure change
To set up alerts:
1. Click the "⏰" alert icon
2. Select "Smart Structure Pro"
3. Choose your desired condition
4. Configure notification method
5. Click "Create"
═══════════════════════════════════════════════════════════════════════════════
⚠️ IMPORTANT DISCLOSURES
═══════════════════════════════════════════════════════════════════════════════
REPAINTING BEHAVIOR:
• Pivot points WILL repaint until confirmed (this is by design and unavoidable)
• Structure breaks (BOS/CHoCH) use CLOSED candles and do NOT repaint after confirmation
• Order Blocks and FVGs are drawn on confirmed signals and do NOT repaint
• All signals wait for candle close before triggering
BEST PRACTICES:
• Use on higher timeframes (15min+) for more reliable signals
• Combine with other analysis (support/resistance, volume profile, etc.)
• Wait for candle close confirmation before acting on signals
• Use proper risk management - this is not a standalone trading system
• Backtest on your preferred instrument and timeframe
PERFORMANCE:
• Limited to 100 boxes, 100 lines, 100 labels for optimal performance
• Older objects automatically removed as new ones appear
• Works on all markets (Forex, Crypto, Stocks, Indices, Commodities)
═══════════════════════════════════════════════════════════════════════════════
📚 CONCEPTS EXPLAINED
═══════════════════════════════════════════════════════════════════════════════
MARKET STRUCTURE:
Market structure refers to the pattern of price movements creating swing highs
and lows. Understanding structure helps identify trend direction and potential
reversal points.
SMART MONEY CONCEPTS:
These are trading techniques based on tracking institutional order flow and
understanding where large players (banks, funds, institutions) enter and exit
positions.
ORDER BLOCKS:
The last opposing candle before a strong directional move. Institutions often
leave unfilled orders in these zones, which can act as support/resistance when
price returns.
FAIR VALUE GAPS:
Areas where price moved so quickly that it left an imbalance. These gaps often
get "filled" as price returns to find equilibrium, creating trading opportunities.
═══════════════════════════════════════════════════════════════════════════════
🎓 EDUCATIONAL VALUE
═══════════════════════════════════════════════════════════════════════════════
This indicator helps traders:
✓ Understand market structure mechanics
✓ Identify institutional trading patterns
✓ Improve trade timing and entry precision
✓ Recognize trend continuation vs reversal
✓ Learn smart money concepts through visualization
═══════════════════════════════════════════════════════════════════════════════
📋 TECHNICAL DETAILS
═══════════════════════════════════════════════════════════════════════════════
• Version: 1.0.0
• Pine Script Version: 5
• Indicator Type: Overlay
• No Repainting: Structure breaks use confirmed candles
• Performance Optimized: Limited drawing objects
• Works On: All markets and timeframes
• Alerts: Yes, fully customizable
═══════════════════════════════════════════════════════════════════════════════
👤 AUTHOR
═══════════════════════════════════════════════════════════════════════════════
Created by: Zakaria Safri
Original Work: All code and concepts are original implementations
Based On: ICT (Inner Circle Trader) educational concepts
License: © 2024 Zakaria Safri - Personal Use Only
═══════════════════════════════════════════════════════════════════════════════
⚖️ DISCLAIMER
═══════════════════════════════════════════════════════════════════════════════
This indicator is for educational and informational purposes only. It does not
constitute financial advice. Trading involves substantial risk of loss. Past
performance does not guarantee future results. Always conduct your own research
and consult with a licensed financial advisor before making trading decisions.
The author is not responsible for any losses incurred from using this indicator.
═══════════════════════════════════════════════════════════════════════════════
If you find this indicator helpful, please:
👍 Like and favorite
⭐ Leave a review
📢 Share with other traders
💬 Comment with feedback or suggestions
Happy Trading! 📈

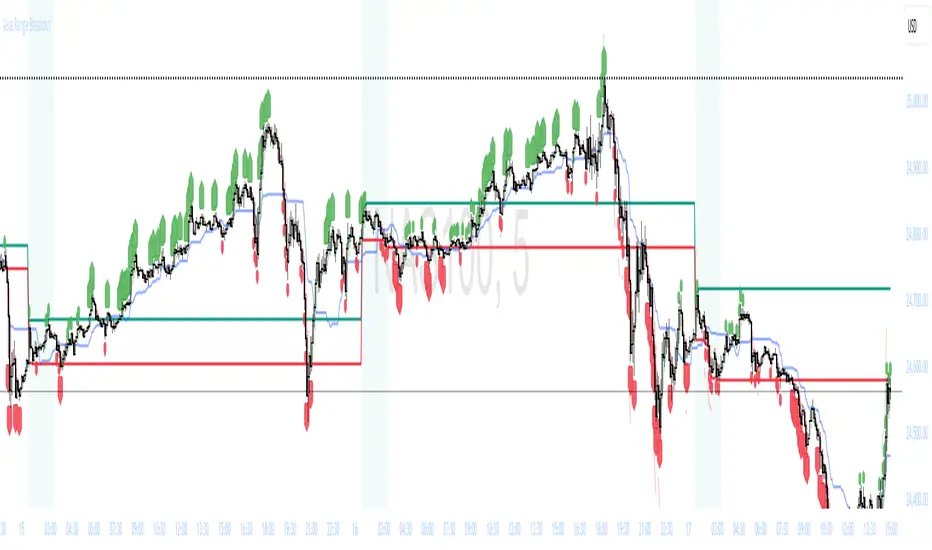
Asia Range Breakout Asia Range Breakout
Description:
Asia Range Breakout is a sophisticated, multi-filter trading tool designed to identify high-probability breakout opportunities during the core Asian trading session. By combining session-based range analysis with advanced confirmation filters like Heiken Ashi momentum, Ichimoku baseline trends, and EMA alignment, this indicator helps traders capture decisive moves while filtering out market noise.
Tired of false breakouts? This system provides a structured framework to trade the Sydney and Tokyo sessions with precision and confidence.
Key Features:
Multi-Session Range Tracking:
Monitors 6 distinct pre-defined Asian sessions (Sydney Box, Tokyo Pre-Open, Tokyo Launch, etc.).
Dynamically plots High and Low boundaries for each session (Teal for Highs, Red for Lows).
Individually toggleable sessions to focus on your preferred trading window.
Smart Alert & Signal System:
Generates alerts based on Heiken Ashi candle closings relative to session ranges.
Dual-Size Signals: Differentiates between "Large" breakouts (outside the range) and "Small" signals (within the range).
Configurable alert timeframe for confirmation candle closure.Built-in Sound Alerts for real-time notifications.
Advanced Confirmation Filters:
Heiken Ashi Momentum Filter: Ensures breakout candles have significant momentum, adjustable via a threshold multiplier.
EMA 200 Filter: Confirms the breakout's alignment with the broader trend.
Ichimoku Baseline (Kijun-sen) Filter: Uses a dynamic support/resistance level for additional confirmation.
Ichimoku Baseline Divergence Filter: A unique feature that requires the baseline's slope to match the breakout direction (Bullish for buys, Bearish for sells).
ATR Volatility Filter: (Optional) Ensures the breakout candle has sufficient range relative to recent market volatility.
Visual Enhancements:
Take-Profit Lines: Projects profit targets using ATR and connects consecutive alerts with a trendline.
Heiken Ashi Overlay: Displays smoothed Heiken Ashi candles directly on the main chart for cleaner trend visualization.
Divergence Trend Line: Visually plots the slope of the Ichimoku Baseline for quick trend assessment.
Session Background Highlighter: Shades the active sessions for easy time reference.
Comprehensive Debug Info Box: Provides real-time feedback on filter status, perfect for strategy validation and learning.
Usage Instructions & Tips:
1. Initial Setup:
Start simple! Apply the indicator to a 5-minute or 1-minute chart.
Recommended Instruments:
Forex: Major pairs like AUD/USD , USD/JPY or EUR/JPY.
Indices: `NAS100` (Nasdaq), `US30` (Dow Jones), `JP225` (Nikkei 225).
Commodities: `XAUUSD` (Gold).
Initially, enable only the Sydney Box (00:30 - 03:15 UTC) as it is the most robust session, then explore others.
2. Interpreting the Signals:
Large Green Arrow (Above Bar): A strong BUY signal. The Heiken Ashi candle closed above the session's High, and all enabled filters are confirmed.
Small Green Arrow (Above Bar): A moderate BUY signal. The candle closed bullishly but within the session range.
Large Red Arrow (Below Bar): A strong SELL signal. The Heiken Ashi candle closed below the session's Low, with filter confirmation.
Small Red Arrow (Below Bar): A moderate SELL signal. The candle closed bearishly but within the session range.
3. Optimizing Your Strategy:
Filter Tuning: The default filters are balanced. Adjust them based on your risk appetite:
Increase the Heiken Ashi Threshold (e.g., to 0.2) for fewer, but stronger signals.
Disable filters like ATR or Divergence if you find them too restrictive.
The Power of Divergence: The Ichimoku Divergence filter is a powerful trend-confirmation tool. Pay close attention to it for the highest-quality signals.
Use the Debug Box: Enable the "Show Debug Info Box" to see exactly why a signal did or did not trigger. This is invaluable for understanding the indicator's logic and avoiding bad trades.
4. Risk Management:
The TP Lines provide a logical profit target based on market volatility. Consider using them for setting take-profit orders.
Always use a stop-loss. A logical level is the opposite side of the session range (e.g., for a buy signal, place a stop below the session low).
You're very welcome! I'm glad I could help you create a professional tool. Wishing you great success with your Trading! 🚀🚀🚀🚀🚀🚀🚀🚀🚀🚀🚀🚀🚀🚀🚀🚀🚀🚀
Tweezer & Kangaroo Zones [WavesUnchained]Tweezer & Kangaroo Zones
Pattern Recognition with Supply/Demand Zones
Indicator that detects tweezer and kangaroo tail (pin bar) reversal patterns and creates supply and demand zones. Includes volume validation, trend context, and confluence scoring.
What You See on Your Chart
Pattern Labels:
"T" (Red) - Tweezer Top detected above price → Bearish reversal signal
"T" (Green) - Tweezer Bottom detected below price → Bullish reversal signal
"K" (Red) - Kangaroo Bear (Pin Bar rejection from top) → Bearish signal
"K" (Green) - Kangaroo Bull (Pin Bar rejection from bottom) → Bullish signal
Label Colors Indicate Pattern Strength:
Dark Green/Red - Strong pattern (score ≥8.0)
Medium Green/Red - Good pattern (score ≥6.0)
Light Green/Red - Valid pattern (score <6.0)
Zone Boxes:
Red Boxes - Supply Zones (resistance, potential short areas)
Green Boxes - Demand Zones (support, potential long areas)
White Border - Active zone (fresh, not tested yet)
Gray Border - Inactive zone (expired or invalidated)
Pattern Detection
Tweezer Patterns (Classic Double-Top/Bottom):
Flexible Lookback - Detects patterns up to 3 bars apart (not just consecutive)
Precision Matching - 0.2% level tolerance for high-quality signals
Wick Similarity Check - Both candles must show similar rejection wicks
Volume Validation - Second candle requires elevated volume (0.8x average)
Pattern Strength Score - 0-1 quality rating based on level match + wick similarity
Optional Trend Context - Can require trend alignment (default: OFF for more signals)
Kangaroo Tail / Pin Bar Patterns:
No Pivot Delay - Instant detection without waiting for pivot confirmation
Body Position Check - Body must be at candle extremes (30% tolerance)
Volume Spike - Rejection must occur with volume (0.9x average)
Rejection Strength - Scores based on wick length (0.5-0.9 of range)
Optional Trend Context - Bearish in uptrends, Bullish in downtrends (default: OFF)
Zone Management
Auto-Created Zones - Every valid pattern creates a supply/demand zone
Overlap Prevention - Zones too close together (50% overlap) are not duplicated
Lifetime Control - Zones expire after 400 bars (configurable)
Smart Invalidation - Zones invalidate when price closes through them
Styling Options - Choose between Solid, Dashed, or Dotted borders
Border Width - 2px width for better visibility
Confluence Scoring System
Multi-factor confluence scoring (0-10 scale) with configurable weights:
Regime (EMA+HTF) - Trend alignment across timeframes (Weight: 2.0)
HTF Stack - Multi-timeframe trend confluence (Weight: 3.0)
Structure - Higher lows / Lower highs confirmation (Weight: 1.0)
Relative Volume - Volume surge validation (Weight: 1.0)
Chop Advantage - Favorable market conditions (Weight: 1.0)
Zone Thinness - Tight zones = better R/R (Weight: 1.0)
Supertrend - Trend indicator alignment (Weight: 1.0)
MOST - Moving Stop alignment (Weight: 1.0)
Pattern Strength - Quality of detected pattern (Weight: 1.5)
Zone Retest Signals
Signals generated when zones are retested:
BUY Signal - Price retests demand zone from above (score ≥4.5)
SELL Signal - Price retests supply zone from below (score ≥5.5)
Normalized Score - Displayed as 0-10 for easy interpretation
Optional Trend Gate - Require trend alignment for signals (default: OFF)
Alert Ready - Built-in alertconditions for automation
Additional Features
Auto-Threshold Tuning - Adapts to ATR and Choppiness automatically
Session Profiles - Different settings for RTH vs ETH sessions
Organized Settings - 15+ input groups for easy configuration
Optional Panels - HTF Stack overview and performance metrics (default: OFF)
Data Exports - Hidden plots for strategy/library integration
RTA Health Monitoring - Built-in performance tracking
Setup & Configuration
Quick Start:
1. Apply indicator to any timeframe
2. Patterns and zones appear automatically
3. Adjust pattern detection sensitivity if needed
4. Configure zone styling (Solid/Dashed/Dotted)
5. Set up alerts for zone retests
Key Settings to Adjust:
Pattern Detection:
• Min RelVolume: Lower = more signals (0.8 Tweezer, 0.9 Kangaroo)
• Require trend context: Enable for stricter, higher-quality patterns
• Check wick similarity: Ensures proper rejection structure
Zone Management:
• Zone lifetime: How long zones remain active (default: 400 bars)
• Invalidate on close-through: Remove zones when price breaks through
• Max overlap: Prevent duplicate zones (default: 50%)
Scoring:
• Min Score BUY/SELL: Higher = fewer but better signals (default: 4.5/5.5)
• Component weights: Customize what factors matter most
• Signals require trend gate: OFF = more signals, ON = higher quality
Visual Customization
Zone Colors - Light red/green with 85% transparency (non-intrusive)
Border Styles - Solid, Dashed, or Dotted
Label Intensity - Darker greens for better readability
Clean Charts - All panels OFF by default
Understanding the Zones
Supply Zones (Red):
Created from bearish patterns (Tweezer Tops, Kangaroo Bears). Price made a high attempt to push higher, but was rejected. These become resistance areas where sellers may step in again.
Demand Zones (Green):
Created from bullish patterns (Tweezer Bottoms, Kangaroo Bulls). Price made a low with strong rejection. These become support areas where buyers may step in again.
Zone Quality Indicators:
• White border = Fresh zone, not tested yet
• Gray border = Zone expired or invalidated
• Thin zones (tight range) = Better risk/reward ratio
• Thick zones = Less precise, wider stop required
Trading Applications
Reversal Trading - Enter at pattern detection with tight stops
Zone Retest Trading - Wait for retests of established zones
Trend Confluence - Trade only when patterns align with trend
Risk Management - Use zone boundaries for stop placement
Target Setting - Opposite zones become profit targets
Pro Tips
Best signals occur when pattern + zone retest + trend all align
Lower timeframes = more signals but more noise
Higher timeframes = fewer but more reliable signals
Start with default settings, adjust based on your market
Combine with other analysis (structure, key levels, etc.)
Use alerts to avoid staring at charts all day
Important Notes
Not all patterns will lead to successful trades
Use proper risk management and position sizing
Patterns work best in trending or range-bound markets
Very choppy conditions may produce lower-quality signals
Always confirm with your own analysis before trading
Technical Specifications
• Pine Script v6
• RTA-Core integration
• RTA Core Library integration
• Maximum 200 boxes, 500 labels
• Auto-tuning based on ATR and Choppiness
• Session-aware threshold adjustments
• Memory-optimized zone management
What's Included
Tweezer Top/Bottom detection
Kangaroo Tail / Pin Bar detection
Automatic supply/demand zone creation
Volume validation system
Pattern strength scoring
Zone retest signals
Multi-factor confluence scoring
Optional HTF Stack panel
Optional performance metrics
Session profile support
Auto-threshold tuning
Alert conditions
Data exports for strategies
Author Waves Unchained
Version 1.0
Status Public Indicator
Summary
Reversal pattern detection with zone management, volume validation, and confluence scoring for tweezer and kangaroo tail patterns.
---
Disclaimer: This indicator is for educational and informational purposes only. Trading involves risk. Past performance does not guarantee future results. Always practice proper risk management.

Advanced Speedometer Gauge [PhenLabs]Advanced Speedometer Gauge
Version: PineScript™v6
📌 Description
The Advanced Speedometer Gauge is a revolutionary multi-metric visualization tool that consolidates 13 distinct trading indicators into a single, intuitive speedometer display. Instead of cluttering your workspace with multiple oscillators and panels, this gauge provides a unified interface where you can switch between different metrics while maintaining consistent visual interpretation.
Built on PineScript™ v6, the indicator transforms complex technical calculations into an easy-to-read semi-circular gauge with color-coded zones and a precision needle indicator. Each of the 13 available metrics has been carefully normalized to a 0-100 scale, ensuring that whether you’re analyzing RSI, volume trends, or volatility extremes, the visual interpretation remains consistent and intuitive.
The gauge is designed for traders who value efficiency and clarity. By consolidating multiple analytical perspectives into one compact display, you can quickly assess market conditions without the visual noise of traditional multi-indicator setups. All metrics are non-overlapping, meaning each provides unique insights into different aspects of market behavior.
🚀 Points of Innovation
13 selectable metrics covering momentum, volume, volatility, trend, and statistical analysis, all accessible through a single dropdown menu
Universal 0-100 normalization system that standardizes different indicator scales for consistent visual interpretation across all metrics
Semi-circular gauge design with 21 arc segments providing smooth precision and clear visual feedback through color-coded zones
Non-redundant metric selection ensuring each indicator provides unique market insights without analytical overlap
Advanced metrics including MFI (volume-weighted momentum), CCI (statistical deviation), Volatility Rank (extended lookback), Trend Strength (ADX-style), Choppiness Index, Volume Trend, and Price Distance from MA
Flexible positioning system with 5 chart locations, 3 size options, and fully customizable color schemes for optimal workspace integration
🔧 Core Components
Metric Selection Engine: Dropdown interface allowing instant switching between 13 different technical indicators, each with independent parameter controls
Normalization System: All metrics converted to 0-100 scale using indicator-specific algorithms that preserve the statistical significance of each measurement
Semi-Circular Gauge: Visual display using 21 arc segments arranged in curved formation with two-row thickness for enhanced visibility
Color Zone System: Three distinct zones (0-40 green, 40-70 yellow, 70-100 red) providing instant visual feedback on metric extremes
Needle Indicator: Dynamic pointer that positions across the gauge arc based on precise current metric value
Table Implementation: Professional table structure ensuring consistent positioning and rendering across different chart configurations
🔥 Key Features
RSI (Relative Strength Index): Classic momentum oscillator measuring overbought/oversold conditions with adjustable period length (default 14)
Stochastic Oscillator: Compares closing price to price range over specified period with smoothing, ideal for identifying momentum shifts
MFI (Money Flow Index): Volume-weighted RSI that combines price movement with volume to measure buying and selling pressure intensity
CCI (Commodity Channel Index): Measures statistical deviation from average price, normalized from typical -200 to +200 range to 0-100 scale
Williams %R: Alternative overbought/oversold indicator using high-low range analysis, inverted to match 0-100 scale conventions
Volume %: Current volume relative to moving average expressed as percentage, capped at 100 for extreme spikes
Volume Trend: Cumulative directional volume flow showing whether volume is flowing into up moves or down moves over specified period
ATR Percentile: Current Average True Range position within historical range using specified lookback period (default 100 bars)
Volatility Rank: Close-to-close volatility measured against extended historical range (default 252 days), differs from ATR in calculation method
Momentum: Rate of change calculation showing price movement speed, centered at 50 and normalized to 0-100 range
Trend Strength: ADX-style calculation using directional movement to quantify trend intensity regardless of direction
Choppiness Index: Measures market choppiness versus trending behavior, where high values indicate ranging markets and low values indicate strong trends
Price Distance from MA: Measures current price over-extension from moving average using standard deviation calculations
🎨 Visualization
Semi-Circular Arc Display: Curved gauge spanning from 0 (left) to 100 (right) with smooth progression and two-row thickness for visibility
Color-Coded Zones: Green zone (0-40) for low/oversold conditions, yellow zone (40-70) for neutral readings, red zone (70-100) for high/overbought conditions
Needle Indicator: Downward-pointing triangle (▼) positioned precisely at current metric value along the gauge arc
Scale Markers: Vertical line markers at 0, 25, 50, 75, and 100 positions with corresponding numerical labels below
Title Display: Merged cell showing “𓄀 PhenLabs” branding plus currently selected metric name in monospace font
Large Value Display: Current metric value shown with two decimal precision in large text directly below title
Table Structure: Professional table with customizable background color, text color, and transparency for minimal chart obstruction
📖 Usage Guidelines
Metric Selection
Select Metric: Default: RSI | Options: RSI, Stochastic, Volume %, ATR Percentile, Momentum, MFI (Money Flow), CCI (Commodity Channel), Williams %R, Volatility Rank, Trend Strength, Choppiness Index, Volume Trend, Price Distance | Choose the technical indicator you want to display on the gauge based on your current analytical needs
RSI Settings
RSI Length: Default: 14 | Range: 1+ | Controls the lookback period for RSI calculation, shorter periods increase sensitivity to recent price changes
Stochastic Settings
Stochastic Length: Default: 14 | Range: 1+ | Lookback period for stochastic calculation comparing close to high-low range
Stochastic Smooth: Default: 3 | Range: 1+ | Smoothing period applied to raw stochastic value to reduce noise and false signals
Volume Settings
Volume MA Length: Default: 20 | Range: 1+ | Moving average period used to calculate average volume for comparison with current volume
Volume Trend Length: Default: 20 | Range: 5+ | Period for calculating cumulative directional volume flow trend
ATR and Volatility Settings
ATR Length: Default: 14 | Range: 1+ | Period for Average True Range calculation used in ATR Percentile metric
ATR Percentile Lookback: Default: 100 | Range: 20+ | Historical range used to determine current ATR position as percentile
Volatility Rank Lookback (Days): Default: 252 | Range: 50+ | Extended lookback period for Volatility Rank metric using close-to-close volatility
Momentum and Trend Settings
Momentum Length: Default: 10 | Range: 1+ | Lookback period for rate of change calculation in Momentum metric
Trend Strength Length: Default: 20 | Range: 5+ | Period for directional movement calculations in ADX-style Trend Strength metric
Advanced Metric Settings
MFI Length: Default: 14 | Range: 1+ | Lookback period for Money Flow Index calculation combining price and volume
CCI Length: Default: 20 | Range: 1+ | Period for Commodity Channel Index statistical deviation calculation
Williams %R Length: Default: 14 | Range: 1+ | Lookback period for Williams %R high-low range analysis
Choppiness Index Length: Default: 14 | Range: 5+ | Period for calculating market choppiness versus trending behavior
Price Distance MA Length: Default: 50 | Range: 10+ | Moving average period used for Price Distance standard deviation calculation
Visual Customization
Position: Default: Top Right | Options: Top Left, Top Right, Bottom Left, Bottom Right, Middle Right | Controls gauge placement on chart for optimal workspace organization
Size: Default: Normal | Options: Small, Normal, Large | Adjusts overall gauge dimensions and text size for different monitor resolutions and preferences
Low Zone Color (0-40): Default: Green (#00FF00) | Customize color for low/oversold zone of gauge arc
Medium Zone Color (40-70): Default: Yellow (#FFFF00) | Customize color for neutral/medium zone of gauge arc
High Zone Color (70-100): Default: Red (#FF0000) | Customize color for high/overbought zone of gauge arc
Background Color: Default: Semi-transparent dark gray | Customize gauge background for contrast and chart integration
Text Color: Default: White (#FFFFFF) | Customize all text elements including title, value, and scale labels
✅ Best Use Cases
Quick visual assessment of market conditions when you need instant feedback on whether an asset is in extreme territory across multiple analytical dimensions
Workspace organization for traders who monitor multiple indicators but want to reduce chart clutter and visual complexity
Metric comparison by switching between different indicators while maintaining consistent visual interpretation through the 0-100 normalization
Overbought/oversold identification using RSI, Stochastic, Williams %R, or MFI depending on whether you prefer price-only or volume-weighted analysis
Volume analysis through Volume %, Volume Trend, or MFI to confirm price movements with corresponding volume characteristics
Volatility monitoring using ATR Percentile or Volatility Rank to identify expansion/contraction cycles and adjust position sizing
Trend vs range identification by comparing Trend Strength (high values = trending) against Choppiness Index (high values = ranging)
Statistical over-extension detection using CCI or Price Distance to identify when price has deviated significantly from normal behavior
Multi-timeframe analysis by duplicating the gauge on different timeframe charts to compare metric readings across time horizons
Educational purposes for new traders learning to interpret technical indicators through consistent visual representation
⚠️ Limitations
The gauge displays only one metric at a time, requiring manual switching to compare different indicators rather than simultaneous multi-metric viewing
The 0-100 normalization, while providing consistency, may obscure the raw values and specific nuances of each underlying indicator
Table-based visualization cannot be exported or saved as an image separately from the full chart screenshot
Optimal parameter settings vary by asset type, timeframe, and market conditions, requiring user experimentation for best results
💡 What Makes This Unique
Unified Multi-Metric Interface: The only gauge-style indicator offering 13 distinct metrics through a single interface, eliminating the need for multiple oscillator panels
Non-Overlapping Analytics: Each metric provides genuinely unique insights—MFI combines volume with price, CCI measures statistical deviation, Volatility Rank uses extended lookback, Trend Strength quantifies directional movement, and Choppiness Index measures ranging behavior
Universal Normalization System: All metrics standardized to 0-100 scale using indicator-appropriate algorithms that preserve statistical meaning while enabling consistent visual interpretation
Professional Visual Design: Semi-circular gauge with 21 arc segments, precision needle positioning, color-coded zones, and clean table implementation that maintains clarity across all chart configurations
Extensive Customization: Independent parameter controls for each metric, five position options, three size presets, and full color customization for seamless workspace integration
🔬 How It Works
1. Metric Calculation Phase:
All 13 metrics are calculated simultaneously on every bar using their respective algorithms with user-defined parameters
Each metric applies its own specific calculation method—RSI uses average gains vs losses, Stochastic compares close to high-low range, MFI incorporates typical price and volume, CCI measures deviation from statistical mean, ATR calculates true range, directional indicators measure up/down movement, and statistical metrics analyze price relationships
2. Normalization Process:
Each calculated metric is converted to a standardized 0-100 scale using indicator-appropriate transformations
Some metrics are naturally 0-100 (RSI, Stochastic, MFI, Williams %R), while others require scaling—CCI transforms from ±200 range, Momentum centers around 50, Volume ratio caps at 2x for 100, ATR and Volatility Rank calculate percentile positions, and Price Distance scales by standard deviations
3. Gauge Rendering:
The selected metric’s normalized value determines the needle position across 21 arc segments spanning 0-100
Each arc segment receives its color based on position—segments 0-8 are green zone, segments 9-14 are yellow zone, segments 15-20 are red zone
The needle indicator (▼) appears in row 5 at the column corresponding to the current metric value, providing precise visual feedback
4. Table Construction:
The gauge uses TradingView’s table system with merged cells for title and value display, ensuring consistent positioning regardless of chart configuration
Rows are allocated as follows: Row 0 merged for title, Row 1 merged for large value display, Row 2 for spacing, Rows 3-4 for the semi-circular arc with curved shaping, Row 5 for needle indicator, Row 6 for scale markers, Row 7 for numerical labels at 0/25/50/75/100
All visual elements update on every bar when barstate.islast is true, ensuring real-time accuracy without performance impact
💡 Note:
This indicator is designed for visual analysis and market condition assessment, not as a standalone trading system. For best results, combine gauge readings with price action analysis, support and resistance levels, and broader market context. Parameter optimization is recommended based on your specific trading timeframe and asset class. The gauge works on all timeframes but may require different parameter settings for intraday versus daily/weekly analysis. Consider using multiple instances of the gauge set to different metrics for comprehensive market analysis without switching between settings.

Triple SuperTrend + RSI + Fib BBTriple SuperTrend + RSI + Fibonacci Bollinger Bands Strategy
📊 Overview
This advanced trading strategy combines the power of three SuperTrend indicators with RSI confirmation and Fibonacci Bollinger Bands to generate high-probability trade signals. The strategy is designed to capture strong trending moves while filtering out false signals through multi-indicator confluence.
🔧 Core Components
Three SuperTrend Indicators
The strategy uses three SuperTrend indicators with progressively longer periods and multipliers:
SuperTrend 1: 10-period ATR, 1.0 multiplier (fastest, most sensitive)
SuperTrend 2: 11-period ATR, 2.0 multiplier (medium sensitivity)
SuperTrend 3: 12-period ATR, 3.0 multiplier (slowest, most stable)
This layered approach ensures that all three timeframe perspectives align before generating a signal, significantly reducing false entries.
RSI Confirmation (7-period)
The Relative Strength Index acts as a momentum filter:
Long signals require RSI > 50 (bullish momentum)
Short signals require RSI < 50 (bearish momentum)
This prevents entries during weak or divergent price action.
Fibonacci Bollinger Bands (200, 2.618)
Uses a 200-period Simple Moving Average with 2.618 standard deviation bands (Fibonacci ratio). These bands serve dual purposes:
Visual representation of price extremes
Automatic exit trigger when price reaches overextended levels
📈 Entry Logic
LONG Entry (BUY Signal)
A LONG position is opened when ALL of the following conditions are met simultaneously:
All three SuperTrend indicators turn green (bullish)
RSI(7) is above 50
This is the first bar where all conditions align (no repainting)
SHORT Entry (SELL Signal)
A SHORT position is opened when ALL of the following conditions are met simultaneously:
All three SuperTrend indicators turn red (bearish)
RSI(7) is below 50
This is the first bar where all conditions align (no repainting)
🚪 Exit Logic
Positions are automatically closed when ANY of these conditions occur:
SuperTrend Color Change: Any one of the three SuperTrend indicators changes direction
Fibonacci BB Touch: Price reaches or exceeds the upper or lower Fibonacci Bollinger Band (2.618 standard deviations)
This dual-exit approach protects profits by:
Exiting quickly when trend momentum shifts (SuperTrend change)
Taking profits at statistical price extremes (Fib BB touch)
🎨 Visual Features
Signal Arrows
Green Up Arrow (BUY): Appears below the bar when long entry conditions are met
Red Down Arrow (SELL): Appears above the bar when short entry conditions are met
Yellow Down Arrow (EXIT): Appears above the bar when exit conditions are met
Background Coloring
Light Green Tint: All three SuperTrends are bullish (uptrend environment)
Light Red Tint: All three SuperTrends are bearish (downtrend environment)
SuperTrend Lines
Three colored lines plotted with varying opacity:
Solid line (ST1): Most responsive to price changes
Semi-transparent (ST2): Medium-term trend
Most transparent (ST3): Long-term trend structure
Dashboard
Real-time information panel showing:
Individual SuperTrend status (UP/DOWN)
Current RSI value and color-coded status
Current position (LONG/SHORT/FLAT)
Net Profit/Loss
⚙️ Customizable Parameters
SuperTrend Settings
ATR periods for each SuperTrend (default: 10, 11, 12)
Multipliers for each SuperTrend (default: 1.0, 2.0, 3.0)
RSI Settings
RSI length (default: 7)
RSI source (default: close)
Fibonacci Bollinger Bands
BB length (default: 200)
BB multiplier (default: 2.618)
Strategy Options
Enable/disable long trades
Enable/disable short trades
Initial capital
Position sizing
Commission settings
💡 Strategy Philosophy
This strategy is built on the principle of confluence trading - waiting for multiple independent indicators to align before taking a position. By requiring three SuperTrend indicators AND RSI confirmation, the strategy filters out the majority of low-probability setups.
The multi-timeframe SuperTrend approach ensures that short-term, medium-term, and longer-term trends are all in agreement, which typically occurs during strong, sustainable price moves.
The exit strategy is equally important, using both trend-following logic (SuperTrend changes) and mean-reversion logic (Fibonacci BB touches) to adapt to different market conditions.
📊 Best Use Cases
Trending Markets: Works best in markets with clear directional bias
Higher Timeframes: Designed for 15-minute to daily charts
Volatile Assets: SuperTrend indicators excel in assets with clear trends
Swing Trading: Hold times typically range from hours to days
⚠️ Important Notes
No Repainting: All signals are confirmed and will not change on historical bars
One Signal Per Setup: The strategy prevents duplicate signals on consecutive bars
Exit Protection: Always exits before potentially taking an opposite position
Visual Clarity: All three SuperTrend lines are visible simultaneously for transparency
🎯 Recommended Settings
While default parameters are optimized for general use, consider:
Crypto/Volatile Markets: May benefit from slightly higher multipliers
Forex: Default settings work well for major pairs
Stocks: Consider longer BB periods (250-300) for daily charts
Lower Timeframes: Reduce all periods proportionally for scalping
📝 Alerts
Built-in alert conditions for:
BUY signal triggered
SELL signal triggered
EXIT signal triggered
Set up notifications to never miss a trade opportunity!
Disclaimer: This strategy is for educational and informational purposes only. Past performance does not guarantee future results. Always backtest thoroughly and practice proper risk management before live trading.

Squeeze Weekday Frequency [CHE] Squeeze Weekday Frequency — Tracks historical frequency of low-volatility squeezes by weekday to inform timing of low-risk setups.
Summary
This indicator monitors periods of unusually low volatility, defined as when the average true range falls below a percentile threshold, and tallies their occurrences across each weekday. By aggregating these counts over the chart's history, it reveals patterns in squeeze frequency, helping traders avoid or target specific days for reduced noise. The approach uses persistent counters to ensure accurate daily tallies without duplicates, providing a robust view of weekday biases in volatility regimes.
Motivation: Why this design?
Traders often face inconsistent signal quality due to varying volatility patterns tied to the trading calendar, such as quieter mid-week sessions or busier Mondays. This indicator addresses that by binning low-volatility events into weekday buckets, allowing users to spot recurring low-activity days where trends may develop with less whipsaw. It focuses on historical aggregation rather than real-time alerts, emphasizing pattern recognition over prediction.
What’s different vs. standard approaches?
- Reference baseline: Traditional volatility trackers like simple moving averages of range or standalone Bollinger Band squeezes, which ignore temporal distribution.
- Architecture differences:
- Employs array-based persistent counters for each weekday to accumulate events without recounting.
- Includes duplicate prevention via day-key tracking to handle sparse data.
- Features on-demand sorting and conditional display modes for focused insights.
- Practical effect: Charts show a persistent table of ranked weekdays instead of transient plots, making it easier to glance at biases like higher squeezes on Fridays, which reduces the need for manual logging and highlights calendar-driven edges.
How it works (technical)
The indicator first computes the average true range over a specified lookback period to gauge recent volatility. It then ranks this value against its own history within a sliding window to identify squeezes when the rank drops below the threshold. Each bar's timestamp is resolved to a weekday using the selected timezone, and a unique day identifier is generated from the date components.
On detecting a squeeze and valid price data, it checks against a stored last-marked day for that weekday to avoid multiple counts per day. If it's a new occurrence, the corresponding weekday counter in an array increments. Total days and data-valid days are tracked separately for context.
At the chart's last bar, it sums all counters to compute shares, sorts weekdays by their squeeze proportions, and populates a table with the selected subset. The table alternates row colors and highlights the peak weekday. An info label above the final bar summarizes totals and the top day. Background shading applies a faint red to squeeze bars for visual confirmation. State persists via variable arrays initialized once, ensuring counts build incrementally without resets.
Parameter Guide
ATR Length — Sets the lookback for measuring average true range, influencing squeeze sensitivity to short-term swings. Default: 14. Trade-offs/Tips: Shorter values increase responsiveness but raise false positives in chop; longer smooths for stability, potentially missing early squeezes.
Percentile Window (bars) — Defines the history length for ranking the current ATR, balancing recent relevance with sample size. Default: 252. Trade-offs/Tips: Narrower windows adapt faster to regime shifts but amplify noise; wider ones stabilize ranks yet lag in fast markets—aim for 100-500 bars on daily charts.
Squeeze threshold (PR < x) — Determines the cutoff for low-volatility classification; lower values flag rarer, tighter squeezes. Default: 10.0. Trade-offs/Tips: Tighter thresholds (under 5) yield fewer but higher-quality signals, reducing clutter; looser (over 20) captures more events at the cost of relevance.
Timezone — Selects the reference for weekday assignment; exchange default aligns with asset's session. Default: Exchange. Trade-offs/Tips: Use custom for cross-market analysis, but verify alignment to avoid offset errors in global pairs.
Show — Toggles the results table visibility for quick on/off of the display. Default: true. Trade-offs/Tips: Disable in multi-indicator setups to save screen space; re-enable for periodic reviews.
Pos — Positions the table on the chart pane for optimal viewing. Default: Top Right. Trade-offs/Tips: Bottom options suit long-term charts; test placements to avoid overlapping price action.
Font — Adjusts text size in the table for readability at different zooms. Default: normal. Trade-offs/Tips: Smaller fonts fit more data but strain eyes on small screens; larger for presentations.
Dark — Applies a dark color scheme to the table for contrast against chart backgrounds. Default: true. Trade-offs/Tips: Toggle false for light themes; ensures legibility without manual recoloring.
Display — Filters table rows to show all, top three, or bottom three weekdays by squeeze share. Default: All. Trade-offs/Tips: Use "Top 3" for focus on high-frequency days in active trading; "All" for full audits.
Reading & Interpretation
Red-tinted backgrounds mark individual squeeze bars, indicating current low-volatility conditions. The table's summary row shows the highest squeeze count, its percentage of total events, and the associated weekday in teal. Detail rows list selected weekdays with their absolute counts, proportional shares, and a left arrow for the peak day—higher percentages signal days where squeezes cluster, suggesting potential for calmer trend development. The info label reports overall days observed, valid data days, and reiterates the top weekday with its count. Drifting counts toward zero on a weekday imply rarity, while elevated ones point to habitual low-activity sessions.
Practical Workflows & Combinations
- Trend following: Scan for squeezes on high-frequency weekdays as entry filters, confirming with higher highs or lower lows in the structure; pair with momentum oscillators to time breaks.
- Exits/Stops: On low-squeeze days, widen stops for breathing room, tightening them during peak squeeze periods to guard against false breaks—use the table's percentages as a regime proxy.
- Multi-asset/Multi-TF: Defaults work across forex and indices on hourly or daily frames; for stocks, adjust percentile window to 100 for shorter histories. Scale thresholds up by 5-10 points for high-vol assets like crypto to maintain signal sparsity.
Behavior, Constraints & Performance
- Repaint/confirmation: Counts update only on confirmed bars via day-key changes, with no future references—live bars may shade red tentatively but tallies finalize at session close.
- security()/HTF: Not used, so no higher-timeframe repaint risks; all computations stay in the chart's resolution.
- Resources: Relies on a fixed-size array of seven elements and small loops for sorting and table fills, capped at 5000 bars back—efficient for most charts but may slow on very long intraday histories.
- Known limits: Ignores weekends and holidays implicitly via data presence; early chart bars lack full percentile context, leading to initial undercounting; assumes continuous sessions, so gaps in data (e.g., news halts) skew totals.
Sensible Defaults & Quick Tuning
Start with the built-in values for broad-market daily charts: ATR at 14, window at 252, threshold at 10. For noisier environments, lower the threshold to 5 and shorten the window to 100 to prioritize rare squeezes. If too few events appear, raise the threshold to 15 and extend ATR to 20 for broader capture. To combat overcounting in sparse data, widen the window to 500 while keeping others stock—monitor the info label's data-days count before trusting patterns.
What this indicator is—and isn’t
This serves as a statistical overlay for spotting calendar-based volatility biases, aiding in session selection and filter design. It is not a standalone signal generator, predictive model, or risk manager—integrate it with price action, volume, and broader strategy rules for decisions.
Disclaimer
The content provided, including all code and materials, is strictly for educational and informational purposes only. It is not intended as, and should not be interpreted as, financial advice, a recommendation to buy or sell any financial instrument, or an offer of any financial product or service. All strategies, tools, and examples discussed are provided for illustrative purposes to demonstrate coding techniques and the functionality of Pine Script within a trading context.
Any results from strategies or tools provided are hypothetical, and past performance is not indicative of future results. Trading and investing involve high risk, including the potential loss of principal, and may not be suitable for all individuals. Before making any trading decisions, please consult with a qualified financial professional to understand the risks involved.
By using this script, you acknowledge and agree that any trading decisions are made solely at your discretion and risk.
Do not use this indicator on Heikin-Ashi, Renko, Kagi, Point-and-Figure, or Range charts, as these chart types can produce unrealistic results for signal markers and alerts.
Best regards and happy trading
Chervolino

FVG Volume Profile [ChartPrime]⯁ OVERVIEW
FVG Volume Profile is a smart volume analysis tool that identifies Fair Value Gaps (FVGs) and overlays a volume profile inside each gap using data from lower timeframes. The indicator automatically selects the best time resolution or allows for manual control, giving traders deeper insight into the volume structure within each imbalance. POC levels and total volumes gives a full microstructure view inside every FVG.
⯁ KEY FEATURES
Fair Value Gap Detection (Bullish & Bearish)
Detects price gaps where inefficiency exists using a 3-bar structure.
-Bullish Gaps: Low > High with confirming middle bar.
-Bearish Gaps: High < Low with confirming middle bar.
Only significant gaps (filtered by standard deviation) are plotted to avoid noise.
Multi-Timeframe Volume Profiling
Pulls granular candle and volume data from a lower timeframe —
In Auto Mode, uses a resolution ~10x lower than the current chart.
In Manual Mode, lets the user select a custom timeframe.
This ensures accurate intra-gap volume distribution.
Dynamic Volume Binning
Each FVG is divided into vertical volume bins based on the Resolution input.
Each bin displays relative volume intensity as a horizontal box, scaled by percentage of the max bin volume.
Point of Control (PoC) Line & Label
The bin with the maximum volume inside each FVG is marked with:
A horizontal line (PoC) extending from the left to right side.
A label showing the absolute volume of that bin.
Color-coded to match bullish or bearish FVGs.
Total Volume Label Inside FVG
Each FVG displays the total volume sum from its profile:
For bullish FVGs , shown in the bottom-right corner.
For bearish FVGs , shown in the top-right corner.
Auto-Removal of Invalid Gaps
If price fully closes the gap (crosses its bounds), the FVG, profile, and PoC are deleted automatically.
This keeps the chart clean and focused only on active zones.
Toggleable Volume Profile Display
User can show or hide the volume profiles within FVGs using the "Display" toggle under the "FVG Volume Profile" group.
Only the PoC and FVG boxes remain visible if toggled off.
Volume Resolution Customization
Control the number of bins used for each FVG profile.
Higher resolution = more bins and finer volume analysis. (default 15)
Auto Timeframe Validation Warning
If the selected lower timeframe isn’t actually lower than the chart's, the script shows a visible warning label prompting adjustment.
Helps prevent calculation errors.
⯁ USAGE
Use this tool to identify active imbalance zones (FVGs) with embedded volume context.
Look for PoC positioning inside gaps — near top may indicate absorption or reversal zones.
Combine with price action at the PoC level for precision entries.
Hide volume profile for a cleaner view while retaining key POC and FVG boxes.
Use resolution controls to zoom into fine-grained profiles inside large gaps.
Consider Auto mode for seamless multi-timeframe analysis, or switch to Manual for full control.
⯁ CONCLUSION
FVG Volume Profile transforms raw imbalance detection into actionable insight by embedding lower-timeframe volume structure inside each Fair Value Gap. With PoC highlights, total volume labels, and customizable bin resolution, this indicator is essential for traders who want to understand not just where the gap is — but what volume did inside it .

RSI Bollinger Bands [DCAUT]█ RSI Bollinger Bands
📊 ORIGINALITY & INNOVATION
The RSI Bollinger Bands indicator represents a meaningful advancement in momentum analysis by combining two proven technical tools: the Relative Strength Index (RSI) and Bollinger Bands. This combination addresses a significant limitation in traditional RSI analysis - the use of fixed overbought/oversold thresholds (typically 70/30) that fail to adapt to changing market volatility conditions.
Core Innovation:
Rather than relying on static threshold levels, this indicator applies Bollinger Bands statistical analysis directly to RSI values, creating dynamic zones that automatically adjust based on recent momentum volatility. This approach helps reduce false signals during low volatility periods while remaining sensitive to genuine extremes during high volatility conditions.
Key Enhancements Over Traditional RSI:
Dynamic Thresholds: Overbought/oversold zones adapt to market conditions automatically, eliminating the need for manual threshold adjustments across different instruments and timeframes
Volatility Context: Band width provides immediate visual feedback about momentum volatility, helping traders distinguish between stable trends and erratic movements
Reduced False Signals: During ranging markets, narrower bands filter out minor RSI fluctuations that would trigger traditional fixed-threshold signals
Breakout Preparation: Band squeeze patterns (similar to price-based BB) signal potential momentum regime changes before they occur
Self-Referencing Analysis: By measuring RSI against its own statistical behavior rather than arbitrary levels, the indicator provides more relevant context
📐 MATHEMATICAL FOUNDATION
Two-Stage Calculation Process:
Stage 1: RSI Calculation
RSI = 100 - (100 / (1 + RS))
where RS = Average Gain / Average Loss over specified period
The RSI normalizes price momentum into a bounded 0-100 scale, making it ideal for statistical band analysis.
Stage 2: Bollinger Bands on RSI
Basis = MA(RSI, BB Length)
Upper Band = Basis + (StdDev(RSI, BB Length) × Multiplier)
Lower Band = Basis - (StdDev(RSI, BB Length) × Multiplier)
Band Width = Upper Band - Lower Band
The Bollinger Bands measure RSI's standard deviation from its own moving average, creating statistically-derived dynamic zones.
Statistical Interpretation:
Under normal distribution assumptions with default 2.0 multiplier, approximately 95% of RSI values should fall within the bands
Band touches represent statistically significant momentum extremes relative to recent behavior
Band width expansion indicates increasing momentum volatility (strengthening trend or increasing uncertainty)
Band width contraction signals momentum consolidation and potential regime change preparation
📊 COMPREHENSIVE SIGNAL ANALYSIS
Visual Color Signals:
This indicator features dynamic color fills that highlight extreme momentum conditions:
Green Fill (Above Upper Band):
Appears when RSI breaks above the upper band, indicating exceptionally strong bullish momentum
Represents dynamic overbought zone - not necessarily a reversal signal but a warning of extreme conditions
In strong uptrends, green fills can persist as RSI "rides the band" - this indicates sustained momentum strength
Exit of green zone (RSI falling back below upper band) often signals initial momentum weakening
Red Fill (Below Lower Band):
Appears when RSI breaks below the lower band, indicating exceptionally weak bearish momentum
Represents dynamic oversold zone - potential reversal or continuation signal depending on trend context
In strong downtrends, red fills can persist as RSI "rides the band" - this indicates sustained selling pressure
Exit of red zone (RSI rising back above lower band) often signals initial momentum recovery
Position-Based Signals:
Upper Band Interactions:
RSI Touching Upper Band: Dynamic overbought condition - momentum is extremely strong relative to recent volatility, potential exhaustion or continuation depending on trend context
RSI Riding Upper Band: Sustained strong momentum, often seen in powerful trends, not necessarily an immediate reversal signal but warrants monitoring for exhaustion
RSI Crossing Below Upper Band: Initial momentum weakening signal, particularly significant if accompanied by price divergence
Lower Band Interactions:
RSI Touching Lower Band: Dynamic oversold condition - momentum is extremely weak relative to recent volatility, potential reversal or continuation of downtrend
RSI Riding Lower Band: Sustained weak momentum, common in strong downtrends, monitor for potential exhaustion
RSI Crossing Above Lower Band: Initial momentum strengthening signal, early indication of potential reversal or consolidation
Basis Line Signals:
RSI Above Basis: Bullish momentum regime - upward pressure dominant
RSI Below Basis: Bearish momentum regime - downward pressure dominant
Basis Crossovers: Momentum regime shifts, more significant when accompanied by band width changes
RSI Oscillating Around Basis: Balanced momentum, often indicates ranging market conditions
Volatility-Based Signals:
Band Width Patterns:
Narrow Bands (Squeeze): Momentum volatility compression, often precedes significant directional moves, similar to price coiling patterns
Expanding Bands: Increasing momentum volatility, indicates trend acceleration or growing uncertainty
Narrowest Band in 100 Bars: Extreme compression alert, high probability of upcoming volatility expansion
Advanced Pattern Recognition:
Divergence Analysis:
Bullish Divergence: Price makes lower lows while RSI touches or stays above previous lower band touch, suggests downward momentum weakening
Bearish Divergence: Price makes higher highs while RSI touches or stays below previous upper band touch, suggests upward momentum weakening
Hidden Bullish: Price makes higher lows while RSI makes lower lows at the lower band, indicates strong underlying bullish momentum
Hidden Bearish: Price makes lower highs while RSI makes higher highs at the upper band, indicates strong underlying bearish momentum
Band Walk Patterns:
Upper Band Walk: RSI consistently touching or staying near upper band indicates exceptionally strong trend, wait for clear break below basis before considering reversal
Lower Band Walk: RSI consistently at lower band signals very weak momentum, requires break above basis for reversal confirmation
🎯 STRATEGIC APPLICATIONS
Strategy 1: Mean Reversion Trading
Setup Conditions:
Market Type: Ranging or choppy markets with no clear directional trend
Timeframe: Works best on lower timeframes (5m-1H) or during consolidation phases
Band Characteristic: Normal to narrow band width
Entry Rules:
Long Entry: RSI touches or crosses below lower band, wait for RSI to start rising back toward basis before entry
Short Entry: RSI touches or crosses above upper band, wait for RSI to start falling back toward basis before entry
Confirmation: Use price action confirmation (candlestick reversal patterns) at band touches
Exit Rules:
Target: RSI returns to basis line or opposite band
Stop Loss: Fixed percentage or below recent swing low/high
Time Stop: Exit if position not profitable within expected timeframe
Strategy 2: Trend Continuation Trading
Setup Conditions:
Market Type: Clear trending market with higher highs/lower lows
Timeframe: Medium to higher timeframes (1H-Daily)
Band Characteristic: Expanding or wide bands indicating strong momentum
Entry Rules:
Long Entry in Uptrend: Wait for RSI to pull back to basis line or slightly below, enter when RSI starts rising again
Short Entry in Downtrend: Wait for RSI to rally to basis line or slightly above, enter when RSI starts falling again
Avoid Counter-Trend: Do not fade RSI at bands during strong trends (band walk patterns)
Exit Rules:
Trailing Stop: Move stop to break-even when RSI reaches opposite band
Trend Break: Exit when RSI crosses basis against trend direction with conviction
Band Squeeze: Reduce position size when bands start narrowing significantly
Strategy 3: Breakout Preparation
Setup Conditions:
Market Type: Consolidating market after significant move or at key technical levels
Timeframe: Any timeframe, but longer timeframes provide more reliable breakouts
Band Characteristic: Narrowest band width in recent 100 bars (squeeze alert)
Preparation Phase:
Identify band squeeze condition (bands at multi-period narrowest point)
Monitor price action for consolidation patterns (triangles, rectangles, flags)
Prepare bracket orders for both directions
Wait for band expansion to begin
Entry Execution:
Breakout Confirmation: Enter in direction of RSI band breakout (RSI breaks above upper band or below lower band)
Price Confirmation: Ensure price also breaks corresponding technical level
Volume Confirmation: Look for volume expansion supporting the breakout
Risk Management:
Stop Loss: Place beyond consolidation pattern opposite extreme
Position Sizing: Use smaller size due to false breakout risk
Quick Exit: Exit immediately if RSI returns inside bands within 1-3 bars
Strategy 4: Multi-Timeframe Analysis
Timeframe Selection:
Higher Timeframe: Daily or 4H for trend context
Trading Timeframe: 1H or 15m for entry signals
Confirmation Timeframe: 5m or 1m for precise entry timing
Analysis Process:
Trend Identification: Check higher timeframe RSI position relative to bands, trade only in direction of higher timeframe momentum
Setup Formation: Wait for trading timeframe RSI to show pullback to basis in trending direction
Entry Timing: Use confirmation timeframe RSI band touch or crossover for precise entry
Alignment Confirmation: All timeframes should show RSI moving in same direction for highest probability setups
📋 DETAILED PARAMETER CONFIGURATION
RSI Source:
Close (Default): Standard price point, balances responsiveness and reliability
HL2: Reduces noise from intrabar volatility, provides smoother RSI values
HLC3 or OHLC4: Further smoothing for very choppy markets, slower to respond but more stable
Volume-Weighted: Consider using VWAP or volume-weighted prices for additional liquidity context
RSI Length Parameter:
Shorter Periods (5-10): More responsive but generates more signals, suitable for scalping or very active trading, higher noise level
Standard (14): Default and most widely used setting, proven balance between responsiveness and reliability, recommended starting point
Longer Periods (21-30): Smoother momentum measurement, fewer but potentially more reliable signals, better for swing trading or position trading
Optimization Note: Test across different market regimes, optimal length often varies by instrument volatility characteristics
RSI MA Type Parameter:
RMA (Default): Wilder's original smoothing method, provides traditional RSI behavior with balanced lag, most widely recognized and tested, recommended for standard technical analysis
EMA: Exponential smoothing gives more weight to recent values, faster response to momentum changes, suitable for active trading and trending markets, reduces lag compared to RMA
SMA: Simple average treats all periods equally, smoothest output with highest lag, best for filtering noise in choppy markets, useful for long-term position analysis
WMA: Weighted average emphasizes recent data less aggressively than EMA, middle ground between SMA and EMA characteristics, balanced responsiveness for swing trading
Advanced Options: Full access to 25+ moving average types including HMA (reduced lag), DEMA/TEMA (enhanced responsiveness), KAMA/FRAMA (adaptive behavior), T3 (smoothness), Kalman Filter (optimal estimation)
Selection Guide: RMA for traditional analysis and backtesting consistency, EMA for faster signals in trending markets, SMA for stability in ranging markets, adaptive types (KAMA/FRAMA) for varying volatility regimes
BB Length Parameter:
Short Length (10-15): Tighter bands that react quickly to RSI changes, more frequent band touches, suitable for active trading styles
Standard (20): Balanced approach providing meaningful statistical context without excessive lag
Long Length (30-50): Smoother bands that filter minor RSI fluctuations, captures only significant momentum extremes, fewer but higher quality signals
Relationship to RSI Length: Consider BB Length greater than RSI Length for cleaner signals
BB MA Type Parameter:
SMA (Default): Standard Bollinger Bands calculation using simple moving average for basis line, treats all periods equally, widely recognized and tested approach
EMA: Exponential smoothing for basis line gives more weight to recent RSI values, creates more responsive bands that adapt faster to momentum changes, suitable for trending markets
RMA: Wilder's smoothing provides consistent behavior aligned with traditional RSI when using RMA for both RSI and BB calculations
WMA: Weighted average for basis line balances recent emphasis with historical context, middle ground between SMA and EMA responsiveness
Advanced Options: Full access to 25+ moving average types for basis calculation, including HMA (reduced lag), DEMA/TEMA (enhanced responsiveness), KAMA/FRAMA (adaptive to volatility changes)
Selection Guide: SMA for standard Bollinger Bands behavior and backtesting consistency, EMA for faster band adaptation in dynamic markets, matching RSI MA type creates unified smoothing behavior
BB Multiplier Parameter:
Conservative (1.5-1.8): Tighter bands resulting in more frequent touches, useful in low volatility environments, higher signal frequency but potentially more false signals
Standard (2.0): Default setting representing approximately 95% confidence interval under normal distribution, widely accepted statistical threshold
Aggressive (2.5-3.0): Wider bands capturing only extreme momentum conditions, fewer but potentially more significant signals, reduces false signals in high volatility
Adaptive Approach: Consider adjusting multiplier based on instrument characteristics, lower multiplier for stable instruments, higher for volatile instruments
Parameter Optimization Workflow:
Start with default parameters (RSI:14, BB:20, Mult:2.0)
Test across representative sample period including different market regimes
Adjust RSI length based on desired responsiveness vs stability tradeoff
Tune BB length to match your typical holding period
Modify multiplier to achieve desired signal frequency
Validate on out-of-sample data to avoid overfitting
Document optimal parameters for different instruments and timeframes
Reference Levels Display:
Enabled (Default): Shows traditional 30/50/70 levels for comparison with dynamic bands, helps visualize the adaptive advantage
Disabled: Cleaner chart focusing purely on dynamic zones, reduces visual clutter for experienced users
Educational Value: Keeping reference levels visible helps understand how dynamic bands differ from fixed thresholds across varying market conditions
📈 PERFORMANCE ANALYSIS & COMPETITIVE ADVANTAGES
Comparison with Traditional RSI:
Fixed Threshold RSI Limitations:
In ranging low-volatility markets: RSI rarely reaches 70/30, missing tradable extremes
In trending high-volatility markets: RSI frequently breaks through 70/30, generating excessive false reversal signals
Across different instruments: Same thresholds applied to volatile crypto and stable forex pairs produce inconsistent results
Threshold Adjustment Problem: Manually changing thresholds for different conditions is subjective and lagging
RSI Bollinger Bands Advantages:
Automatic Adaptation: Bands adjust to current volatility regime without manual intervention
Consistent Logic: Same statistical approach works across different instruments and timeframes
Reduced False Signals: Band width filtering helps distinguish meaningful extremes from noise
Additional Information: Band width provides volatility context missing in standard RSI
Objective Extremes: Statistical basis (standard deviations) provides objective extreme definition
Comparison with Price-Based Bollinger Bands:
Price BB Characteristics:
Measures absolute price volatility
Affected by large price gaps and outliers
Band position relative to price not normalized
Difficult to compare across different price scales
RSI BB Advantages:
Normalized Scale: RSI's 0-100 bounds make band interpretation consistent across all instruments
Momentum Focus: Directly measures momentum extremes rather than price extremes
Reduced Gap Impact: RSI calculation smooths price gaps impact on band calculations
Comparable Analysis: Same RSI BB appearance across stocks, forex, crypto enables consistent strategy application
Performance Characteristics:
Signal Quality:
Higher Signal-to-Noise Ratio: Dynamic bands help filter RSI oscillations that don't represent meaningful extremes
Context-Aware Alerts: Band width provides volatility context helping traders adjust position sizing and stop placement
Reduced Whipsaws: During consolidations, narrower bands prevent premature signals from minor RSI movements
Responsiveness:
Adaptive Lag: Band calculation introduces some lag, but this lag is adaptive to current conditions rather than fixed
Faster Than Manual Adjustment: Automatic band adjustment is faster than trader's ability to manually modify thresholds
Balanced Approach: Combines RSI's inherent momentum lag with BB's statistical smoothing for stable yet responsive signals
Versatility:
Multi-Strategy Application: Supports both mean reversion (ranging markets) and trend continuation (trending markets) approaches
Universal Instrument Coverage: Works effectively across equities, forex, commodities, cryptocurrencies without parameter changes
Timeframe Agnostic: Same interpretation applies from 1-minute charts to monthly charts
Limitations and Considerations:
Known Limitations:
Dual Lag Effect: Combines RSI's momentum lag with BB's statistical lag, making it less suitable for very short-term scalping
Requires Volatility History: Needs sufficient bars for BB calculation, less effective immediately after major regime changes
Statistical Assumptions: Assumes RSI values are somewhat normally distributed, extreme trending conditions may violate this
Not a Standalone System: Like all indicators, should be combined with price action analysis and risk management
Optimal Use Cases:
Best for swing trading and position trading timeframes
Most effective in markets with alternating volatility regimes
Ideal for traders who use multiple instruments and timeframes
Suitable for systematic trading approaches requiring consistent logic
Suboptimal Conditions:
Very low timeframes (< 5 minutes) where lag becomes problematic
Instruments with extreme volatility spikes (gap-prone markets)
Markets in strong persistent trends where mean reversion rarely occurs
Periods immediately following major structural changes (new trading regime)
USAGE NOTES
This indicator is designed for technical analysis and educational purposes to help traders understand the interaction between momentum measurement and statistical volatility bands. The RSI Bollinger Bands has limitations and should not be used as the sole basis for trading decisions.
Important Considerations:
No Predictive Guarantee: Past band touches and patterns do not guarantee future price behavior
Market Regime Dependency: Indicator performance varies significantly between trending and ranging market conditions
Complementary Analysis Required: Should be used alongside price action, support/resistance levels, and fundamental analysis
Risk Management Essential: Always use proper position sizing, stop losses, and risk controls regardless of signal quality
Parameter Sensitivity: Different instruments and timeframes may require parameter optimization for optimal results
Continuous Monitoring: Band characteristics change with market conditions, requiring ongoing assessment
Recommended Supporting Analysis:
Price structure analysis (support/resistance, trend lines)
Volume confirmation for breakout signals
Multiple timeframe alignment
Market context awareness (news events, session times)
Correlation analysis with related instruments
The indicator aims to provide adaptive momentum analysis that adjusts to changing market volatility, but traders must apply sound judgment, proper risk management, and comprehensive market analysis in their decision-making process.

MCX RSI Screener (5m,15m,1D)A complete multi-timeframe RSI screener designed for MCX commodities.
It automatically fetches RSI values from 5-minute, 15-minute, and 1-day timeframes for up to 10 selected MCX symbols — all in one compact table.
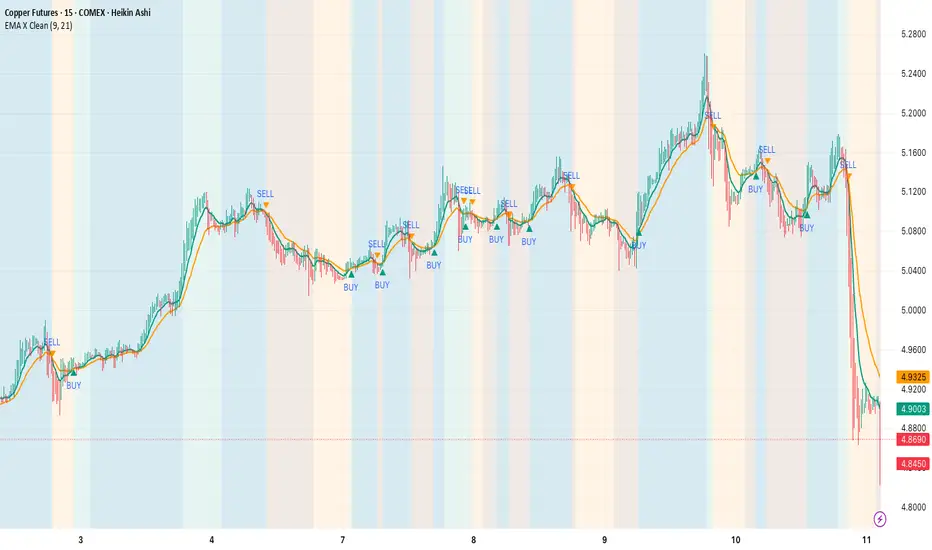
High Volume Candle Detector by Ravi Shinde📊 High Volume Candle Detector
🎯 Overview
Identify exceptional volume spikes that signal institutional activity, breakouts, and reversals. Detects candles with volume exceeding a customizable threshold (default: 3x average volume over 20 periods).
✨ Key Features
🔧 Customizable Settings
Volume Multiplier (default: 3.0x) - Define your threshold
Average Period (default: 20) - Adapt to any timeframe
Bullish/Bearish Detection - Automatic color coding (green/red)
🎨 Visual Styles
Background - Subtle colored highlighting
Border - Yellow box outline
Shape - Triangle markers with "HV" text
All - Combined display
🔔 Smart Alerts
Bullish High Volume 🟢
Bearish High Volume 🔴
Any High Volume ⚠️
📈 Derivatives Trading Method
High-volume candle highs and lows mark key breakout levels. Break above = Go Long. Break below = Go Short. Trail your stop-loss with a moving average of your choice for optimal risk management. Optimal performance on 15-minute or higher timeframes. Lower timeframes may generate excessive noise.
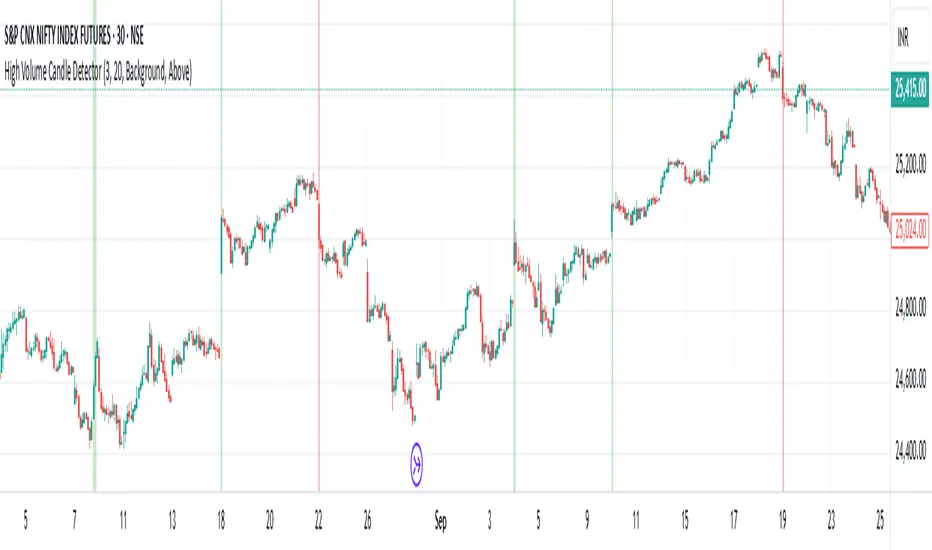
M15 Daily Open Candle Highlighter — v6Tô màu cây nến 15 phút đầu tiên của mỗi NGÀY giao dịch (theo múi giờ của symbol).