50 Week MAThis script plots the true 50-week simple moving average (SMA) derived directly from the weekly timeframe, ensuring accuracy across all chart intervals.
It allows you to visualise the long-term trend regardless of whether you’re viewing a 1-day, 4-hour, or 1-minute chart.
Commonly used by swing traders and long-term investors, the 50-week MA helps identify macro trend direction, dynamic support and resistance zones, and major cycle shifts in price behaviour.
"科创50成分股"に関するスクリプトを検索

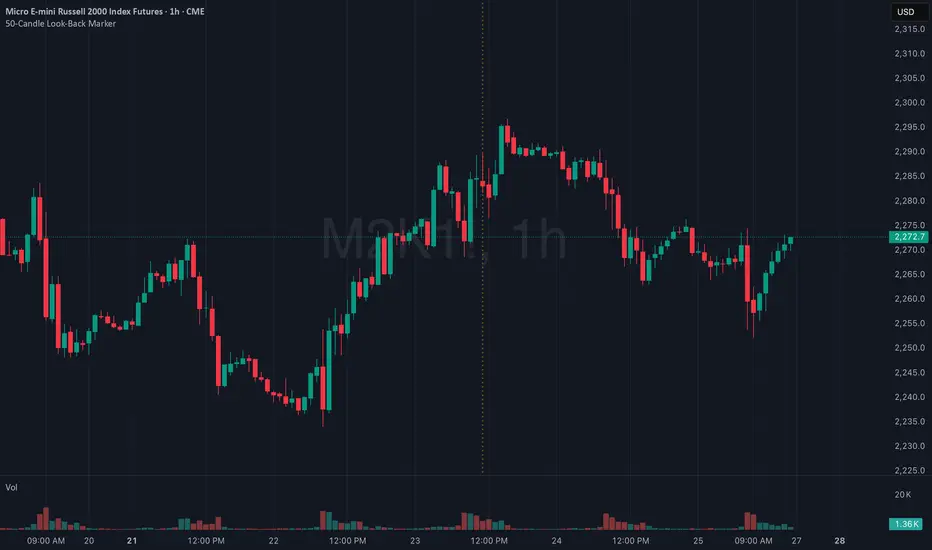
50-Candle Look-Back MarkerIt simply redraws one vertical dotted line that always sits exactly 50 bars behind the current bar, so you can check at a glance that any trend-line you draw has at least 50 candles of data to the right of it.
50 Pips A Day Strategy - Kaspricci50 Pips A Day Strategy
This strategy is designed to work on 1 hour timeframe. It is designed to capture the early market move of major forex pairs like EURUSD or GBPUSD. It takes the high and low of the first candle (7 a.m. GMT, London Stock Exchange opens) and places to pending orders at these prices levels.
High + additional gap in pips = buy stop pending order
Low + additional gap in pips = sell stop pending order
For both orders a stop loss of 15 pips and a take profit of 50 pips is used as a default. As soon as price triggers one pending order, the remaining pending order is cancelled. At the end of the configured session time all open and pending orders are closed / cancelled.
Settings
Trading Time - start and end time of session. It is configured for Monday to Friday only. At the beginning the first candle is used to define stop prices for pending orders.
Source for Buy Stop order - Default: high. Used to calculate buy stop order. You can add additional pips as a gap.
Source for Sell Stop order - Default: low. Used to calculate sell stop order. You can add additional pips as a gap.
Stop Loss in Pips - Default: 15. Used for both pending orders.
Take Profit in Pips - Default: 50. Used for both pending orders.
This strategy is for educational purposes only! It is not meant to be a financial recommendation.

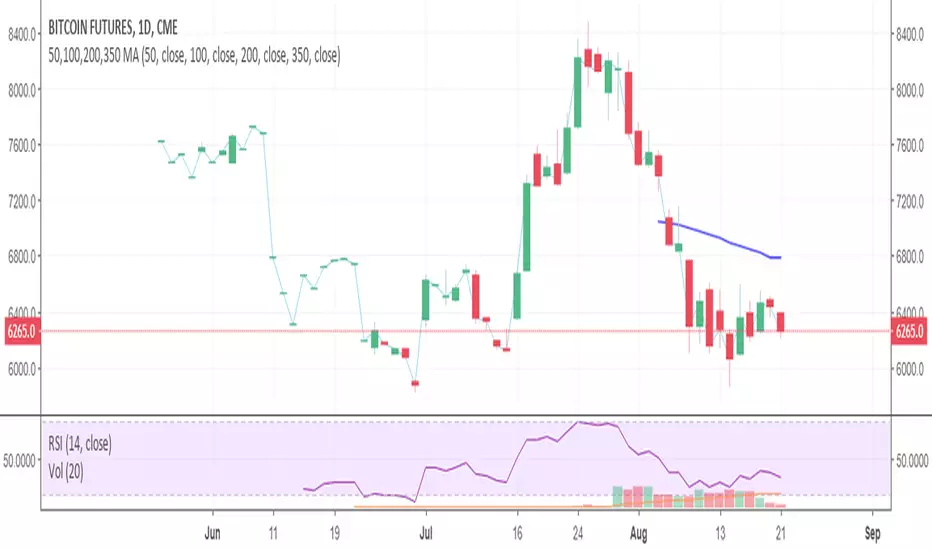
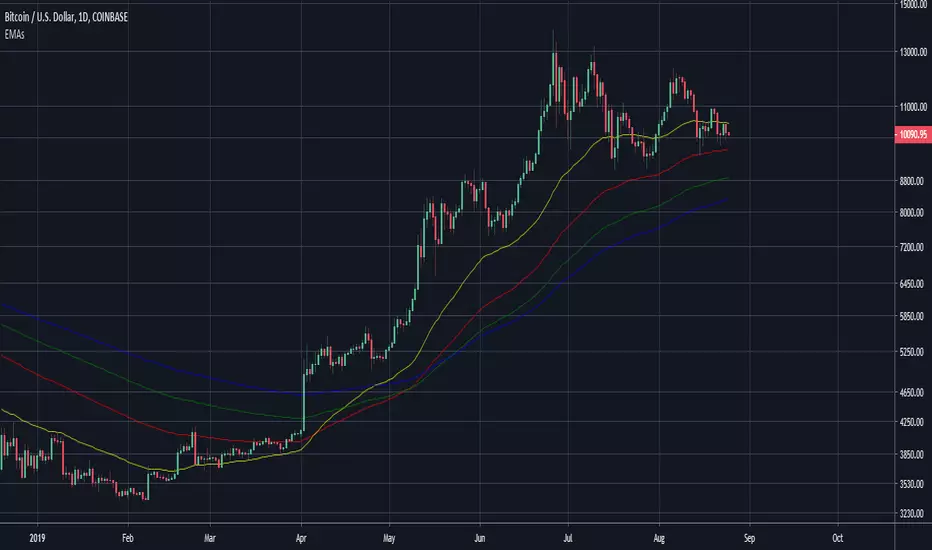
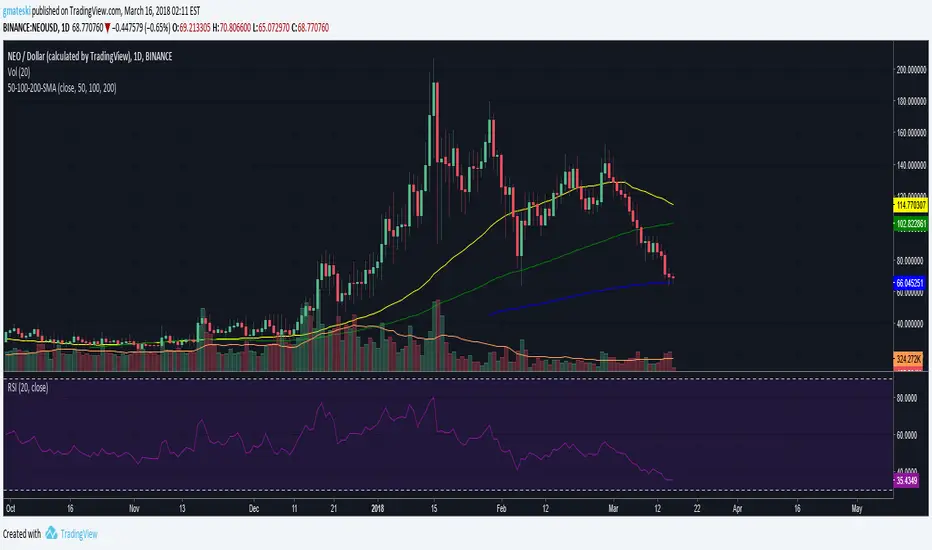
50,100,200,350 MAThis will display the 50, 100 & 200 moving average (MA) on your charts (also known as Simply Moving Average). When looking at these on a daily chart the 350ma is a representation of the 50 week moving average.
Hope this helps
Good Luck
Simon McCabe
Twitter: @simoncmccabe
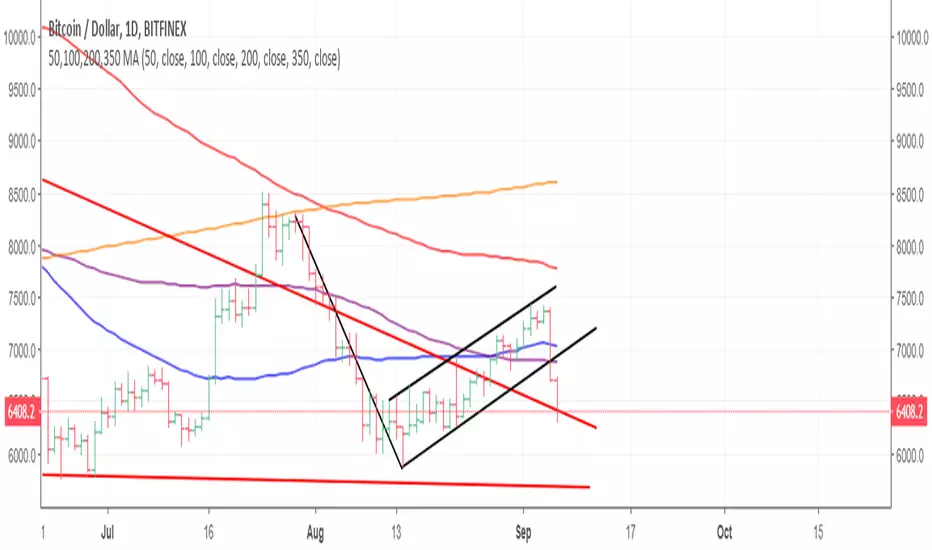
50,100,200,350 MAThis is the 50,100 & 200 day simple moving average plus the 350 day which is equivalent to the 50 week moving average. GL Simon McCabe
50, 100 & 200 Week MA (SMA/EMA Switch)Clean, multi-timeframe weekly moving average indicator displaying the classic 50, 100, and 200-week MAs directly on any chart timeframe.
Features:
True weekly calculations using request.security (accurate, no daily approximation)
Switch between SMA and EMA with one click
Individually toggle each MA (50w orange, 100w purple, 200w blue)
Perfect for long-term trend analysis, golden/death crosses, and institutional-level support/resistance
Ideal for swing traders, investors, and anyone tracking major market cycles. Lightweight and repaints-free.

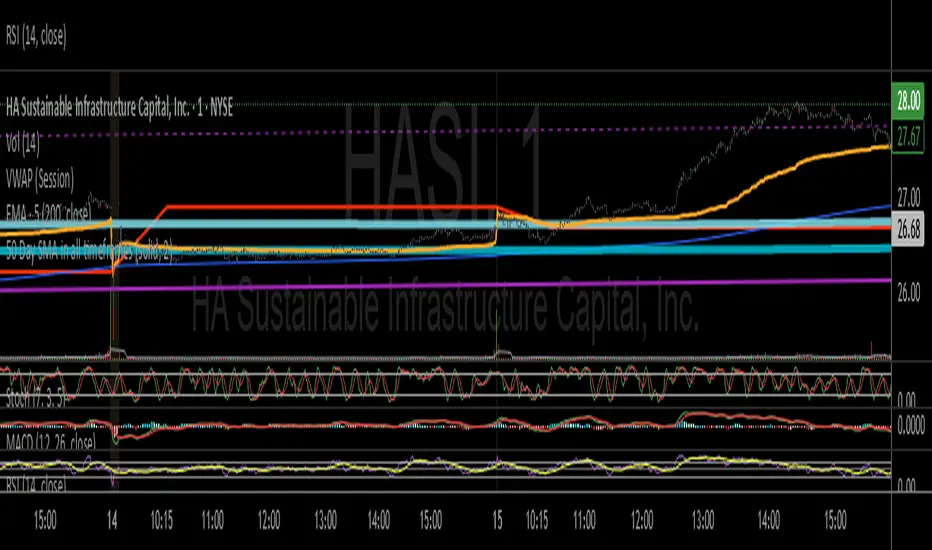
50 Day SMA in all timeframesThis script displays a 50 day SMA that displays correctly on all timeframes and adjusts when the chart is enlarged or reduced. Line color, style, etc are user adjustable. Default is blue thin line.
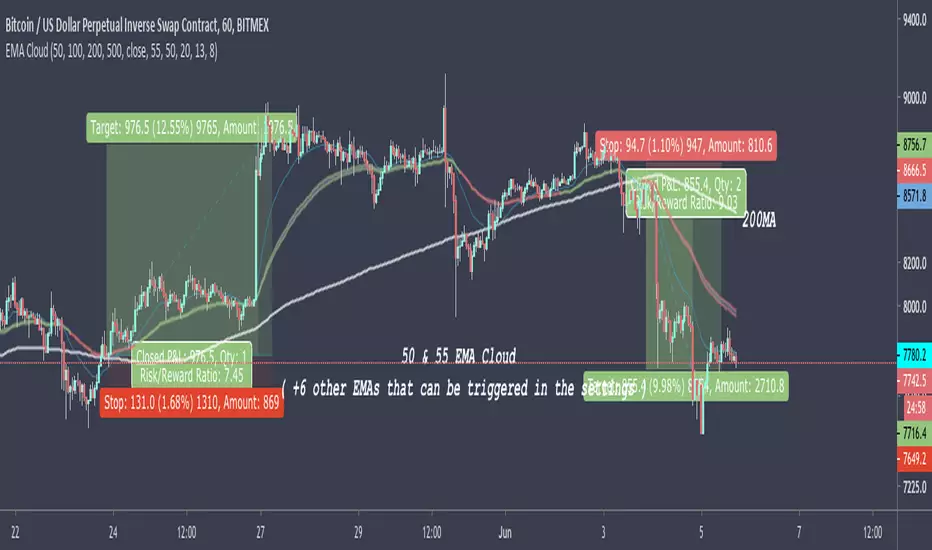
50 & 55 EMA CloudAfter testing thousands of indicators over the years, this simple EMA cloud indicator that I built is still my main weapon. It's always the first one I add to a blank charts and that is not going to change anytime soon.
I find EMAs and MAs are such underrated tools, By observing the price action surrounding these, I can see straight away if it's a good time to get into a trade or not.
As seen here, I also use the 200MA along with the 50/55EMA cloud to find extra strong support and resistances. If price starts to reject both the cloud and the 200MA at the same time/level, then it's a very good indication the price is going to make a big move in that direction as seen here in this chart.
50, 100, 200 EMAsA simple script that displays the 50, 100, and 200-period exponential moving averages. Reduce clutter by combining them into one indicator!

50, 100, 200 SMAsA simple script that displays the 50, 100, and 200-period simple moving averages. Reduce clutter by combining them into one indicator!

50,100,200 MA by CryptoLife71(FIXED)Updated the code by CryptoLife71 so that the 200ma shows correctly.

Punji's Dynamic Monthly EMA/SMA 5,9,21,50Punji's Dynamic Monthly EMA/SMA 5,9,21,50
Overview:
This indicator displays monthly timeframe moving averages as horizontal dotted lines extending to the right of your chart, regardless of what timeframe you're currently viewing. It includes four key monthly moving averages: EMA 5, EMA 9, EMA 21, and SMA 50.
━━━━━━━━━━━━━━━━━━━━━━━━━━━━━━━━━━━━━━━━
Key Features:
Clean Chart Design
Unlike traditional moving average lines that clutter your chart with curves across all candles, this indicator uses horizontal dotted lines that extend only from the current price level to the right edge of your screen. The dotted line style creates clear visual breaks while maintaining readability.
Multi-Timeframe Analysis
View monthly moving averages on any timeframe (1min, 5min, 15min, 1hr, 4hr, daily, weekly, etc.) without switching charts. Perfect for traders who want to see the highest timeframe context while trading any lower timeframe.
Fully Customizable
Toggle each moving average on/off independently
Adjust the period length for each MA (default: 5, 9, 21, 50)
Customize colors for each line (default gradient: green → teal → yellow → red)
Master toggle to show/hide all monthly lines at once
All lines use dotted style for clear visual distinction
Professional Color Scheme
EMA 5: Bright Green (#4CAF50)
EMA 9: Teal (#009688)
EMA 21: Yellow (#FFEB3B)
SMA 50: Light Red (#FF6B6B)
━━━━━━━━━━━━━━━━━━━━━━━━━━━━━━━━━━━━━━━━
Benefits of Horizontal Dotted Lines:
Reduced Visual Noise
Horizontal lines keep your price action clean and easy to read while still providing critical monthly support/resistance levels. The dotted style adds visual distinction without being overwhelming.
Focus on Current Monthly Levels
What matters most is where the monthly MAs are NOW relative to price - horizontal lines highlight this instantly without requiring you to trace curved lines backward through history.
Better Price Action Visibility
See candlestick patterns, volume profiles, and support/resistance levels clearly without MA lines crossing through them. Your chart remains uncluttered and analysis-ready.
Quick Reference for Monthly Context
Instantly identify if price is above or below key monthly moving averages without following curved lines across the chart. Perfect for all traders who need to respect monthly structure and major trend direction.
Professional Appearance
Clean, minimalist design with dotted lines preferred by institutional traders and technical analysts who value both aesthetics and functionality.
━━━━━━━━━━━━━━━━━━━━━━━━━━━━━━━━━━━━━━━━
Use Cases:
Position Traders & Investors
Monitor monthly moving averages for major trend direction and long-term support/resistance zones. Monthly levels are among the most significant in technical analysis.
Swing Traders
Track monthly moving averages as major dynamic support/resistance levels for position sizing and risk management. Monthly levels often represent the strongest market structure.
Multi-Timeframe Analysis
Combine with daily and weekly charts to see complete timeframe confluence. Monthly levels provide the macro trend context for all trading decisions.
Trend Identification
Quickly identify monthly trend direction and major reversal zones. When price is above all monthly MAs, the macro trend is bullish; below all MAs indicates bearish monthly structure.
Risk Management
Use monthly moving averages as ultimate stop-loss zones for long-term positions. Breaking monthly MAs often signals significant trend changes.
━━━━━━━━━━━━━━━━━━━━━━━━━━━━━━━━━━━━━━━━
Technical Specifications:
Pine Script v5
Timeframe: Monthly (M)
Moving Averages: EMA 5, EMA 9, EMA 21, SMA 50
Line Style: Dotted (all lines)
Line Width: 2
Overlay: True (displays on main chart)
Resource Usage: Minimal (4 security calls)
━━━━━━━━━━━━━━━━━━━━━━━━━━━━━━━━━━━━━━━━
Best Practices:
Combine with PUNJI Dynamic Daily & Weekly EMA/SMA Indicators
For the ultimate multi-timeframe analysis, use this monthly indicator alongside "Punjis Dynamic Daily EMA/SMA 5,9,21,50,100,200 Levels" (solid lines) and "Punji's Dynamic Weekly EMA/SMA 5,9,21,50" (dashed lines). The three PUNJI indicators together provide complete insight into daily, weekly, and monthly market structure without cluttering your chart. Daily = Solid lines, Weekly = Dashed lines, Monthly = Dotted lines. This combination gives you a complete view of all major timeframe levels simultaneously.
Respect Monthly Structure
Monthly moving averages carry the most significant weight in technical analysis. Use them as major support/resistance zones and ultimate trend filters for all your trading decisions.
Customize to Your Strategy
Adjust the lengths and colors to match your personal trading methodology. Some traders prefer different EMA/SMA periods based on their market and investment timeframe.
Keep Charts Clean
Toggle off lines you're not actively using to maintain maximum chart clarity. The master toggle allows quick show/hide of all monthly levels.
━━━━━━━━━━━━━━━━━━━━━━━━━━━━━━━━━━━━━━━━
This indicator is perfect for traders and investors who want to maintain awareness of monthly market structure and major trend direction while keeping their charts clean, professional, and easy to read.

Punji's Dynamic Weekly EMA/SMA 5,9,21,50Punji's Dynamic Weekly EMA/SMA 5,9,21,50
Overview:
This indicator displays weekly timeframe moving averages as horizontal dashed lines extending to the right of your chart, regardless of what timeframe you're currently viewing. It includes four key weekly moving averages: EMA 5, EMA 9, EMA 21, and SMA 50.
━━━━━━━━━━━━━━━━━━━━━━━━━━━━━━━━━━━━━━━━
Key Features:
Clean Chart Design
Unlike traditional moving average lines that clutter your chart with curves across all candles, this indicator uses horizontal dashed lines that extend only from the current price level to the right edge of your screen. The dashed line style creates clear visual breaks while maintaining readability.
Multi-Timeframe Analysis
View weekly moving averages on any intraday timeframe (1min, 5min, 15min, 1hr, 4hr, daily, etc.) without switching charts. Perfect for traders who want to see higher timeframe context while trading shorter timeframes.
Fully Customizable
Toggle each moving average on/off independently
Adjust the period length for each MA (default: 5, 9, 21, 50)
Customize colors for each line (default gradient: green → teal → yellow → red)
Master toggle to show/hide all weekly lines at once
All lines use dashed style for clear visual distinction
Professional Color Scheme
EMA 5: Bright Green (#4CAF50)
EMA 9: Teal (#009688)
EMA 21: Yellow (#FFEB3B)
SMA 50: Light Red (#FF6B6B)
━━━━━━━━━━━━━━━━━━━━━━━━━━━━━━━━━━━━━━━━
Benefits of Horizontal Dashed Lines:
Reduced Visual Noise
Horizontal lines keep your price action clean and easy to read while still providing critical weekly support/resistance levels. The dashed style adds visual interest without being overwhelming.
Focus on Current Weekly Levels
What matters most is where the weekly MAs are NOW relative to price - horizontal lines highlight this instantly without requiring you to trace curved lines backward through history.
Better Price Action Visibility
See candlestick patterns, volume profiles, and support/resistance levels clearly without MA lines crossing through them. Your chart remains uncluttered and analysis-ready.
Quick Reference for Weekly Context
Instantly identify if price is above or below key weekly moving averages without following curved lines across the chart. Perfect for intraday traders who need to respect weekly structure.
Professional Appearance
Clean, minimalist design with dashed lines preferred by institutional traders and technical analysts who value both aesthetics and functionality.
━━━━━━━━━━━━━━━━━━━━━━━━━━━━━━━━━━━━━━━━
Use Cases:
Day Traders
Monitor higher timeframe weekly levels on intraday charts (5min, 15min, 1hr) to stay aware of major support/resistance zones and trend direction from the weekly perspective.
Swing Traders
Track weekly moving averages as dynamic support/resistance levels for position entries and exits. Weekly levels often act as strong magnets for price action.
Multi-Timeframe Analysis
Combine with daily or 4-hour charts to see multiple timeframe confluence without cluttering your workspace with overlapping curved lines.
Trend Identification
Quickly identify weekly trend direction and potential reversal zones. When price is above all weekly MAs, the weekly trend is bullish; below all MAs indicates bearish weekly structure.
Clean Workspace Trading
Ideal for price action traders who need clean charts for pattern recognition, order flow analysis, and technical setups without visual interference from traditional moving averages.
━━━━━━━━━━━━━━━━━━━━━━━━━━━━━━━━━━━━━━━━
Technical Specifications:
Pine Script v5
Timeframe: Weekly (W)
Moving Averages: EMA 5, EMA 9, EMA 21, SMA 50
Line Style: Dashed (all lines)
Line Width: 2
Overlay: True (displays on main chart)
Resource Usage: Minimal (4 security calls)
━━━━━━━━━━━━━━━━━━━━━━━━━━━━━━━━━━━━━━━━
Best Practices:
Combine with PUNJI Dynamic Daily & Monthly EMA/SMA Indicators
Use this alongside "Punjis Dynamic Daily EMA/SMA 5,9,21,50,100,200 Levels" (solid lines) and "Punji's Dynamic Monthly EMA/SMA 5,9,21,50" (dotted lines) for complete multi-timeframe analysis. The three indicators together provide comprehensive insight into daily, weekly, and monthly market structure without cluttering your chart. Daily = Solid lines, Weekly = Dashed lines, Monthly = Dotted lines.
Respect Weekly Structure
Weekly moving averages carry significant weight in the market. Use them as major support/resistance zones and trend filters for your trading decisions.
Customize to Your Strategy
Adjust the lengths and colors to match your personal trading methodology. Some traders prefer different EMA/SMA periods based on their market and timeframe.
Keep Charts Clean
Toggle off lines you're not actively using to maintain maximum chart clarity. The master toggle allows quick show/hide of all weekly levels.
━━━━━━━━━━━━━━━━━━━━━━━━━━━━━━━━━━━━━━━━
This indicator is perfect for traders who want to maintain awareness of weekly market structure while keeping their charts clean, professional, and easy to read.

Punji's Dynamic Weekly EMA/SMA 5,9,21,50Punji's Dynamic Weekly EMA/SMA 5,9,21,50
Overview:
This indicator displays weekly timeframe moving averages as horizontal dashed lines extending to the right of your chart, regardless of what timeframe you're currently viewing. It includes four key weekly moving averages: EMA 5, EMA 9, EMA 21, and SMA 50.
━━━━━━━━━━━━━━━━━━━━━━━━━━━━━━━━━━━━━━━━
Key Features:
Clean Chart Design
Unlike traditional moving average lines that clutter your chart with curves across all candles, this indicator uses horizontal dashed lines that extend only from the current price level to the right edge of your screen. The dashed line style creates clear visual breaks while maintaining readability.
Multi-Timeframe Analysis
View weekly moving averages on any intraday timeframe (1min, 5min, 15min, 1hr, 4hr, daily, etc.) without switching charts. Perfect for traders who want to see higher timeframe context while trading shorter timeframes.
Fully Customizable
Toggle each moving average on/off independently Adjust the period length for each MA (default: 5, 9, 21, 50) Customize colors for each line (default gradient: green → teal → yellow → red) Master toggle to show/hide all weekly lines at once All lines use dashed style for clear visual distinction
Professional Color Scheme
EMA 5: Bright Green (#4CAF50) EMA 9: Teal (
#009688) EMA 21: Yellow (#FFEB3B) SMA 50: Light Red (
#FF6B6B)
━━━━━━━━━━━━━━━━━━━━━━━━━━━━━━━━━━━━━━━━
Benefits of Horizontal Dashed Lines:
Reduced Visual Noise
Horizontal lines keep your price action clean and easy to read while still providing critical weekly support/resistance levels. The dashed style adds visual interest without being overwhelming.
Focus on Current Weekly Levels
What matters most is where the weekly MAs are NOW relative to price - horizontal lines highlight this instantly without requiring you to trace curved lines backward through history.
Better Price Action Visibility
See candlestick patterns, volume profiles, and support/resistance levels clearly without MA lines crossing through them. Your chart remains uncluttered and analysis-ready.
Quick Reference for Weekly Context
Instantly identify if price is above or below key weekly moving averages without following curved lines across the chart. Perfect for intraday traders who need to respect weekly structure.
Professional Appearance
Clean, minimalist design with dashed lines preferred by institutional traders and technical analysts who value both aesthetics and functionality.
━━━━━━━━━━━━━━━━━━━━━━━━━━━━━━━━━━━━━━━━
Use Cases:
Day Traders
Monitor higher timeframe weekly levels on intraday charts (5min, 15min, 1hr) to stay aware of major support/resistance zones and trend direction from the weekly perspective.
Swing Traders
Track weekly moving averages as dynamic support/resistance levels for position entries and exits. Weekly levels often act as strong magnets for price action.
Multi-Timeframe Analysis
Combine with daily or 4-hour charts to see multiple timeframe confluence without cluttering your workspace with overlapping curved lines.
Trend Identification
Quickly identify weekly trend direction and potential reversal zones. When price is above all weekly MAs, the weekly trend is bullish; below all MAs indicates bearish weekly structure.
Clean Workspace Trading
Ideal for price action traders who need clean charts for pattern recognition, order flow analysis, and technical setups without visual interference from traditional moving averages.
━━━━━━━━━━━━━━━━━━━━━━━━━━━━━━━━━━━━━━━━
Technical Specifications:
Pine Script v5 Timeframe: Weekly (W) Moving Averages: EMA 5, EMA 9, EMA 21, SMA 50 Line Style: Dashed (all lines) Line Width: 2 Overlay: True (displays on main chart) Resource Usage: Minimal (4 security calls)
━━━━━━━━━━━━━━━━━━━━━━━━━━━━━━━━━━━━━━━━
Best Practices:
Combine with PUNJI Dynamic Daily EMA/SMA Indicator
Use this alongside "Punjis Dynamic Daily EMA/SMA 5,9,21,50,100,200 Levels" for complete multi-timeframe analysis. The daily indicator uses solid lines while this weekly indicator uses dashed lines for easy visual distinction. Together, they provide comprehensive insight into both daily and weekly market structure without cluttering your chart.
Respect Weekly Structure
Weekly moving averages carry significant weight in the market. Use them as major support/resistance zones and trend filters for your trading decisions.
Customize to Your Strategy
Adjust the lengths and colors to match your personal trading methodology. Some traders prefer different EMA/SMA periods based on their market and timeframe.
Keep Charts Clean
Toggle off lines you're not actively using to maintain maximum chart clarity. The master toggle allows quick show/hide of all weekly levels.
━━━━━━━━━━━━━━━━━━━━━━━━━━━━━━━━━━━━━━━━
This indicator is perfect for traders who want to maintain awareness of weekly market structure while keeping their charts clean, professional, and easy to read.

Punjis Dynamic Daily EMA/SMA 5,9,21,50,100 LevelsPunjis Dynamic Daily EMA/SMA 5,9,21,50,100 Levels
Overview:
This indicator displays daily timeframe moving averages as horizontal lines extending to the right of your chart, regardless of what timeframe you're currently viewing. It includes six key moving averages: EMA 5, EMA 9, EMA 21, SMA 50, SMA 100, and SMA 200.
Key Features:
Clean Chart Design: Unlike traditional moving average lines that clutter your chart with curves across all candles, this indicator uses horizontal lines that extend only from the current price level to the right edge of your screen
Multi-Timeframe Analysis: View daily moving averages on any intraday timeframe (1min, 5min, 15min, etc.) without switching charts
Fully Customizable:
Toggle each moving average on/off independently
Adjust the period length for each MA
Customize colors for each line
Master toggle to show/hide all lines at once
Reduced Visual Noise: Horizontal lines keep your price action clean and easy to read while still providing critical support/resistance levels
Professional Layout: Perfect for traders who need to monitor multiple key levels without obscuring candlestick patterns and chart analysis
Benefits of Horizontal Lines:
Cleaner Charts: Traditional MAs draw lines through every candle, creating visual clutter. Horizontal lines only show current values, keeping your chart clean
Focus on Current Levels: What matters most is where the MAs are NOW relative to price - horizontal lines highlight this instantly
Better Price Action Visibility: See candlestick patterns, volume, and support/resistance levels clearly without MA lines crossing through them
Quick Reference: Instantly identify if price is above or below key moving averages without following curved lines across the chart
Professional Appearance: Clean, minimalist design preferred by institutional traders and technical analysts
Use Cases:
Day traders monitoring higher timeframe levels on intraday charts
Swing traders tracking daily moving averages as dynamic support/resistance
Multi-timeframe analysis without chart switching
Identifying trend direction and potential reversal zones
Clean workspace for pattern recognition and price action trading

ADR% Extension Levels from SMA 50I created this indicator inspired by RealSimpleAriel (a swing trader I recommend following on X) who does not buy stocks extended beyond 4 ADR% from the 50 SMA and uses extensions from the 50 SMA at 7-8-9-10-11-12-13 ADR% to take profits with a 20% position trimming.
RealSimpleAriel's strategy (as I understood it):
-> Focuses on leading stocks from leading groups and industries, i.e., those that have grown the most in the last 1-3-6 months (see on Finviz groups and then select sector-industry).
-> Targets stocks with the best technical setup for a breakout, above the 200 SMA in a bear market and above both the 50 SMA and 200 SMA in a bull market, selecting those with growing Earnings and Sales.
-> Buys stocks on breakout with a stop loss set at the day's low of the breakout and ensures they are not extended beyond 4 ADR% from the 50 SMA.
-> 3-5 day momentum burst: After a breakout, takes profits by selling 1/2 or 1/3 of the position after a 3-5 day upward move.
-> 20% trimming on extension from the 50 SMA: At 7 ADR% (ADR% calculated over 20 days) extension from the 50 SMA, takes profits by selling 20% of the remaining position. Continues to trim 20% of the remaining position based on the stock price extension from the 50 SMA, calculated using the 20-period ADR%, thus trimming 20% at 8-9-10-11 ADR% extension from the 50 SMA. Upon reaching 12-13 ADR% extension from the 50 SMA, considers the stock overextended, closes the remaining position, and evaluates a short.
-> Trailing stop with ascending SMA: Uses a chosen SMA (10, 20, or 50) as the definitive stop loss for the position, depending on the stock's movement speed (preferring larger SMAs for slower-moving stocks or for long-term theses). If the stock's closing price falls below the chosen SMA, the entire position is closed.
In summary:
-->Buy a breakout using the day's low of the breakout as the stop loss (this stop loss is the most critical).
--> Do not buy stocks extended beyond 4 ADR% from the 50 SMA.
--> Sell 1/2 or 1/3 of the position after 3-5 days of upward movement.
--> Trim 20% of the position at each 7-8-9-10-11-12-13 ADR% extension from the 50 SMA.
--> Close the entire position if the breakout fails and the day's low of the breakout is reached.
--> Close the entire position if the price, during the rise, falls below a chosen SMA (10, 20, or 50, depending on your preference).
--> Definitively close the position if it reaches 12-13 ADR% extension from the 50 SMA.
I used Grok from X to create this indicator. I am not a programmer, but based on the ADR% I use, it works.
Below is Grok from X's description of the indicator:
Script Description
The script is a custom indicator for TradingView that displays extension levels based on ADR% relative to the 50-period Simple Moving Average (SMA). Below is a detailed description of its features, structure, and behavior:
1. Purpose of the Indicator
Name: "ADR% Extension Levels from SMA 50".
Objective: Draw horizontal blue lines above and below the 50-period SMA, corresponding to specific ADR% multiples (4, 7, 8, 9, 10, 11, 12, 13). These levels represent potential price extension zones based on the average daily percentage volatility.
Overlay: The indicator is overlaid on the price chart (overlay=true), so the lines and SMA appear directly on the price graph.
2. Configurable Inputs
The indicator allows users to customize parameters through TradingView settings:
SMA Length (smaLength):
Default: 50 periods.
Description: Specifies the number of periods for calculating the Simple Moving Average (SMA). The 50-period SMA serves as the reference point for extension levels.
Constraint: Minimum 1 period.
ADR% Length (adrLength):
Default: 20 periods.
Description: Specifies the number of days to calculate the moving average of the daily high/low ratio, used to determine ADR%.
Constraint: Minimum 1 period.
Scale Factor (scaleFactor):
Default: 1.0.
Description: An optional multiplier to adjust the distance of extension levels from the SMA. Useful if levels are too close or too far due to an overly small or large ADR%.
Constraint: Minimum 0.1, increments of 0.1.
Tooltip: "Adjust if levels are too close or far from SMA".
3. Main Calculations
50-period SMA:
Calculated with ta.sma(close, smaLength) using the closing price (close).
Serves as the central line around which extension levels are drawn.
ADR% (Average Daily Range Percentage):
Formula: 100 * (ta.sma(dhigh / dlow, adrLength) - 1).
Details:
dhigh and dlow are the daily high and low prices, obtained via request.security(syminfo.tickerid, "D", high/low) to ensure data is daily-based, regardless of the chart's timeframe.
The dhigh / dlow ratio represents the daily percentage change.
The simple moving average (ta.sma) of this ratio over 20 days (adrLength) is subtracted by 1 and multiplied by 100 to obtain ADR% as a percentage.
The result is multiplied by scaleFactor for manual adjustments.
Extension Levels:
Defined as ADR% multiples: 4, 7, 8, 9, 10, 11, 12, 13.
Stored in an array (levels) for easy iteration.
For each level, prices above and below the SMA are calculated as:
Above: sma50 * (1 + (level * adrPercent / 100))
Below: sma50 * (1 - (level * adrPercent / 100))
These represent price levels corresponding to a percentage change from the SMA equal to level * ADR%.
4. Visualization
Horizontal Blue Lines:
For each level (4, 7, 8, 9, 10, 11, 12, 13 ADR%), two lines are drawn:
One above the SMA (e.g., +4 ADR%).
One below the SMA (e.g., -4 ADR%).
Color: Blue (color.blue).
Style: Solid (style=line.style_solid).
Management:
Each level has dedicated variables for upper and lower lines (e.g., upperLine1, lowerLine1 for 4 ADR%).
Previous lines are deleted with line.delete before drawing new ones to avoid overlaps.
Lines are updated at each bar with line.new(bar_index , level, bar_index, level), covering the range from the previous bar to the current one.
Labels:
Displayed only on the last bar (barstate.islast) to avoid clutter.
For each level, two labels:
Above: E.g., "4 ADR%", positioned above the upper line (style=label.style_label_down).
Below: E.g., "-4 ADR%", positioned below the lower line (style=label.style_label_up).
Color: Blue background, white text.
50-period SMA:
Drawn as a gray line (color.gray) for visual reference.
Diagnostics:
ADR% Plot: ADR% is plotted in the status line (orange, histogram style) to verify the value.
ADR% Label: A label on the last bar near the SMA shows the exact ADR% value (e.g., "ADR%: 2.34%"), with a gray background and white text.
5. Behavior
Dynamic Updating:
Lines update with each new bar to reflect new SMA 50 and ADR% values.
Since ADR% uses daily data ("D"), it remains constant within the same day but changes day-to-day.
Visibility Across All Bars:
Lines are drawn on every bar, not just the last one, ensuring visibility on historical data as well.
Adaptability:
The scaleFactor allows level adjustments if ADR% is too small (e.g., for low-volatility symbols) or too large (e.g., for cryptocurrencies).
Compatibility:
Works on any timeframe since ADR% is calculated from daily data.
Suitable for symbols with varying volatility (e.g., stocks, forex, cryptocurrencies).
6. Intended Use
Technical Analysis: Extension levels represent significant price zones based on average daily volatility. They can be used to:
Identify potential price targets (e.g., take profit at +7 ADR%).
Assess support/resistance zones (e.g., -4 ADR% as support).
Measure price extension relative to the 50 SMA.
Trading: Useful for strategies based on breakouts or mean reversion, where ADR% levels indicate reversal or continuation points.
Debugging: Labels and ADR% plot help verify that values align with the symbol’s volatility.
7. Limitations
Dependence on Daily Data: ADR% is based on daily dhigh/dlow, so it may not reflect intraday volatility on short timeframes (e.g., 1 minute).
Extreme ADR% Values: For low-volatility symbols (e.g., bonds) or high-volatility symbols (e.g., meme stocks), ADR% may require adjustments via scaleFactor.
Graphical Load: Drawing 16 lines (8 upper, 8 lower) on every bar may slow the chart for very long historical periods, though line management is optimized.
ADR% Formula: The formula 100 * (sma(dhigh/dlow, Length) - 1) may produce different values compared to other ADR% definitions (e.g., (high - low) / close * 100), so users should be aware of the context.
8. Visual Example
On a chart of a stock like TSLA (daily timeframe):
The 50 SMA is a gray line tracking the average trend.
Assuming an ADR% of 3%:
At +4 ADR% (12%), a blue line appears at sma50 * 1.12.
At -4 ADR% (-12%), a blue line appears at sma50 * 0.88.
Other lines appear at ±7, ±8, ±9, ±10, ±11, ±12, ±13 ADR%.
On the last bar, labels show "4 ADR%", "-4 ADR%", etc., and a gray label shows "ADR%: 3.00%".
ADR% is visible in the status line as an orange histogram.
9. Code: Technical Structure
Language: Pine Script @version=5.
Inputs: Three configurable parameters (smaLength, adrLength, scaleFactor).
Calculations:
SMA: ta.sma(close, smaLength).
ADR%: 100 * (ta.sma(dhigh / dlow, adrLength) - 1) * scaleFactor.
Levels: sma50 * (1 ± (level * adrPercent / 100)).
Graphics:
Lines: Created with line.new, deleted with line.delete to avoid overlaps.
Labels: Created with label.new only on the last bar.
Plots: plot(sma50) for the SMA, plot(adrPercent) for debugging.
Optimization: Uses dedicated variables for each line (e.g., upperLine1, lowerLine1) for clear management and to respect TradingView’s graphical object limits.
10. Possible Improvements
Option to show lines only on the last bar: Would reduce visual clutter.
Customizable line styles: Allow users to choose color or style (e.g., dashed).
Alert for anomalous ADR%: A message if ADR% is too small or large.
Dynamic levels: Allow users to specify ADR% multiples via input.
Optimization for short timeframes: Adapt ADR% for intraday timeframes.
Conclusion
The script creates a visual indicator that helps traders identify price extension levels based on daily volatility (ADR%) relative to the 50 SMA. It is robust, configurable, and includes debugging tools (ADR% plot and labels) to verify values. The ADR% formula based on dhigh/dlow

300-Candle Weighted Average Zones w/50 EMA SignalsThis indicator is designed to deliver a more nuanced view of price dynamics by combining a custom, weighted price average with a volatility-based zone and a trend filter (in this case, a 50-period exponential moving average). The core concept revolves around capturing the overall price level over a relatively large lookback window (300 candles) but with an intentional bias toward recent market activity (the most recent 20 candles), thereby offering a balance between long-term context and short-term responsiveness. By smoothing this weighted average and establishing a “zone” of standard deviation bands around it, the indicator provides a refined visualization of both average price and its recent volatility envelope. Traders can then look for confluence with a standard trend filter, such as the 50 EMA, to identify meaningful crossover signals that may represent trend shifts or opportunities for entry and exit.
What the Indicator Does:
Weighted Price Average:
Instead of using a simple or exponential moving average, this indicator calculates a custom weighted average price over the past 300 candles. Most historical candles receive a base weight of 1.0, but the most recent 20 candles are assigned a higher weight (for example, a weight of 2.0). This weighting scheme ensures that the calculation is not simply a static lookback average; it actively emphasizes current market conditions. The effect is to generate an average line that is more sensitive to the most recent price swings while still maintaining the historical context of the previous 280 candles.
Smoothing of the Weighted Average:
Once the raw weighted average is computed, an exponential smoothing function (EMA) is applied to reduce noise and produce a cleaner, more stable average line. This smoothing helps traders avoid reacting prematurely to minor price fluctuations. By stabilizing the average line, traders can more confidently identify actual shifts in market direction.
Volatility Zone via Standard Deviation Bands:
To contextualize how far price can deviate from this weighted average, the indicator uses standard deviation. Standard deviation is a statistical measure of volatility—how spread out the price values are around the mean. By adding and subtracting one standard deviation from the smoothed weighted average, the indicator plots an upper band and a lower band, creating a zone or channel. The area between these bands is filled, often with a semi-transparent color, highlighting a volatility corridor within which price and the EMA might oscillate.
This zone is invaluable in visualizing “normal” price behavior. When the 50 EMA line and the weighted average line are both within this volatility zone, it indicates that the market’s short- to mid-term trend and its average pricing are aligned well within typical volatility bounds.
Incorporation of a 50-Period EMA:
The inclusion of a commonly used trend filter, the 50 EMA, adds another layer of context to the analysis. The 50 EMA, being a widely recognized moving average length, is often considered a baseline for intermediate trend bias. It reacts faster than a long-term average (like a 200 EMA) but is still stable enough to filter out the market “chop” seen in very short-term averages.
By overlaying the 50 EMA on this custom weighted average and the surrounding volatility zone, the trader gains a dual-dimensional perspective:
Trend Direction: If the 50 EMA is generally above the weighted average, the short-term trend is gaining bullish momentum; if it’s below, the short-term trend has a bearish tilt.
Volatility Normalization: The bands, constructed from standard deviations, provide a sense of whether the price and the 50 EMA are operating within a statistically “normal” range. If the EMA crosses the weighted average within this zone, it signals a potential trend initiation or meaningful shift, as opposed to a random price spike outside normal volatility boundaries.
Why a Trader Would Want to Use This Indicator:
Contextualized Price Level:
Standard MAs may not fully incorporate the most recent price dynamics in a large lookback window. By weighting the most recent candles more heavily, this indicator ensures that the trader is always anchored to what the market is currently doing, not just what it did 100 or 200 candles ago.
Reduced Whipsaw with Smoothing:
The smoothed weighted average line reduces noise, helping traders filter out inconsequential price movements. This makes it easier to spot genuine changes in trend or sentiment.
Visual Volatility Gauge:
The standard deviation bands create a visual representation of “normal” price movement. Traders can quickly assess if a breakout or breakdown is statistically significant or just another oscillation within the expected volatility range.
Clear Trade Signals with Confirmation:
By integrating the 50 EMA and designing signals that trigger only when the 50 EMA crosses above or below the weighted average while inside the zone, the indicator provides a refined entry/exit criterion. This avoids chasing breakouts that occur in abnormal volatility conditions and focuses on those crossovers likely to have staying power.
How to Use It in an Example Strategy:
Imagine you are a swing trader looking to identify medium-term trend changes. You apply this indicator to a chart of a popular currency pair or a leading tech stock. Over the past few days, the 50 EMA has been meandering around the weighted average line, both confined within the standard deviation zone.
Bullish Example:
Suddenly, the 50 EMA crosses decisively above the weighted average line while both are still hovering within the volatility zone. This might be your cue: you interpret this crossover as the 50 EMA acknowledging the recent upward shift in price dynamics that the weighted average has highlighted. Since it occurred inside the normal volatility range, it’s less likely to be a head-fake. You place a long position, setting an initial stop just below the lower band to protect against volatility.
If the price continues to rise and the EMA stays above the average, you have confirmation to hold the trade. As the price moves higher, the weighted average may follow, reinforcing your bullish stance.
Bearish Example:
On the flip side, if the 50 EMA crosses below the weighted average line within the zone, it suggests a subtle but meaningful change in trend direction to the downside. You might short the asset, placing your protective stop just above the upper band, expecting that the statistically “normal” level of volatility will contain the price action. If the price does break above those bands later, it’s a sign your trade may not work out as planned.
Other Indicators for Confluence:
To strengthen the reliability of the signals generated by this weighted average zone approach, traders may want to combine it with other technical studies:
Volume Indicators (e.g., Volume Profile, OBV):
Confirm that the trend crossover inside the volatility zone is supported by volume. For instance, an uptrend crossover combined with increasing On-Balance Volume (OBV) or volume spikes on up candles signals stronger buying pressure behind the price action.
Momentum Oscillators (e.g., RSI, Stochastics):
Before taking a crossover signal, check if the RSI is above 50 and rising for bullish entries, or if the Stochastics have turned down from overbought levels for bearish entries. Momentum confirmation can help ensure that the trend change is not just an isolated random event.
Market Structure Tools (e.g., Pivot Points, Swing High/Low Analysis):
Identify if the crossover event coincides with a break of a previous pivot high or low. A bullish crossover inside the zone aligned with a break above a recent swing high adds further strength to your conviction. Conversely, a bearish crossover confirmed by a breakdown below a previous swing low can make a short trade setup more compelling.
Volume-Weighted Average Price (VWAP):
Comparing where the weighted average zone lies relative to VWAP can provide institutional insight. If the bullish crossover happens while the price is also holding above VWAP, it can mean that the average participant in the market is in profit and that the trend is likely supported by strong hands.
This indicator serves as a tool to balance long-term perspective, short-term adaptability, and volatility normalization. It can be a valuable addition to a trader’s toolkit, offering enhanced clarity and precision in detecting meaningful shifts in trend, especially when combined with other technical indicators and robust risk management principles.

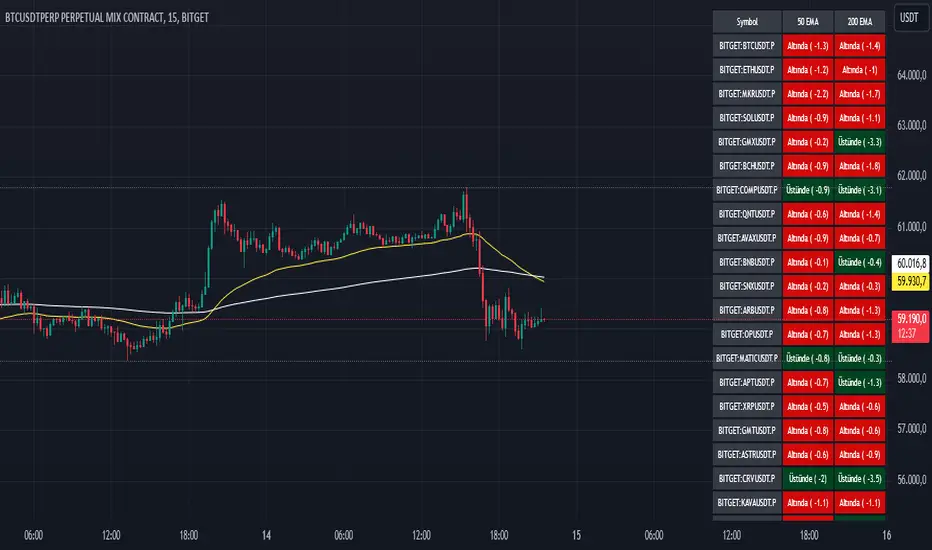
EMA 50 200 Multi-Scanner
EMA 50 200 Multi-Scanner: İndikatör Açıklaması ve Kullanım Kılavuzu
"EMA 50 200 Multi-Scanner" indikatörü, birden fazla kripto para çiftini farklı zaman dilimlerinde tarayan güçlü bir teknik analiz aracıdır. Bu indikatör, 50 periyotluk ve 200 periyotluk Üssel Hareketli Ortalamalar (EMA) arasındaki ilişkiyi analiz ederek, çeşitli zaman dilimlerinde potansiyel alım ve satım fırsatlarını tespit etmenizi sağlar. Hem kısa vadeli trendleri hem de uzun vadeli trendleri gözlemleyerek, piyasa koşullarına uygun stratejiler geliştirmenize yardımcı olur.
Ne İşe Yarar?
Trend Yönünü Belirleme: İndikatör, seçtiğiniz kripto para çiftlerinin her birinde 50 EMA ve 200 EMA arasındaki ilişkiyi analiz eder. Bu analiz, hem kısa vadeli hem de uzun vadeli trendlerin yönünü belirlemenize olanak tanır.
Zaman Dilimleri Arası Analiz: Farklı zaman dilimlerinde çalışabilen bu indikatör, günlük, saatlik, dakikalık gibi çeşitli periyotlarda trendleri ve fiyat hareketlerini incelemenizi sağlar. Bu, hem kısa vadeli ticaret fırsatlarını yakalamak hem de uzun vadeli yatırım kararlarını desteklemek için idealdir.
Alım/Satım Sinyalleri: İndikatör, fiyatın 50 EMA ve 200 EMA ile olan ilişkisini temel alarak alım ve satım sinyalleri üretir. Bu sinyaller, piyasa trendlerinden yararlanarak pozisyon açma veya kapama kararlarınızı destekler.
Dinamik Destek ve Direnç Seviyeleri: EMA seviyeleri, aynı zamanda dinamik destek ve direnç seviyeleri olarak kullanılabilir. Fiyatın bu seviyelere yaklaşması, potansiyel geri dönüş noktalarını veya trendin devamını işaret edebilir.
Nasıl Kullanılır?
İndikatör Ayarları:
EMA Uzunlukları: İhtiyacınıza göre 50 EMA ve 200 EMA'nın periyot uzunluklarını ayarlayabilirsiniz.
Renkler: EMA çizgilerinin rengini tercihinize göre özelleştirebilirsiniz.
Negatif Değerleri Gösterme: Fiyatın EMA seviyelerinin altında olduğu durumlarda negatif değerleri görmek isterseniz, bu özelliği aktif hale getirebilirsiniz.
Semboller: İndikatör, önceden tanımlanmış kripto para çiftleri üzerinde çalışır. Her bir sembol, seçtiğiniz zaman diliminde taranır ve sonuçlar gösterilir. Gereksinimlerinize göre bu sembolleri seçebilir veya çıkarabilirsiniz.
Zaman Dilimleri: İndikatör, TradingView platformundaki tüm zaman dilimlerinde çalışır. Bu, hem kısa vadeli hem de uzun vadeli yatırımcılar için esnek bir analiz olanağı sunar.
Al/Sat Sinyalleri:
Alım Sinyali: 50 EMA, 200 EMA'yı yukarı yönde kestiğinde ve fiyat bu kesişimin üzerinde olduğunda yeşil bir "BUY" etiketi ile gösterilir.
Satım Sinyali: 50 EMA, 200 EMA'yı aşağı yönde kestiğinde ve fiyat bu kesişimin altında olduğunda kırmızı bir "SELL" etiketi ile gösterilir.
"EMA 50 200 Multi-Scanner," çoklu zaman dilimlerinde ve kripto para çiftlerinde trend takibi yapmak isteyen yatırımcılar için etkili ve kullanımı kolay bir araçtır. Piyasa koşullarını daha iyi anlamak ve ticaret stratejilerinizi optimize etmek için bu indikatörü kullanabilirsiniz.
-------------
The "EMA 50 200 Multi-Scanner" is a powerful technical analysis tool designed to scan multiple cryptocurrency pairs across different timeframes. This indicator analyzes the relationship between the 50-period and 200-period Exponential Moving Averages (EMA) to help you identify potential buying and selling opportunities across various timeframes. It enables you to observe both short-term and long-term trends, aiding in the development of market-appropriate strategies.
Purpose
Trend Direction Identification: The indicator analyzes the relationship between the 50 EMA and 200 EMA for each selected cryptocurrency pair, allowing you to determine the direction of both short-term and long-term trends.
Multi-Timeframe Analysis: This indicator can operate across different timeframes, such as daily, hourly, and minute-based periods, allowing you to examine trends and price movements in multiple contexts. It is ideal for capturing short-term trading opportunities and supporting long-term investment decisions.
Buy/Sell Signals: The indicator generates buy and sell signals based on the relationship between the price and the 50 EMA and 200 EMA. These signals support your decision-making process by highlighting opportunities to open or close positions based on market trends.
Dynamic Support and Resistance Levels: The EMA levels can also serve as dynamic support and resistance levels. When the price approaches these levels, it can indicate potential reversal points or trend continuations.
How to Use
Indicator Settings:
EMA Lengths: Adjust the period lengths of the 50 EMA and 200 EMA to suit your needs.
Colors: Customize the colors of the EMA lines according to your preferences.
Show Negative Values: If you want to see negative values when the price is below the EMA levels, you can enable this feature.
Symbols: The indicator works on predefined cryptocurrency pairs. Each symbol is scanned within the selected timeframe, and results are displayed. You can select or deselect symbols according to your requirements.
Timeframes: The indicator functions across all timeframes available on the TradingView platform, offering flexible analysis for both short-term and long-term traders.
Buy/Sell Signals:
Buy Signal: A green "BUY" label is shown when the 50 EMA crosses above the 200 EMA and the price is above this crossover.
Sell Signal: A red "SELL" label is shown when the 50 EMA crosses below the 200 EMA and the price is below this crossover.
The "EMA 50 200 Multi-Scanner" is an effective and user-friendly tool for traders looking to track trends across multiple timeframes and cryptocurrency pairs. You can use this indicator to gain a better understanding of market conditions and optimize your trading strategies.