Recent Session High Low Marker - SimpleDescription:
This Pine Script marks the high and low points of the most recent trading sessions: Asian, London, and New York.
Asian Session: From 19:00 to 21:00 New York time (UTC-4).
London Session: From 02:00 to 05:00 New York time (UTC-4).
New York Session: From 07:00 to 10:00 New York time (UTC-4).
For each session, the script draws two lines:
One for the high of the session.
One for the low of the session.
The lines are drawn horizontally across the chart, making them easy to spot. Each session is marked by two lines with specific colors:
Orange for the Asian session.
Blue for the London session.
Purple for the New York session.
The lines are dynamically updated during the active session, and they will reset when the next session begins. The width of the lines is set to 2 to ensure they are visible without being too thick.
Credits:
Script created by Jdv.
"纳斯达克指数期货cfd"に関するスクリプトを検索

SMC ICT – Simplified Daily Trend & Reversal AnalyzerThis Pine Script provides a simplified approach to analyzing daily trends and potential reversals using concepts inspired by Smart Money Concepts (SMC) and ICT (Inner Circle Trader).
What It Does:
• Detects daily uptrend and downtrend conditions by comparing the current daily high/low to the previous day’s values.
• Highlights potential bullish or bearish reversal zones when price behavior suggests a shift in sentiment.
• Automatically draws dashed lines for the previous day's high and low.
• Labels these high/low levels for quick visual reference.
How to Use:
Apply this indicator to any timeframe chart. Use the plotted trend markers to assess daily direction and potential reversal signals. The dashed lines (previous high/low) can be used as reference points for liquidity zones or break/retest entries.
User Interface:
The indicator displays labels and shapes in English. This script is intended for educational and trading workflow enhancement purposes.
Note:
This is an open-source tool designed for clarity and basic SMC/ICT application. It is best used in combination with other confluences like FVGs, order blocks, and liquidity sweeps.

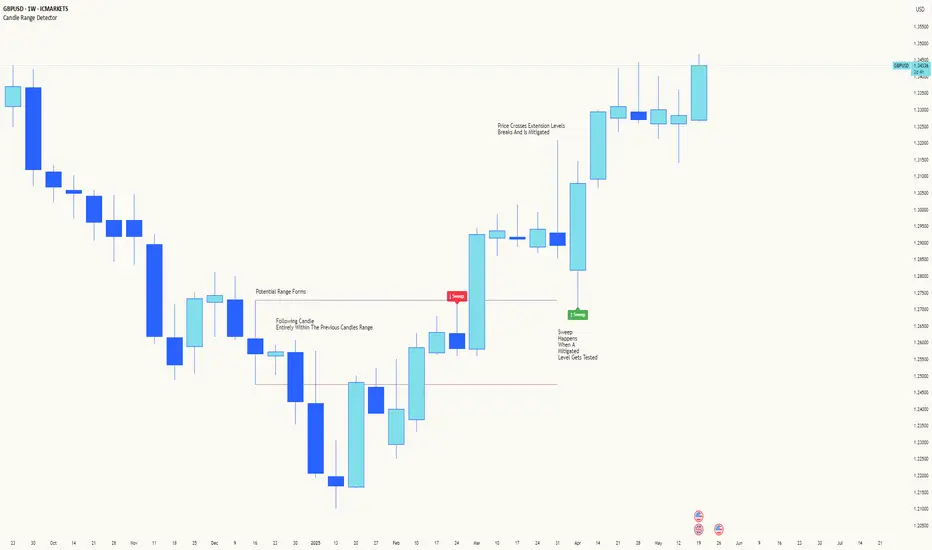
Candle Range DetectorCandle Range Detector
// Pine Script v6
// Detects candle-based ranges, mitigations, and sweeps with advanced logic
Overview
This indicator automatically detects price ranges based on candle containment, then tracks when those ranges are mitigated (broken) and when a sweep occurs. It is designed for traders who want to identify liquidity events and range breaks with precision.
How It Works
- Range Detection: A range is formed when a candle is fully contained within the previous candle (its high is lower and its low is higher). This marks a potential area of price balance or liquidity.
- Mitigation: A range is considered mitigated when price closes beyond its extension levels (configurable by normal or Fibonacci logic). This signals that the range has been invalidated or "taken out" by price action.
- Sweep Detection: After mitigation, the script watches for a sweep event: a candle that both trades through the range extreme and closes decisively beyond the log-mid of the candle itself. This is a strong sign of a liquidity grab or stop run.
- Alerts & Visuals: You can enable alerts and on-chart labels for sweeps. Only the most recent mitigated range can be swept, and each range can only be swept once.
- Timeframe Sensitivity: On weekly or monthly charts, a candle can both mitigate and sweep a range on the same bar. On lower timeframes, only one event can occur per bar.
Why It Works
- Candle containment is a robust way to identify natural price ranges and liquidity pools, as it reflects where price is consolidating or being absorbed.
- Mitigation marks the moment when a range is no longer defended, often leading to new directional moves.
- Sweeps are powerful signals of stop hunts or liquidity grabs, especially when confirmed by a close beyond the log-mid of the candle, indicating strong intent.
Visual Explanation
Tip: Use this tool to spot high-probability reversal or continuation zones, and to get alerted to key liquidity events in real time.
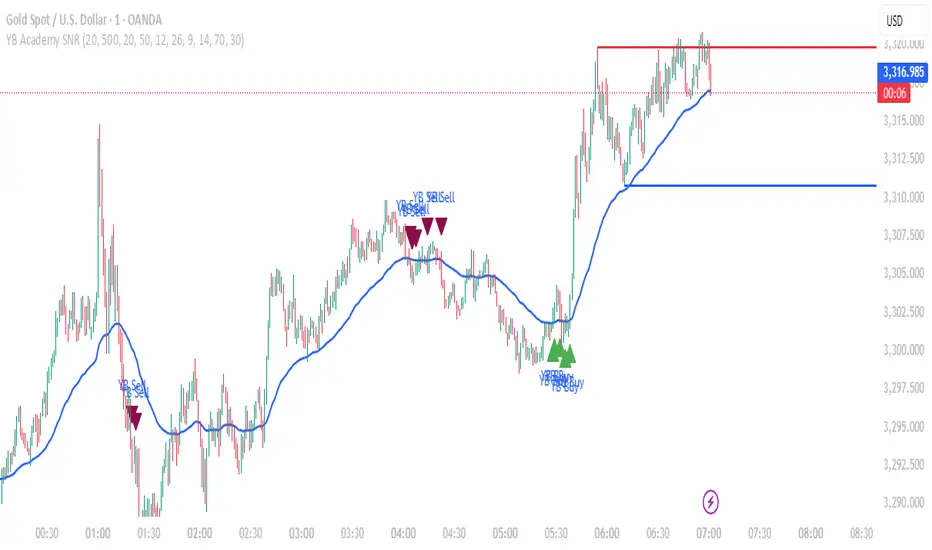
YB Academy SNRThe YB Academy SNR indicator is a complete swing-based Support & Resistance mapping tool with powerful built-in entry/exit signals. Designed for traders who want to identify high-probability reaction zones and get real-time alerts for the best buy and sell opportunities, this script helps you trade with structure, confidence, and discipline—on any time frame.
How It Works
1. Automatic Support & Resistance Detection
The indicator automatically scans for major swing highs and swing lows on your chart using a sensitivity parameter.
Every time a new swing high/low forms, a horizontal SNR line is drawn at that price level.
Both support and resistance lines automatically extend to the right of your chart, providing a persistent map of key levels for future entries and exits.
You can control how many recent zones are shown (max_snrs), keeping your chart clean and focused.
2. Smart Buy/Sell Signal Generation
Buy signals (“YB Buy”): Trigger when price touches or bounces off a support line, with trend/momentum/freshness filters:
Price is above the EMA50 (trend filter)
MACD is bullish (momentum)
RSI confirms no overbought
Sell signals (“YB Sell”): Trigger when price hits resistance, with strict confirmation:
Price is below EMA50
MACD is bearish
RSI not oversold
Both signals are shown as clear up/down triangle arrows directly on your chart.
3. Powerful Alerts
Never miss a trade: Real-time alerts fire as soon as a valid buy or sell condition appears.
Use with TradingView app, web, or SMS for 24/7 notification—no chart-watching needed.
4. Fully Customizable
Change sensitivity for tighter/looser SNR mapping.
Control the look and feel: colors for SNR, signals, number of zones, extension distance.
Works on any market: gold, forex, indices, crypto, stocks.
5. Clean Visuals, Zero Clutter
SNR lines are automatically managed—older zones are removed as new ones appear.
Only the latest/best buy/sell signals are shown, so you can act quickly and decisively.
Perfect For:
Scalpers, Day Traders, Swing Traders
Anyone who wants to trade using clean price action levels, NOT lagging indicators
Traders looking for rule-based, mechanical entries and exits
What Makes This Unique?
Precision: Uses swing structure, not arbitrary pivots or moving averages, for SNR.
Multi-Filter Entries: Combines trend, momentum, and overbought/oversold logic for high-probability signals.
Alerts & Automation: Built-in, with no need for manual chart watching.
Simple to Use: Add to any TradingView chart, adjust settings, and go.
Upgrade your trading with the YB Academy SNR!
Get alerted to the real opportunities—right at the key price zones, with all the discipline of a professional.
ATR Overlay with Trailing Flip [ask2maniish]📘 ATR Overlay with Trailing Flip
🔍 Overview
The ATR Overlay with Trailing Flip is a dynamic, visually-enhanced overlay indicator designed to assist traders in trend detection, trailing stop management, and volatility-based decision making. It leverages the Average True Range (ATR) with optional dynamic multipliers, filters, and alerts to enhance trade execution precision.
⚙️ Features Summary
✅ Static & dynamic ATR multiplier
✅ Customizable trailing stop logic
✅ Volume & Bollinger Band filters
✅ Buy/Sell label signals with alerts
✅ ATR bands with color fill
✅ Optional candle coloring based on trend
✅ Table showing current ATR multiplier
✅ Fully customizable visual controls
🔧 User Inputs
📘 Info Panel
ATR Usage Guide
Tooltip with trading-style recommendations:
Scalping: ATR 5–10, Intraday: ATR 10–14 , Swing: ATR 14–21 , Position: ATR 21–50
📊 Visual Elements
📈 Plots
Upper/Lower ATR Bands
ATR Fill Zone
Dynamic Trailing Stop Line
🕯 Candle Coloring
Candles colored green (uptrend) or red (downtrend)
Wick coloring matches body
🏷 Signal Labels
"BUY" below candle when trend flips up
"SELL" above candle when trend flips down
📊 Table (Top Right)
Displays current multiplier value:
If static: Static: x.x
If dynamic: percentage format based on ATR ratio
🔔 Alerts
Two alert conditions:
Flip to Long → "📈 ATR flip to LONG"
Flip to Short → "📉 ATR flip to SHORT"
Sound can be enabled for real-time feedback.
🧠 Best Practices
Combine this tool with support/resistance or order flow indicators
Use dynamic ATR during volatile periods for better adaptability
Filter signals in ranging markets with BBand Width Filter
For scalping, reduce ATR period and multiplier for tighter risk
🛠️ Customization Tips
Adjust trailingPeriod for tighter/looser stops
Use color inputs to match your charting theme
Disable features (labels/fill) to declutter chart

Buy sell ATR Bollinger [vivekm8955]Buy Sell ATR Bollinger
This script combines Bollinger Bands with an optional ATR-based filter to generate high-probability Buy/Sell signals with trend confirmation.
🔹 Buy Signal: Price breaks above the upper Bollinger Band and trend flips bullish.
🔹 Sell Signal: Price drops below the lower Bollinger Band and trend flips bearish.
🔹 ATR Filter (Optional): Smoothens signals by filtering out weak breakouts based on volatility.
🔹 Visual Aids: Color-coded trend bands (Yellow for bullish, Red for bearish) with clean BUY/SELL labels.
🔹 Alerts Enabled: Get notified on signal generation.
✅ Suitable for intraday and swing traders
✅ Works across all timeframes
✅ Fully customizable inputs
trade safe with risk management! Happy trading!!

Volume-Weighted Price MovementThe Volume-Weighted Price Movement (VWPM) indicator is an easy to read technical analysis tool that analyses how volume and price movement work together to drive market momentum.
How It Works
The VWPM indicator tracks two primary components:
Bullish Movement (green line): Measures the upward price movement weighted by volume. When price closes above the open, this component calculates how much buying pressure exists by multiplying the price change (close - open) by the volume of that period.
Bearish Movement (red line): Measures the downward price movement weighted by volume. When price closes below the open, this component calculates how much selling pressure exists by multiplying the price change (open - close) by the volume of that period.
Bull-Bear Difference (lime/orange line): Shows the net momentum by subtracting bearish movement from bullish movement, providing an at-a-glance view of which force is dominant.
The VWPM integrates volume data to identify whether price movements are backed by significant participation. A large price move with low volume carries less weight than the same move with high volume, providing a more accurate reflection of market strength.
A shorter lookback period makes the indicator more responsive to recent price action, while a longer period smooths out market noise for trend identification.
Interpretation
Bullish Signals
When the green line (bull movement) rises and stays above the red line
When the Bull-Bear Difference line crosses above zero and maintains positive momentum
Divergence between price making lower lows but the bull line making higher lows (hidden strength)
Bearish Signals
When the red line (bear movement) rises and stays above the green line
When the Bull-Bear Difference line crosses below zero and maintains negative momentum
Divergence between price making higher highs but the bull line making lower highs (hidden weakness)
open source, if anyone makes the script better please let me know :)

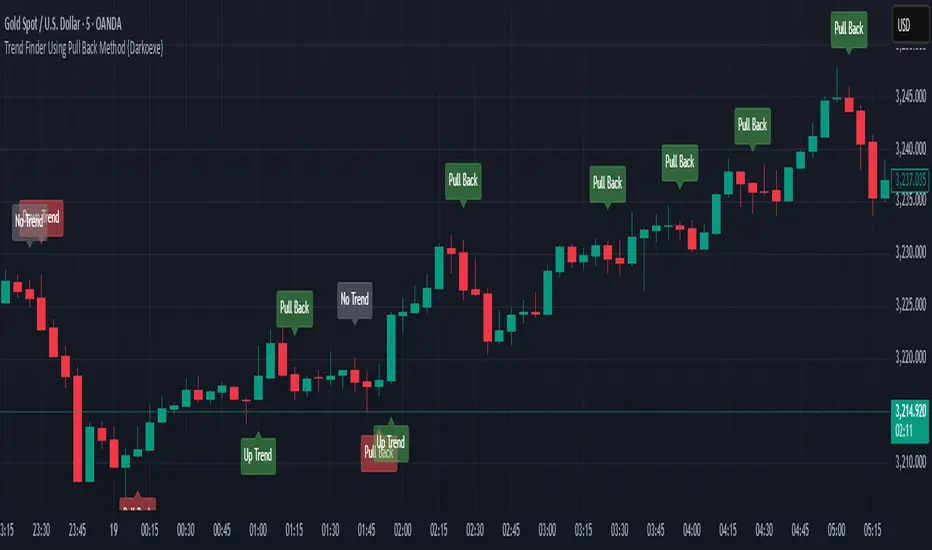
Trend Finder Using Pull Back Method {Darkoexe}This indicator predicts trends using pull backs structure to predict the trend direction. It builds off the flag pattern concept but it uses precise precise measurements to determine trend direction.
A pull back occurs every time the price direction switches then closes either below or above the open of the previous candle depending on the type of pull back, bullish or bearish.
For an up trend to be a defined, when a bullish pull back occurs and does not go below the previous low, if the price then passes above the start of the pull back, an up trend signal will be printed. Only bullish pull backs will be displayed during an up trend.
For a down trend to be defined, when a bearish pull back occurs and does not go above the previous high, if the price then passes below the start of the pull back, a down trend signal will be printed. Only bearish pull backs will be displayed during a down trend.
If the conditions for an up trend or down trend are not met, no trend will be printed. Both bearish and bullish pull backs will be displayed during a no trend.
All the labels colors can be changed.
//Darkoexe
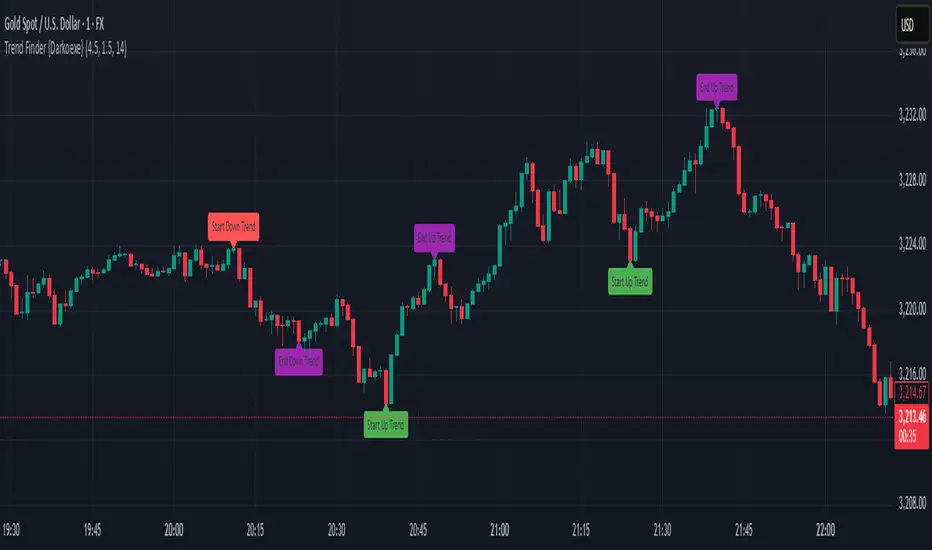
Trend Finder {Darkoexe}This indicator displays the end and start of trends using an ATR factor.
The ATR with trend factor is used to determine the minimum length for a trend to be considered a trend.
The ATR against trend factor is used to determine the minimum length price needs to move against a trend for it to break the trend.
The ATR factors are multiplied with the ATR to determine these lengths.
The labels indicate the starts and ends of trends;
The green label indicates the start of an up trend.
The red label indicates the start of a down trend.
The black/gray label indicates the start of a trend and the end of another trend at the same location.
The purple/pink label indicates the end of a trend.
All the label colors can be changed.
IMPORTANT NOTE: This is a repainting indicator, it should only be used to back test and analyze previous trends. Do not use this indicator for live trading.
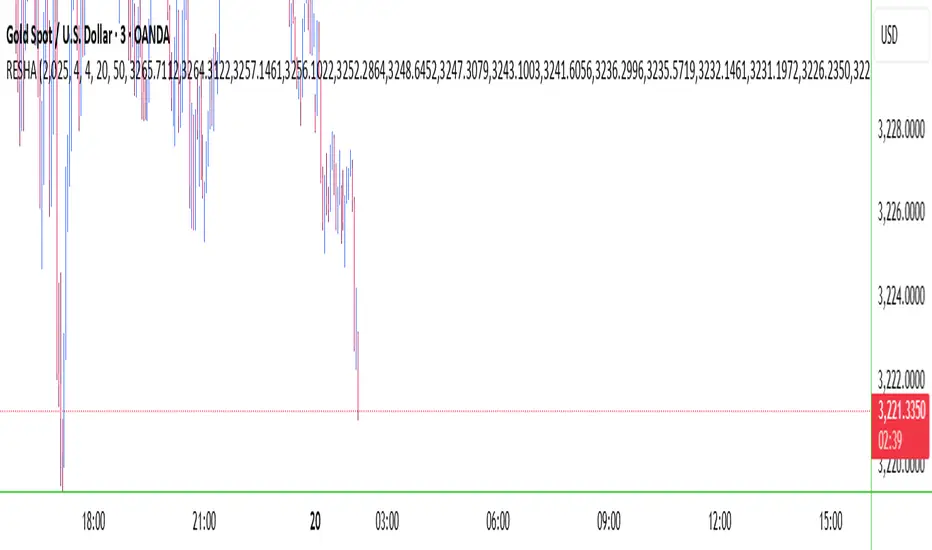
RESHAIndicator Name: RESHA – Static Price Levels
Description:
The RESHA indicator is a simple tool that allows traders to manually define multiple horizontal price levels on the chart. These levels are displayed as horizontal lines, each extending a customizable number of candles forward. Traders can input a comma-separated list of prices, which are then plotted automatically on the chart.
Features:
📍 Custom input box for price levels (comma-separated).
📏 Adjustable line length in bars.
Visual price labels at the end of each level.
Clean and minimalistic design, perfect for support/resistance zones or static analysis.
This tool is ideal for traders who want to keep key price zones visible at all times without relying on dynamic calculations or automated indicators.
Risk Calculator PRO — manual lot size + auto lot-suggestionWhy risk management?
90 % of traders blow up because they size positions emotionally. This tool forces Risk-First Thinking: choose the amount you’re willing to lose, and the script reverse-engineers everything else.
Key features
1. Manual or Market Entry – click “Use current price” or type a custom entry.
2. Setup-based ₹-Risk – four presets (A/B/C/D). Edit to your workflow.
3. Lot-Size Input + Auto Lot Suggestion – you tell the contract size ⇒ script tells you how many lots.
4. Auto-SL (optional) – tick to push stop-loss to exactly 1-lot risk.
5. Instant Targets – 1 : 2, 1 : 3, 1 : 4, 1 : 5 plotted and alert-ready.
6. P&L Preview – table shows potential profit at each R-multiple plus real ₹ at SL.
7. Margin Column – enter per-lot margin once; script totals it for any size.
8. Clean Table UI – dark/light friendly; updates every 5 bars.
9. Alert Pack – SL, each target, plus copy-paste journal line on the chart.
How to use
1. Add to chart > “Format”.
2. Type the lot size for the symbol (e.g., 1250 for Natural Gas, 1 for cash equity).
3. Pick Side (Buy / Sell) & Setup grade.
4. ✅ If you want the script to place SL for you, tick Auto-SL (risk = 1 lot).
5. Otherwise type your own Stop-loss.
6. Read the table:
• Suggested lots = how many to trade so risk ≤ setup ₹.
• Risk (currency) = real money lost if SL hits.
7. Set TradingView alerts on the built-in conditions (T1_2, SL_hit, etc.) if you’d like push / email.
8. Copy the orange CSV label to Excel / Sheets for journalling.
Best practices
• Never raise risk to “fit” a trade. Lower size instead.
• Review win-rate vs. R multiple monthly; adjust setups A–D accordingly.
• Test Auto-SL in replay before going live.
Disclaimer
This script is educational. Past performance ≠ future results. The author isn’t responsible for trading losses.

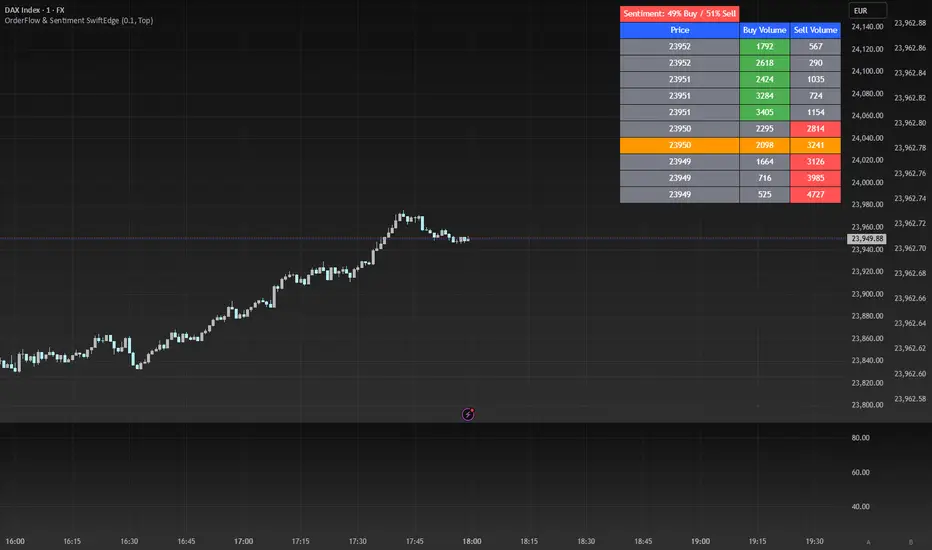
OrderFlow Sentiment SwiftEdgeOrderFlow Sentiment SwiftEdge
Overview
OrderFlow Sentiment SwiftEdge is a visual indicator designed to help traders analyze market dynamics through a simulated orderbook and market sentiment display. It breaks down the current candlestick into 10 price bins, estimating buy and sell volumes, and presents this data in an orderbook table alongside a sentiment row showing the buy vs. sell bias. This tool provides a quick and intuitive way to assess orderflow activity and market sentiment directly on your chart.
How It Works
The indicator consists of two main components: an Orderbook Table and a Market Sentiment Row.
Orderbook Table:
Simulates buy and sell volumes for the current candlestick by distributing total volume into 10 price bins based on price movement and proximity to open/close levels.
Displays the price bins in a table with columns for Price, Buy Volume, and Sell Volume, sorted from highest to lowest price.
Highlights the current price level in orange for easy identification, while buy and sell dominance is indicated with green (buy) or red (sell) backgrounds.
Market Sentiment Row:
Calculates the overall buy and sell sentiment (as a percentage) for the current candlestick based on the simulated orderflow data.
Displays the sentiment above the orderbook table, with the background colored green if buyers dominate or red if sellers dominate.
Features
Customizable Colors: Choose colors for buy (default: green), sell (default: red), and current price (default: orange) levels.
Lot Scaling Factor: Adjust the volume scaling factor (default: 0.1 lots per volume unit) to simulate realistic lot sizes.
Table Position: Select the table position on the chart (Top, Middle, or Bottom; default: Middle).
Default Properties
Positive Color: Green
Negative Color: Red
Current Price Color: Orange
Lot Scaling Factor: 0.1
Table Position: Middle
Usage
This indicator is ideal for traders who want to visualize orderflow dynamics and market sentiment in real-time. The orderbook table provides a snapshot of buy and sell activity at different price levels within the current candlestick, helping you identify areas of high buying or selling pressure. The sentiment row offers a quick overview of market bias, allowing you to gauge whether buyers or sellers are currently dominating. Use this information to complement your trading decisions, such as identifying potential breakout levels or confirming trend direction.
Limitations
This indicator simulates orderflow data based on candlestick price movement and volume, as TradingView does not provide tick-by-tick data. The volume distribution is an approximation and should be used as a visual aid rather than a definitive measure of market activity.
The indicator operates on the chart's current timeframe and does not incorporate higher timeframe data.
The simulated volumes are scaled using a user-defined lot scaling factor, which may not reflect actual market lot sizes.
Disclaimer
This indicator is for informational purposes only and does not guarantee trading results. Always conduct your own analysis and manage risk appropriately. The simulated orderflow data is an estimation and may not reflect real market conditions.
Enhanced Cycle IndicatorEnhanced Cycle Indicator Guide
DISCLAIMER
"This PineScript indicator evolved from a foundational algorithm designed to visualize cycle-based center average differentials. The original concept has been significantly enhanced and optimized through collaborative refinement with AI, resulting in improved functionality, performance, and visualization capabilities while maintaining the core mathematical principles of the original design"
Overview
The Enhanced Cycle Indicator is designed to identify market cycles with minimal lag while ensuring the cycle lows and highs correspond closely with actual price bottoms and tops. This indicator transforms price data into observable cycles that help you identify when a market is likely to change direction.
Core Principles
Cycle Detection: Identifies natural market rhythms using multiple timeframes
Dynamic Adaptation: Adjusts to changing market conditions for consistent performance
Precise Signals: Provides clear entry and exit points aligned with actual market turns
Reduced Lag: Uses advanced calculations to minimize delay in cycle identification
How To Use
1. Main Cycle Interpretation
Green Histogram Bars: Bullish cycle phase (upward momentum)
Red Histogram Bars: Bearish cycle phase (downward momentum)
Cycle Extremes: When the histogram reaches extreme values (+80/-80), the market is likely approaching a turning point
Zero Line: Crossovers often indicate a shift in the underlying market direction
2. Trading Signals
Green Triangle Up (bottom of chart): Strong bullish signal - ideal for entries or covering shorts
Red Triangle Down (top of chart): Strong bearish signal - ideal for exits or short entries
Diamond Shapes: Indicate divergence between price and cycle - early warning of potential reversals
Small Circles: Minor cycle turning points - useful for fine-tuning entries/exits
3. Optimal Signal Conditions
Bullish Signals Work Best When:
The cycle is deeply oversold (below -60)
RSI is below 40 or turning up
Price is near a significant low
Multiple confirmation bars have occurred
Bearish Signals Work Best When:
The cycle is heavily overbought (above +60)
RSI is above 60 or turning down
Price is near a significant high
Multiple confirmation bars have occurred
4. Parameter Adjustments
For Shorter Timeframes: Reduce cycle periods and smoothing factor for faster response
For Daily/Weekly Charts: Increase cycle periods and smoothing for smoother signals
For Volatile Markets: Reduce cycle responsiveness to filter noise
For Trending Markets: Increase signal confirmation requirement to avoid false signals
Recommended Settings
Default (All-Purpose)
Main Cycle: 50
Half Cycle: 25
Quarter Cycle: 12
Smoothing Factor: 0.5
RSI Filter: Enabled
Signal Confirmation: 2 bars
Faster Response (Day Trading)
Main Cycle: 30
Half Cycle: 15
Quarter Cycle: 8
Smoothing Factor: 0.3
Cycle Responsiveness: 1.2
Signal Confirmation: 1 bar
Smoother Signals (Swing Trading)
Main Cycle: 80
Half Cycle: 40
Quarter Cycle: 20
Smoothing Factor: 0.7
Cycle Responsiveness: 0.8
Signal Confirmation: 3 bars
Advanced Features
Adaptive Period
When enabled, the indicator automatically adjusts cycle periods based on recent price volatility. This is particularly useful in markets that alternate between trending and ranging behaviors.
Momentum Filter
Enhances cycle signals by incorporating price momentum, making signals more responsive during strong trends and less prone to whipsaws during consolidations.
RSI Filter
Adds an additional confirmation layer using RSI, helping to filter out lower-quality signals and improve overall accuracy.
Divergence Detection
Identifies situations where price makes a new high/low but the cycle doesn't confirm, often preceding significant market reversals.
Best Practices
Use the indicator in conjunction with support/resistance levels
Look for signal clusters across multiple timeframes
Reduce position size when signals appear far from cycle extremes
Pay special attention to signals that coincide with divergences
Customize cycle periods to match the natural rhythm of your traded instrument
Troubleshooting
Too Many Signals: Increase signal confirmation bars or reduce cycle responsiveness
Missing Major Turns: Decrease smoothing factor or increase cycle responsiveness
Signals Too Late: Decrease cycle periods and smoothing factor
False Signals: Enable RSI filter and increase signal confirmation requirement

High/Low Digit SumNAMAN SHAH
Its about the high low total of a candle only for gold where if highs total is 9 then its a chance that it will not break the high for a long time and it will be a good opportunity for short
And vise versa

Gold Breakout Strategy - RR 4Strategy Name: Gold Breakout Strategy - RR 4
🧠 Main Objective
This strategy aims to capitalize on breakouts from the Donchian Channel on Gold (XAU/USD) by filtering trades with:
Volume confirmation,
A custom momentum indicator (LWTI - Linear Weighted Trend Index),
And a specific trading session (8 PM to 8 AM Quebec time — GMT-5).
It takes only one trade per day, either a buy or a sell, using a fixed stop-loss at the wick of the breakout candle and a 4:1 reward-to-risk (RR) ratio.
📊 Indicators Used
Donchian Channel
Length: 96
Detects breakouts of recent highs or lows.
Volume
Simple Moving Average (SMA) over 30 bars.
A breakout is only valid if the current volume is above the SMA.
LWTI (Linear Weighted Trend Index)
Measures momentum using price differences over 25 bars, smoothed over 5.
Used to confirm trend direction:
Buy when LWTI > its smoothed version (uptrend).
Sell when LWTI < its smoothed version (downtrend).
⏰ Time Filter
The strategy only allows entries between 8 PM and 8 AM (GMT-5 / Quebec time).
A timestamp-based filter ensures the system recognizes the correct trading session even across midnight.
📌 Entry Conditions
🟢 Buy (Long)
Price breaks above the previous Donchian Channel high.
The current channel high is higher than the previous one.
Volume is above its moving average.
LWTI confirms an uptrend.
The time is within the trading session (20:00 to 08:00).
No trade has been taken yet today.
🔴 Sell (Short)
Price breaks below the previous Donchian Channel low.
The current channel low is lower than the previous one.
Volume is above its moving average.
LWTI confirms a downtrend.
The time is within the trading session.
No trade has been taken yet today.
💸 Trade Management
Stop-Loss (SL):
For long entries: placed below the wick low of the breakout candle.
For short entries: placed above the wick high of the breakout candle.
Take-Profit (TP):
Set at a fixed 4:1 reward-to-risk ratio.
Calculated as 4x the distance between the entry price and stop-loss.
No trailing stop, no break-even, no scaling in/out.
🎨 Visuals
Green triangle appears below the candle on a buy signal.
Red triangle appears above the candle on a sell signal.
Donchian Channel lines are plotted on the chart.
The strategy is designed for the 5-minute timeframe.
🔄 One Trade Per Day Rule
Once a trade is taken (buy or sell), no more trades will be executed for the rest of the day. This prevents overtrading and limits exposure.

CANX Gold (XAUUSD) $5 Psychological Levels© CanxStixTrader
FOR GOLD ONLY
--------------------------------
This is a vary simple yet powerful indicator based on the psychological levels that retail traders use to trade gold and institutions in turn target these levels.
--------------------------------
HOW TO USE
Once the trend has been determined then this simple indicator can be used to target the pull backs for the sniper entries you want.
-TIP, pair with other indicators for optimal entries and trend identification. We recommend the 1 minute time frame for entries and a momentum indicator for extra confirmation.
--------------------------------
The indicator draws lines every 50 pips or $5 on the chart and is customizable to your preference.
Like always, Keep it simple!
© CanxStixTrader
