EMA9/EMA20 + VolMA20 Alert//@version=5
indicator("EMA9/EMA20 + VolMA20 Alert", overlay=true)
ema9 = ta.ema(close, 9)
ema20 = ta.ema(close, 20)
volMa20 = ta.sma(volume, 20)
crossUp = ta.crossover(ema9, ema20)
volOK = volume > volMa20
signal = crossUp and volOK
plot(ema9, color=color.yellow, linewidth=2)
plot(ema20, color=color.blue, linewidth=2)
plotshape(signal, title="Signal", style=shape.triangleup, color=color.lime, size=size.small, location=location.belowbar)
alertcondition(signal, title="Pump Signal", message="EMA9 crossed EMA20 with strong volume (Vol>MA20)")
"纳斯达克期货cfd"に関するスクリプトを検索

Smart Money Concepts [Dau_tu_hieu_goc]Credits to LuxAlgo for the SMC Parts.
Edited by Dau_Tu_Hieu_Goc

Vital Wave 20-50Simplicity is almost always the most effective approach, and here I’m giving you a trend-following system that exploits the bullish bias of traditional markets and their trending nature, with very basic rules.
Rules (long entries only)
• Market entry: When the EMA 20 crosses above the EMA 50 (from below)
• Main market exit: When the EMA 20 crosses below the EMA 50 (from above)
• Fixed Stop Loss: Placed at the price level of the Lower Bollinger Band at the moment the trade is entered.
In my strategy, the primary exit is when the EMA 20 crosses below the EMA 50. However, this crossover can sometimes take a while to occur, and in the meantime the price may have already dropped significantly. The Stop Loss based on the Lower Bollinger Band is designed to limit losses in case the market moves sharply against the position without giving the bearish crossover signal in time. Having two exit conditions makes the strategy much more robust in terms of risk management.
Risk Management:
• Initial capital: $10,000
• Position size: 10% of available capital per trade
• Commissions: 0.1% on traded volume
• Stop Loss: Based on the Lower Bollinger Band
• Take Profit / Exit: When EMA 20 crosses below EMA 50
Recommended Markets:
XAUUSD (OANDA) (Daily)
Period: January 3, 1833 – November 23, 2025
Total Profit & Loss: +$6,030.62 USD (+57.57%)
Maximum Drawdown: $541.53 USD (3.83%)
Total Trades: 136
Winning Trades (Win Rate): 36.03% (49/136)
Profit Factor: 2.483
XAUUSD (OANDA) (12-hour)
Period: March 19, 2006 – November 23, 2025
Total Profit & Loss: +$1,209.56 USD (+11.89%)
Maximum Drawdown: $384.58 USD (3.61%)
Total Trades: 97
Winning Trades (Win Rate): 35.05% (34/97)
Profit Factor: 1.676
XAUUSD (OANDA) (8-hour)
Period: March 19, 2006 – November 23, 2025
Total Profit & Loss: +$1,179.36 USD (+11.81%)
Maximum Drawdown: $246.88 USD (2.32%)
Total Trades: 147
Winning Trades (Win Rate): 31.97% (47/147)
Profit Factor: 1.626
Tesla (NASDAQ) (4-hour)
Period: June 29, 2010 – November 23, 2025
Total Profit & Loss (Absolute): +$11,687.90 USD (+116.88%)
Maximum Drawdown: $922.05 USD (6.50%)
Total Trades: 68
Winning Trades (Win Rate): 39.71% (27/68)
Profit Factor: 4.156
Tesla (NASDAQ) (3-hour)
Total Profit & Loss: +$11,522.33 USD (+115.22%)
Maximum Drawdown: $1,247.60 USD (8.80%)
Total Trades: 114
Winning Trades: 33.33% (38/114)
Profit Factor: 2.811
Additional Recommendations
(These assets have shown good trending behavior with the same strategy across multiple timeframes):
• NVDA (15 min, 30 min, 1h, 2h, 3h, 4h, 6h, 8h, 12h, Daily)
• NFLX (1h, 2h, 3h, 4h, 6h, 8h, 12h, Daily)
• MA (1h, 2h, 3h, 4h, 6h, 8h, 12h, Daily)
• META (1h, 2h, 3h, 4h, 6h, 8h, 12h, Daily)
• AAPL (1h, 2h, 3h, 4h, 6h, 8h, 12h, Daily)
• SPY (12h, Daily)
About the Code
The user can modify:
• EMA periods (20 and 50 by default)
• Bollinger Bands length (20 periods)
• Standard deviation (2.0)
Visualization
• EMA 20: Blue line
• EMA 50: Red line
• Green background when EMA20 > EMA50 (bullish trend)
• Red background when EMA20 < EMA50 (bearish trend)
Important Note:
We can significantly increase the profit factor and overall profitability by risking a fixed percentage per trade instead of a fixed amount. This would prevent losses from fluctuating with changes in volatility.
This could be implemented by reducing position size or adjusting leverage based on the volatility percentage required for each trade, but I’m not sure if this is fully possible in Pine Script. In my other script, “ Golden Cross 50/200 EMA ,” I go deeper into this topic and provide examples.
I hope you enjoy this contribution. Best regards!

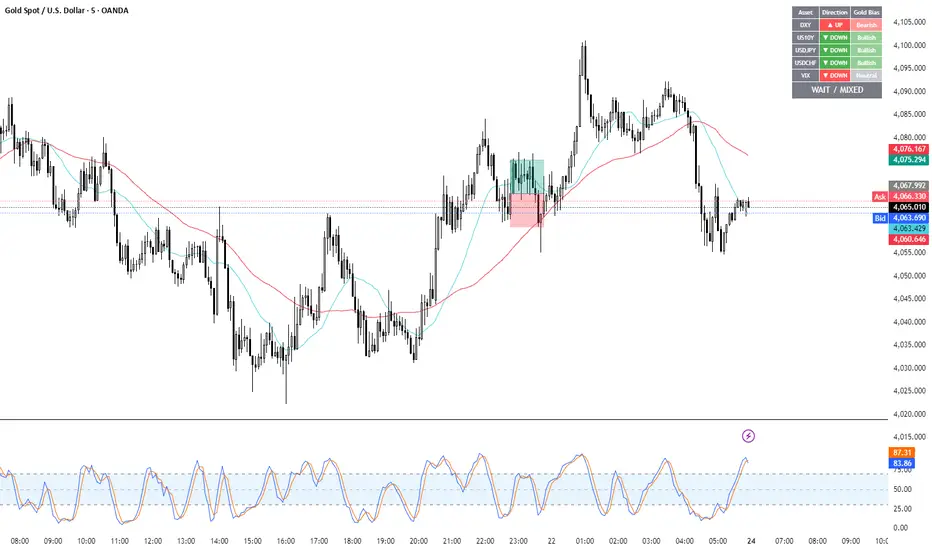
Gold Correlation Dashboard + Alerts [XAUUSD Helper]這是一個專為黃金 (XAUUSD) 交易者設計的 **跨市分析儀表板 (Intermarket Correlation Dashboard)**。
這個指標的核心邏輯基於基本面與資金流向,協助交易者在 10 秒內快速判斷黃金的當前趨勢。它自動監控與黃金高度負相關的資產(美元、美債、日圓),並在圖表上直接顯示多空傾向。
### 📊 監控資產與邏輯
本腳本即時抓取以下關鍵市場數據,並分析其對黃金的影響:
1. **DXY (美元指數)**:黃金最大競爭對手。
- DXY 跌 📉 → 黃金偏多
- DXY 漲 📈 → 黃金偏空
2. **US10Y (10年期美債殖利率)**:黃金的持有成本指標。
- 殖利率跌 📉 → 黃金偏多
- 殖利率漲 📈 → 黃金偏空
3. **USDJPY (美日)** & **USDCHF (美瑞)**:避險資金流向參考。
- 匯率跌 (日圓/瑞郎強) 📉 → 黃金偏多
4. **VIX (恐慌指數)**:市場情緒指標。
- VIX 飆升 📈 → 黃金通常受惠 (避險屬性)
### 🚀 主要功能
1. **即時儀表板**:無需切換視窗,直接在黃金圖表角落查看所有關鍵資產的漲跌狀態。
2. **智能信號總結**:
- 系統會自動計算 **DXY + US10Y + USDJPY** 的綜合方向。
- 當這三大核心指標方向一致時,系統會顯示 **★ STRONG BUY (強力做多)** 或 **★ STRONG SELL (強力做空)**。
- 根據歷史經驗,當這三者同步時,趨勢準確度極高。
3. **警報系統 (Alerts)**:
- 內建警報功能,當出現「強力做多」或「強力做空」信號時,可設定推播通知,不錯過進場機會。
### ⚙️ 如何使用
- 將此指標加載到 XAUUSD (黃金) 的圖表上。
- 建議搭配 H1, H4 或 Daily 時框使用。
- **綠色背景** = 利多黃金 (Bullish)
- **紅色背景** = 利空黃金 (Bearish)
---
*免責聲明:此腳本僅供輔助分析與教育用途,不構成任何投資建議。交易請做好風險控管。*
**Gold (XAUUSD) Intermarket Correlation Dashboard & Alerts**
This indicator is designed for Gold traders who want to combine Technical Analysis with **Fundamental Intermarket Analysis**. It provides a real-time dashboard overlay that monitors key assets highly correlated with XAUUSD.
According to market logic, Gold is heavily influenced by the US Dollar (DXY), US Treasury Yields (US10Y), and global risk sentiment (USDJPY/VIX). This script helps you spot the trend in seconds.
### 📊 Monitored Assets & Logic
The dashboard tracks the real-time direction of the following assets and calculates their impact on Gold:
1. **DXY (US Dollar Index)**: Inverse correlation.
* DXY ↓ = Bullish for Gold
* DXY ↑ = Bearish for Gold
2. **US10Y (US 10-Year Treasury Yield)**: Inverse correlation (Cost of Holding).
* Yields ↓ = Bullish for Gold
* Yields ↑ = Bearish for Gold
3. **USDJPY & USDCHF**: Risk sentiment and currency flow.
* Pair ↓ (Strong JPY/CHF) = Bullish for Gold
4. **VIX (Volatility Index)**: Fear gauge.
* VIX ↑ = Generally Bullish for Gold (Safe Haven demand)
### 🚀 Key Features
**1. Real-Time Dashboard**
View the status of all 5 key assets directly on your XAUUSD chart without switching tabs. The dashboard indicates the "Gold Bias" (Bullish/Bearish) for each asset based on the current timeframe.
**2. Smart Bias Signal ("The 3-Storyline Confirmation")**
The script automatically analyzes the three most critical indicators: **DXY, US10Y, and USDJPY**.
* **★ STRONG BUY ★**: When DXY, US10Y, and USDJPY are **ALL Falling** simultaneously. (High probability setup).
* **★ STRONG SELL ★**: When DXY, US10Y, and USDJPY are **ALL Rising** simultaneously.
**3. Integrated Alerts**
Never miss a setup. You can set alerts to notify you immediately when the "Strong Buy" or "Strong Sell" conditions are met.
### ⚙️ How to Use
1. Add this script to your XAUUSD chart.
2. Works best on H1, H4, or Daily timeframes.
3. Look for the **Summary Row** at the bottom of the dashboard:
* **Green (Strong Buy)**: Look for Long entries.
* **Red (Strong Sell)**: Look for Short entries.
---
*Disclaimer: This script is for educational and informational purposes only. It does not constitute financial advice. Always manage your risk.*
Candle Patterns Ver.2When someone decided to start trading the first thing we learn is how to read and understand the candlesticks. This little "boxes" with sticks tell us how the market sentiment and they can be used to "predict" future moves. I put predict inside a quotation marks because I would say predict the market is almost an utopia and we all know the reason.
Anyway with a good understand in reading the candlesticks with other indicators(like momentum or even a MA) can give us some edge when analyzing an instrument.
Since we have a lot of candlesticks types I did some back test and figured out that for my strategy that three candlestick types works very well. I will briefly describe then.
Engulfing Bar
This type of candlestick shows us a potential reversal based on the previous bar.
A bullish Engulfing has the close higher than the open it works better if the previous one is a bearish bar(open higher than close) and it is at a Support level. The body of the Engulfing bar should "engulf" the full body of the previous bar. If all parameters(previous bearish bar at Support level after a downtrend move) this Engulfing will represents a reversal move. When I say reversal it could means a pullback reversal(if the past trend is downtrend) or if the previous downtrend is a pullback from a past uptrend. In any way the previous bearish followed by an bullish Engulfing in general leads for an upward move.
The same picture applies to a previous bullish bar followed by an bearish Engulfing bar that if appears at the Resistance level will lead to a downward move.
One thing that is worth to mention is in a downward(or upward) move we have a small bullish bar followed by a bullish Engulfing this situation may lead to a continuation, not reversal.
Pinbar Bar:
This is another candlestick type that represents possible reversal. The Pinbar candle show a small(or medium) size but the important part is the size of the stick. If the stick is the upper one and has the size of 2 times the size of the body, it is a bearish bars and it appears after an uptrend move it represents that the buyers are losing momentum so we can expect a reversal move. When this type of bar appears after a downward move, it is a bullish bars but the stick is the lower one and has the size of two times of the body it will represents a bullish reversal. In this picture this candle is called a "Hammer".
So based on that I develop an indicator that shows me these 2 bars types and makes easy to identify with the other indicator possible entries.
Please feel free for a constructive comments and hope it help any one whe trading. Candlestick are the fundamentals of Price action.
You all have a great trading new week.

청산맵[by좐주노]//@version=5
indicator("청산맵 "
, overlay = true
, max_lines_count = 500
, max_labels_count = 500
, max_boxes_count = 500)
//------------------------------------------------------------------------------
//Settings
//-----------------------------------------------------------------------------{
length = input(14, '청산기간 기준 ')
area = input.string('꼬리기준', '측정 범위', options = )
intraPrecision = input(false, 'Intrabar Precision', inline = 'intrabar')
intrabarTf = input.timeframe('1', '' , inline = 'intrabar')
filterOptions = input.string('Count', 'Filter Areas By', options = , inline = 'filter')
filterValue = input.float(0, '' , inline = 'filter')
//Style
showTop = input(true, 'Swing High' , inline = 'top', group = 'Style')
topCss = input(color.red, '' , inline = 'top', group = 'Style')
topAreaCss = input(color.new(color.red, 50), 'Area', inline = 'top', group = 'Style')
showBtm = input(true, 'Swing Low' , inline = 'btm', group = 'Style')
btmCss = input(color.teal, '' , inline = 'btm', group = 'Style')
btmAreaCss = input(color.new(color.teal, 50), 'Area', inline = 'btm', group = 'Style')
labelSize = input.string('Tiny', 'Labels Size', options = , group = 'Style')
//-----------------------------------------------------------------------------}
//Functions
//-----------------------------------------------------------------------------{
n = bar_index
get_data()=>
= request.security_lower_tf(syminfo.tickerid, intrabarTf, get_data())
get_counts(condition, top, btm)=>
var count = 0
var vol = 0.
if condition
count := 0
vol := 0.
else
if intraPrecision
if n > length
if array.size(v ) > 0
for in v
vol += array.get(l , index) < top and array.get(h , index) > btm ? element : 0
else
vol += low < top and high > btm ? volume : 0
count += low < top and high > btm ? 1 : 0
set_label(count, vol, x, y, css, lbl_style)=>
var label lbl = na
var label_size = switch labelSize
'Tiny' => size.tiny
'Small' => size.small
'Normal' => size.normal
target = switch filterOptions
'Count' => count
'Volume' => vol
if ta.crossover(target, filterValue)
lbl := label.new(x, y, str.tostring(vol, format.volume)
, style = lbl_style
, size = label_size
, color = #00000000
, textcolor = css)
if target > filterValue
label.set_text(lbl, str.tostring(vol, format.volume))
set_level(condition, crossed, value, count, vol, css)=>
var line lvl = na
target = switch filterOptions
'Count' => count
'Volume' => vol
if condition
if target < filterValue
line.delete(lvl )
else if not crossed
line.set_x2(lvl, n - length)
lvl := line.new(n - length, value, n, value
, color = na)
if not crossed
line.set_x2(lvl, n+3)
if crossed and not crossed
line.set_x2(lvl, n)
line.set_style(lvl, line.style_dashed)
if target > filterValue
line.set_color(lvl, css)
set_zone(condition, x, top, btm, count, vol, css)=>
var box bx = na
target = switch filterOptions
'Count' => count
'Volume' => vol
if ta.crossover(target, filterValue)
bx := box.new(x, top, x + count, btm
, border_color = na
, bgcolor = css)
if target > filterValue
box.set_right(bx, x + count)
//-----------------------------------------------------------------------------}
//Global variables
//-----------------------------------------------------------------------------{
//Pivot high
var float ph_top = na
var float ph_btm = na
var bool ph_crossed = na
var ph_x1 = 0
var box ph_bx = box.new(na,na,na,na
, bgcolor = color.new(topAreaCss, 80)
, border_color = na)
//Pivot low
var float pl_top = na
var float pl_btm = na
var bool pl_crossed = na
var pl_x1 = 0
var box pl_bx = box.new(na,na,na,na
, bgcolor = color.new(btmAreaCss, 80)
, border_color = na)
//-----------------------------------------------------------------------------}
//Display pivot high levels/blocks
//-----------------------------------------------------------------------------{
ph = ta.pivothigh(length, length)
//Get ph counts
= get_counts(ph, ph_top, ph_btm)
//Set ph area and level
if ph and showTop
ph_top := high
ph_btm := switch area
'Wick Extremity' => math.max(close , open )
'Full Range' => low
ph_x1 := n - length
ph_crossed := false
box.set_lefttop(ph_bx, ph_x1, ph_top)
box.set_rightbottom(ph_bx, ph_x1, ph_btm)
else
ph_crossed := close > ph_top ? true : ph_crossed
if ph_crossed
box.set_right(ph_bx, ph_x1)
else
box.set_right(ph_bx, n+3)
if showTop
//Set ph zone
set_zone(ph, ph_x1, ph_top, ph_btm, ph_count, ph_vol, topAreaCss)
//Set ph level
set_level(ph, ph_crossed, ph_top, ph_count, ph_vol, topCss)
//Set ph label
set_label(ph_count, ph_vol, ph_x1, ph_top, topCss, label.style_label_down)
//-----------------------------------------------------------------------------}
//Display pivot low levels/blocks
//-----------------------------------------------------------------------------{
pl = ta.pivotlow(length, length)
//Get pl counts
= get_counts(pl, pl_top, pl_btm)
//Set pl area and level
if pl and showBtm
pl_top := switch area
'Wick Extremity' => math.min(close , open )
'Full Range' => high
pl_btm := low
pl_x1 := n - length
pl_crossed := false
box.set_lefttop(pl_bx, pl_x1, pl_top)
box.set_rightbottom(pl_bx, pl_x1, pl_btm)
else
pl_crossed := close < pl_btm ? true : pl_crossed
if pl_crossed
box.set_right(pl_bx, pl_x1)
else
box.set_right(pl_bx, n+3)
if showBtm
//Set pl zone
set_zone(pl, pl_x1, pl_top, pl_btm, pl_count, pl_vol, btmAreaCss)
//Set pl level
set_level(pl, pl_crossed, pl_btm, pl_count, pl_vol, btmCss)
//Set pl labels
set_label(pl_count, pl_vol, pl_x1, pl_btm, btmCss, label.style_label_up)
//-----------------------------------------------------------------------------}

GBPUSD Weekly Cross LinesThis indicator tracks 20/50 EMA crossovers on GBPUSD (Weekly timeframe) and displays the crossover points across all symbols and timeframes, allowing traders to visually align current price action with key historical turning points in GBPUSD.
The script works by detecting bullish (20 EMA crossing above 50 EMA) and bearish (20 EMA crossing below 50 EMA) signals since 2010, using request.security() to source data from GBPUSD weekly candles, even if the indicator is applied to AAPL, EURJPY, BTCUSD, or any other asset.
Each crossover is marked with a vertical line that persists across all charts, offering a powerful way to:
Compare current market context with GBPUSD’s historical trend shifts
Observe intermarket correlations
Align trading timing across multiple assets
Spot macro trend transitions that ripple across global markets

ICT Macro Slot Algo Event📊 Overview
A powerful multi-timeframe trading indicator that combines Institutional Macro Session Tracking identify optimal trading windows throughout the day. This tool helps traders align with institutional flow patterns and algorithmic activity across major sessions.
🎯 Key Features
1. Macro Algo Event Sessions
Tracks 6 key institutional time windows during NY Session:
NY Sweep (08:50-09:10) - Opening balance flows
Silver Bullet #1 (09:50-10:10) - First major macro move
Silver Bullet #2 (10:50-11:10) - Second chance/retest opportunity
Lunch Macro (11:50-12:10) - Mid-day repositioning
Post-Lunch Rebalance (13:10-13:40) - Post-lunch adjustments
NY Closing Macros (15:15-15:45) - End-of-day flows

FVG – (auto close + age) GR V1.0FVG – Fair Value Gaps (auto close + age counter)
Short Description
Automatically detects Fair Value Gaps (FVGs) on the current timeframe, keeps them open until price fully fills the gap or a maximum bar age is reached, and shows how many candles have passed since each FVG was created.
Full Description
This indicator automatically finds and visualizes Fair Value Gaps (FVGs) using the classic 3-candle ICT logic on any timeframe.
It works on whatever timeframe you apply it to (M1, M5, H1, H4, etc.) and adapts to the current chart.
FVG detection logic
The script uses a 3-candle pattern:
Bullish FVG
Condition:
low > high
Gap zone:
Lower boundary: high
Upper boundary: low
Bearish FVG
Condition:
high < low
Gap zone:
Lower boundary: high
Upper boundary: low
Each detected FVG is drawn as a colored box (green for bullish, red for bearish in this version, but you can adjust colors in the inputs).
Auto-close rules
An FVG remains on the chart until one of the following happens:
Full fill / mitigation
A bullish FVG closes when any candle’s low goes down to or below the lower boundary of the gap.
A bearish FVG closes when any candle’s high goes up to or above the upper boundary of the gap.
Maximum bar age reached
Each FVG has a maximum lifetime measured in candles.
When the number of candles since its creation reaches the configured maximum (default: 200 bars), the FVG is automatically removed even if it has not been fully filled.
This keeps the chart cleaner and prevents very old gaps from cluttering the view.
Age counter (labels inside the boxes)
Inside every FVG box there is a small label that:
Shows how many bars have passed since the FVG was created.
Moves together with the right edge of the box and stays vertically centered in the gap.
This makes it easy to distinguish fresh gaps from older ones and prioritize which zones you want to pay attention to.
Inputs
FVG color – Main fill color for all FVG boxes.
Show bullish FVGs – Turn bullish gaps on/off.
Show bearish FVGs – Turn bearish gaps on/off.
Max bar age – Maximum number of candles an FVG is allowed to stay on the chart before it is removed.
Usage
Works on any symbol and any timeframe.
Can be combined with your own ICT / SMC concepts, order blocks, session ranges, market structure, etc.
You can also choose to only display bullish or only bearish FVGs depending on your directional bias.
Disclaimer
This script is for educational and informational purposes only and is not financial advice. Always do your own research and use proper risk management when trading.

ICT Macro Slot Algo Event📊 Overview
A powerful multi-timeframe trading indicator that combines Institutional Macro Session Tracking to identify optimal trading windows throughout the day. This tool helps traders align with institutional flow patterns and algorithmic activity across major sessions.
🎯 Key Features
1. Macro Algo Event Sessions
Tracks 6 key institutional time windows during NY Session:
NY Sweep (08:50-09:10) - Opening balance flows
Silver Bullet #1 (09:50-10:10) - First major macro move
Silver Bullet #2 (10:50-11:10) - Second chance/retest opportunity
Lunch Macro (11:50-12:10) - Mid-day repositioning
Post-Lunch Rebalance (13:10-13:40) - Post-lunch adjustments
NY Closing Macros (15:15-15:45) - End-of-day flows

Divergence Channels Indicator — JudasBulletUnique Buy/Sell Indicator. Place stoploss above/below 18 EMA. Low risk/high reward. My No.1 indicator on every chart.

HTF Hollow Candle overlayoverlays HTF candle ontop of price so you can watch m1 chart filling up an h4 bar


ParabolicSAR+EMA[TS_Indie]🚀 EMA + Parabolic SAR Reversal Trading Strategy
This trading system effectively combines the use of Exponential Moving Averages (EMA) with the Parabolic SAR to identify both price trends and key reversal points. The EMA Fast is used to signal the primary short-term trend, while the EMA Slow acts as a filter for the long-term trend direction. The Parabolic SAR then helps to confirm the reversal signals.
🛠️ Tools Used
1. EMA Fast – Primary Short-Term Trend
2. EMA Slow – Long-Term Trend Filter
3. Parabolic SAR – Reversal Confirmation
🎯 Entry Rules
📈 Buy Setup
1. Trend Filter: EMA Fast > EMA Slow → Uptrend
2. Pullback: Price pulls back and closes below the EMA Fast line.
3. Reversal: Price reverses/pulls back up and closes above the EMA Fast line.
4. SAR Confirmation: The previous Parabolic SAR dot is above the high, and the dot in the current candle is below the low → Reversal signal confirmed.
5. Entry: Enter Buy immediately.
📉 Sell Setup
1. Trend Filter: EMA Fast < EMA Slow → Downtrend
2. Pullback: Price pulls back and closes above the EMA Fast line.
3. Reversal: Price reverses/pulls back down and closes below the EMA Fast line.
4. SAR Confirmation: The previous Parabolic SAR dot is below the low, and the dot in the current candle is above the high → Reversal signal confirmed.
5. Entry: Enter Sell immediately.
💰 Exit Management (Entry, Stop Loss, Take Profit)
1. Entry: Enter the order at the closing price of the signal candle.
2. Stop Loss (SL): Set the Stop Loss at the Parabolic SAR dot.
3. Take Profit (TP): Calculated from the Entry and Stop Loss points, multiplied by the Risk Reward Ratio.
⚙️ Optional Parameters
➭ Custom Risk/Reward Ratio for Take Profit.
➭ Option to add an ATR buffer to the Stop Loss.
➭ Adjustable EMA Fast period.
➭ Adjustable EMA Slow period.
➭ Adjustable Parabolic SAR parameters.
➭ Option to enable Long-only / Short-only positions.
➭ Customizable Backtest start and end date.
➭ Customizable trading session time.
🔔 Alert Function
Alerts display:
➭ Entry Price
➭ Stop Loss Price
➭ Take Profit Price
💡 This strategy allows for many parameter adjustments, such as the MA type, adding/subtracting from the Stop Loss using ATR, and selecting specific sessions for backtesting. If you find interesting or profitable results after adjusting the parameters, please share your comments with other traders!
⚠️ Disclaimer
This indicator is designed for educational and research purposes only. It does not guarantee profits and should not be considered financial advice. Trading in financial markets involves significant risk , including the potential loss of capital.

Advanced Triple Strategy ScalperHere are the three scalping strategies presented in the video "3 Scalping Strategies That Work Every Day (Backtested & Proven)" by Asia Forex Mentor – Ezekiel Chew:
### Scalper’s Trend Filter (Triple EMA)
This strategy uses three EMAs (25, 50, 100) on the 5-minute chart to filter high-probability trades aligned with momentum .
- Only trade when all three EMAs are angled in the same direction and clearly separated (no crossing or tangling) .
- Enter when price pulls back toward the 25 or 50 EMA and then bounces back toward the 25 EMA, but do not enter if price closes below the 100 EMA .
- Set stop-loss just below the 50 EMA or swing low and aim for a risk-to-reward ratio of 1:1.5 .
### Flip Zone Trap (Reversal Catching)
This method identifies precise reversal moments where market structure shifts from weakness to strength .
- Use the 15-min chart to locate key support or resistance zones where price previously reacted .
- Wait for price to stop making lower lows and begin making higher highs (or vice versa for shorts); confirm with a trendline break AND follow-through (higher lows & highs within 5-7 candles) .
- Use confirmation candles (bullish engulfing, pin bar rejection) at the zone before entry .
### Liquidity Shift Trigger (Smart Money Trap)
This system leverages institutional stop hunts and liquidity sweeps at key zones for sniper entries .
- Start with a 15-min chart to identify structure breaks and points of interest (order blocks, flip zones, demand zones) .
- Drop to 1-min chart and wait for price to enter the refined zone and sweep liquidity (sharp wick/spike below/above key level) .
- Once liquidity is swept, wait for a clean structure shift (break of most recent internal high or low) within 5–6 candles—if confirmed, refine entry to the candle that caused the break and enter when price returns to that candle with a strong reaction .
***
### Practical Application
- These strategies are systematic, rule-based, and designed to cut out fake moves, avoid early stop-outs, and align entries with momentum and institutional activity .
- Perfect for short timeframes and volatile pairs like XAUUSD, especially if paired with additional confirmation from other technical analysis tools .
All three strategies emphasize filtering noise, waiting for momentum/trend confirmation, and avoiding impulsive entries—key principles for consistent scalping success

Institution Radar Institution Radar
Institution Radar compares Price RSI with Volume-Delta RSI to show when price moves are real (backed by volume) or fake (moving without volume).
This helps reveal two powerful concepts:
Absorption (Bullish or Bearish)
Absorption happens when a large limit order is sitting in the order book.
Market orders hit it over and over, but the level doesn't break.
This usually means:
Strong players are absorbing the aggressive orders
Price is likely to move in the opposite direction
The next candle often reacts immediately
Can lead to a full reversal or just a short 1–2 candle move
Exhaustion (Bullish or Bearish)
Exhaustion happens when institutions pull their limit orders away.
There is no real volume behind the move, so price drifts up or down easily.
This usually means:
The current move is weak
A slowdown, pullback, or reversal is likely
Often shows up right before a flip in direction
📌 What the Signals Mean
Green signal → next candles often push upward
Red signal → next candles often push downward
These can mark trend reversals or temporary 1–2 candle reactions
🎚️ Sensitivity Setting
You can adjust how strict the signals are:
Lower sensitivity = more signals, more noise
Higher sensitivity = fewer signals, but more accurate and stronger
A higher sensitivity is recommended if you only want the cleanest institutional moments.

Tokyo & London Pre-Market Boxes (Local Time)//@version=5
indicator("Daily 10am & 6pm Lines", overlay=true)
var line line10 = na
var line line18 = na
// Convert 10:00 and 18:00 into timestamps for today
t10 = timestamp(year, month, dayofmonth, 10, 0)
t18 = timestamp(year, month, dayofmonth, 18, 0)
// When the bar’s time crosses 10:00, draw a vertical line
if (time >= t10 and time < t10)
line10 := line.new(x1 = t10, y1 = low, x2 = t10, y2 = high, color=color.blue, width = 1)
// When the bar’s time crosses 18:00 (6pm), draw another line
if (time >= t18 and time < t18)
line18 := line.new(x1 = t18, y1 = low, x2 = t18, y2 = high, color=color.red, width = 1)


Turtle System 1 (20/10) + N-Stop + MTF Table V7.2🐢 Description: Turtle System 1 (20/10) IndicatorThis indicator implements the original trading signals of the Turtle Trading System 1 based on the classic Donchian Channels. It incorporates a historically correct, volatility-based Trailing Stop (N-Stop) and a Multi-Timeframe (MTF) status dashboard. The script is written in Pine Script v6, optimized for performance and reliability.📊 Core Logic and ParametersThe system is a pure trend-following model, utilizing the more widely known, conservative parameters of the Turtle System 1:FunctionParameterValueDescriptionEntry$\text{Donchian Breakout}$$\mathbf{20}$Buy/Sell upon breaking the 20-day High/Low.Exit (Turtle)$\text{Donchian Breakout}$$\mathbf{10}$Close the position upon breaking the 10-day Low/High.Volatility$\mathbf{N}$ (ATR Period)$\mathbf{20}$Calculation of market volatility using the Average True Range (ATR).Stop-LossMultiplier$\mathbf{2.0} BER:SETS the initial and Trailing Stop at $\mathbf{2N}$.🛠️ Key Technical Features1. Original Turtle Trailing Stop (Section 4)The stop-loss mechanism is implemented with the historically accurate Turtle Trailing Logic. The stop is not aggressively tied to the current candle's low/high, which often causes premature exits. Instead, the stop only trails in the direction of the trend, maximizing the previous stop price against the new calculated $\text{Close} \pm 2N$:$$\text{New Trailing Stop} = \text{max}(\text{Previous Stop}, \text{Close} \pm (2 \times N))$$2. Reliable Multi-Timeframe (MTF) Status (Section 6)The indicator features a robust MTF status table.Purpose: It calculates and persistently stores the Turtle System 1 status (LONG=1, SHORT=-1, FLAT=0) for various timeframes (1H, 4H, 8H, 1D, and 1W).Method: It uses global var int variables combined with request.security(), ensuring the status is accurately maintained and updated across different bars and timeframes, providing a reliable higher-timeframe context.3. VisualizationsChannels: The 20-period (Entry) and 10-period (Exit) Donchian Channels are plotted.Stop Line: The dynamic $\mathbf{2N}$ Trailing Stop is visible as a distinct line.Signals: plotshape markers indicate Entry and Exit.MTF Table: A clean, color-coded status summary is displayed in the upper right corner.

Turtle System 2 (55/20) + N-Stop + MTF Table V7.2🐢 Description: Turtle System 2 (55/20) IndicatorThis indicator implements the trading signals of the Turtle Trading System 2 based on the classic Donchian Channels, supplemented by a historically correct, volatility-based Trailing Stop (N-Stop) and a Multi-Timeframe (MTF) status overview. The script was developed in Pine Script v6 and is optimized for performance and robustness.📊 Core Logic and ParametersThe indicator is based on the rule-based trend-following system developed by Richard Dennis and William Eckhardt, utilizing the more aggressive Entry/Exit parameters of System 2:FunctionParameterValueDescriptionEntry$\text{Donchian Breakout}$$\mathbf{55}$Buy/Sell upon breaking the 55-day High/Low.Exit (Turtle)$\text{Donchian Breakout}$$\mathbf{20}$Close the position upon breaking the 20-day Low/High.Volatility$\mathbf{N}$ (ATR Period)$\mathbf{20}$Calculation of market volatility using the Average True Range (ATR).Stop-LossMultiplier$\mathbf{2.0} BER:SETS the initial and Trailing Stop at $\mathbf{2N}$.🛠️ Technical Implementation1. Correct Trailing Stop (Section 4)In contrast to many flawed implementations, the Trailing Stop is implemented here according to the Original Turtle Logic. The stop price (current_stop_price) is not aggressively tied to the current low or high. Instead, at the close of each bar, it is only trailed in the direction of the trade (math.max for long positions) based on the formula:$$\text{New Trailing Stop} = \text{max}(\text{Previous Stop}, \text{Close} \pm (2 \times N))$$This ensures the stop is only adjusted upon sustained positive movement and is not prematurely triggered by short-term, deep price shadows.2. Reliable Multi-Timeframe (MTF) Logic (Section 6)The MTF section utilizes global var int variables (mtf_status_1h, mtf_status_D, etc.) in conjunction with the request.security() function.Purpose: Calculates and persistently stores the current Turtle System 2 status (LONG=1, SHORT=-1, FLAT=0) for the timeframes 1H, 4H, 8H, 1D, and 1W.Advantage: By persistently storing the status using the var variables, the critical error of single-update status is eliminated. The states shown in the table are reliable and accurately reflect the Turtle System's position status on the respective timeframes.3. Visual ComponentsDonchian Channels: The entry (55-period) and exit (20-period) channels are drawn with color highlighting.N-Stop Line: The dynamically calculated Trailing Stop ($\mathbf{2N}$) is displayed as a magenta line.Visual Signals: plotshape markers indicate Entry and Exit points.MTF Table: A compact status summary with color coding (Green/Red/Gray) for the higher timeframes is displayed in the upper right corner.


Turtle System 1 Long & Short (Donchian + N-Stop) + MTF Table V6 Turtle Trading Long & Short (System 1 – 20/10 Donchian + True 2N Trailing Stop) + Multi-Timeframe Dashboard – Pine Script v6This indicator is a 100 % faithful implementation of the famous original Turtle Trading System 1 (Richard Dennis & William Eckhardt) with the following genuine rules:Entry: 20-period Donchian Channel breakout (using the high/low of the previous completed bars only → )
Exit: Classic 10-period Donchian opposite breakout OR hit of the volatility-based stop
Risk Management: True 2N trailing stop (N = 20-period ATR). The stop is pulled tighter on every new favorable extreme (real Turtle trailing – not fixed!)
Fully dynamic position tracking (Long / Short / Flat) on the chart’s timeframe
Visual signals: green/red triangles for entries, diamonds for exits, trailing stop line, entry labels with current N and stop price
Unique Feature – Multi-Timeframe (MTF) Status Table
A clean table in the top-right corner instantly shows the current Turtle position status on five higher timeframes simultaneously:Turtle MTF
1H
4H
8H
1D
1W
Status
LONG / SHORT / FLAT (color-coded)
This allows you to see at a glance whether higher timeframes are already in a Turtle trend – perfect for trend confirmation, filtering, or multi-timeframe trading.Key Visual ElementsLime upper Donchian line (20-period high)
Red lower Donchian line (10-period low)
Gray channel fill
Fuchsia trailing 2N stop line (moves only in favorable direction)
Entry labels showing current N-value and exact stop price
Arrows and diamonds for entries/exits
Alerts
Two ready-to-use alert conditions:“Turtle Long Entry”
“Turtle Short Entry”
Works on any market and any chart timeframe (stocks, forex, futures, crypto).
Completely written and tested in Pine Script version 6.A true, clean, no-nonsense Turtle System 1 with real trailing volatility stops and a powerful higher-timeframe dashboard – exactly how the original Turtles traded (only better visualized)! Enjoy the trends!
