Previous Day Candle [ApexFX]Previous Day Candle is a precision tool designed for intraday traders who rely on previous daily structures to find support and resistance.
While most indicators simply mark the previous high and low, this tool focuses on Session Continuity. It highlights the full 24-hour range of the previous day and extends those levels into the "Killzone" of the current trading day (up to 2:00 PM EST / 12:00 PM MST).
Why use this? Market reaction often occurs at the previous day's extremes. By extending these lines into the current session, you can easily spot:
Breakouts: Price pushing through yesterday's high.
Failed Auctions: Price sweeping yesterday's low and reversing.
Support/Resistance Flips: Old highs becoming new support.
Main Features:
Asset Class Presets: Don't worry about timezones. Simply select your market:
Forex: Aligns to the standard 5:00 PM EST New York Open.
Indices: Aligns to the 6:00 PM EST Globex Open.
Crypto: Aligns to UTC Midnight.
Custom: Full manual control for specific needs.
Visual "Boxing": Vertical dotted lines clearly demarcate the start and end of the previous trading day.
Dynamic History: Choose to show just yesterday's levels or look back at the last 5+ days.
Smart Color Coding: The indicator automatically cycles colors for each day (Blue = Yesterday, Green = 2 Days Ago, etc.), making it instant to read historical price action.
Best Used On: Intraday timeframes (5m, 15m, 1h).
"纳斯达克期货cfd"に関するスクリプトを検索

SMI Color Red/Green📌 TradingView Description – SMI Red/Green Momentum Line
🔥 Stochastics Momentum Index (SMI) – Dynamic Red/Green Version
This indicator is an enhanced and modernized version of the Stochastic Momentum Index (SMI), designed to deliver a more visual, intuitive, and responsive view of trend momentum.
It includes:
✔️ Smoothed SMI
✔️ Dynamic Red/Green momentum coloring
✔️ Signal EMA line
✔️ Overbought/Oversold zones with shading
🎨 Dynamic Red/Green SMI Line
The main SMI line automatically changes color based on momentum direction:
Green → Bullish momentum (SMI rising)
Red → Bearish momentum (SMI falling)
This provides instant visual feedback and highlights early momentum changes even before traditional signal-line crossovers.
📉 Indicator Structure
1️⃣ Smoothed SMI
The SMI is calculated using the price’s position inside its range and then smoothed with an SMA to reduce noise.
2️⃣ EMA Signal Line
A customizable EMA acts as a signal line, providing:
Clear bullish/bearish crossovers
Trend confirmation
Cleaner entry/exit signals
3️⃣ Overbought / Oversold Zones
Extreme levels are highlighted using color-filled zones:
Red Zone (Overbought) → potential bearish reversal
Green Zone (Oversold) → potential bullish reversal
Levels are fully adjustable.
💡 How to Use It
The indicator works exceptionally well across all timeframes.
The most powerful signals are:
✔️ SMI crossing above/below the EMA
SMI crosses above EMA → bullish signal
SMI crosses below EMA → bearish signal
✔️ Leaving Overbought/Oversold zones
SMI exits the oversold zone → potential long setup
SMI exits the overbought zone → potential short setup
✔️ Color shifts (momentum direction)
Red → Green : early bullish momentum
Green → Red : early bearish momentum
Perfect for scalping, day trading, and swing trading.
🚀 Why This Version Is Better
Extremely visual momentum reading
Noise reduction through smoothing
Instantly readable color-coded trend
Strong OB/OS zone visualization
Works on any market and timeframe
Great in combination with RSI, MACD, HMA, ALMA, and trend filters
If you'd like, I can also write:
🔹 a SEO-optimized title,
🔹 recommended TradingView tags,
🔹 or a shorter promotional description.

Advanced Time Dividers & Killzones IndicatorOverview
A comprehensive Pine Script v6 indicator that displays customizable time period dividers and trading session killzones on your chart. Perfect for intraday traders who need clear visual separation of time periods and want to identify key trading sessions.
✨ Features
Time Period Dividers
Weekly Lines: Vertical lines marking the start of each week
Monthly Lines: Vertical lines marking the start of each month
Quarterly Lines: Vertical lines marking the start of each quarter (Q1, Q2, Q3, Q4)
Yearly Lines: Vertical lines marking the start of each year
Trading Session Killzones
London Session: 2:00-5:00 GMT (Blue shaded box)
New York Session: 7:00-10:00 GMT (Green shaded box)
London Close: 10:00-12:00 GMT (Orange shaded box)
Asia Session: 20:00-00:00 GMT (Pink shaded box)
🎨 Customization Options
Display Controls
Toggle each time divider type individually
Toggle each killzone individually
Adjust historical and future display range
Show/hide labels on dividers and killzones
Style Customization
Line Styles: Choose between Solid, Dashed, or Dotted lines
Line Width: Adjustable from 1 to 5 pixels
Colors: Fully customizable colors for each element with transparency control
Label Size: Choose from Tiny, Small, Normal, or Large
Period Settings
Control how many bars to display in the past (0-5000)
Control how many bars to display in the future (0-1000)
📋 Usage Instructions
Add to Chart: Add the indicator to any chart
Select Timeframe: Works best on intraday timeframes (1H, 15min, 5min) for killzones
Customize: Open settings to enable/disable features and customize colors
Trading: Use the dividers to identify time periods and killzones to spot high-liquidity sessions
💡 Trading Applications
Time Dividers
Weekly/Monthly Analysis: Identify major time period transitions
Market Structure: Analyze how price behaves at period boundaries
Event Correlation: Align with economic calendar events
Killzones
High Liquidity Periods: Trade during peak market activity
ICT Strategy: Follows Inner Circle Trader killzone concepts
Session-Based Trading: Focus on specific trading sessions
Volatility Windows: Identify when major moves typically occur
⚙️ Technical Details
Version: Pine Script v6
Type: Overlay indicator
Max Lines: 500 (optimized performance)
Max Boxes: 500 (for killzone visualization)
Timezone: GMT/UTC for killzones
Memory Efficient: Automatic cleanup of old objects
🎯 Best Practices
Combine with Price Action: Use dividers to frame your analysis
Focus on Killzones: Most significant price moves occur during these sessions
Adjust Transparency: Find the right balance between visibility and chart clarity
Use Labels Wisely: Toggle labels on/off based on your needs
Timeframe Selection: Use lower timeframes (≤1H) to see killzones clearly
📝 Notes
Killzone times are in GMT/UTC timezone
Works on all instruments (Forex, Crypto, Stocks, Futures)
Optimized for performance with automatic memory management
Fully compatible with other indicators
🔄 Updates & Support
This indicator is actively maintained. Feel free to suggest improvements or report issues in the comments.

Donchian Predictive Channel (Zeiierman)█ Overview
Donchian Predictive Channel (Zeiierman) extends the classic Donchian framework into a predictive structure. It does not just track where the range has been; it projects where the Donchian mid, high, and low boundaries are statistically likely to move based on recent directional bias and volatility regime.
By quantifying the linear drift of the Donchian midline and the expansion or compression rate of the Donchian range, the indicator generates a forward propagation cone that reflects the prevailing trend and volatility state. This produces a cleaner, more analytically grounded projection of future price corridors, and it remains fully aligned with the signal precision of the underlying Donchian logic.
█ How It Works
⚪ Donchian Core
The script first computes a standard Donchian Channel over a configurable Length:
Upper Band (dcHi) – highest high over the lookback.
Lower Band (dcLo) – lowest low over the lookback.
Midline (dcMd) – simple midpoint of upper and lower: (dcHi + dcLo)/ 2.
f_getDonchian(length) =>
hi = ta.highest(high, length)
lo = ta.lowest(low, length)
md = (hi + lo) * 0.5
= f_getDonchian(lenDC)
⚪ Slope Estimation & Range Dynamics
To turn the Donchian Channel into a predictive model, the script measures how both the midline and the range are changing over time:
Midline Slope (mSl) – derived from a 1-bar difference in linear regression of the midline.
Range Slope (rSl) – derived from a 1-bar difference in linear regression of the Donchian range (dcHi − dcLo).
This pair describes both directional drift (uptrend vs. downtrend) and range expansion/compression (volatility regime).
f_getSlopes(midLine, rngVal, length) =>
mSl = ta.linreg(midLine, length, 0) - ta.linreg(midLine, length, 1)
rSl = ta.linreg(rngVal, length, 0) - ta.linreg(rngVal, length, 1)
⚪ Forward Projection Engine
At the last bar, the indicator constructs a set of forward points for the mid, upper, and lower projections over Forecast Bars:
The midline is projected linearly using the midline slope per bar.
The range is adjusted using the range slope per bar, creating either a widening cone (expansion) or a tightening cone (compression).
Upper and lower projections are then anchored around the projected midline, with logic that keeps the structure consistent and prevents pathological flips when slope changes sign.
f_generatePoints(hi0, md0, lo0, steps, midSlp, rngSlp) =>
upPts = array.new()
mdPts = array.new()
dnPts = array.new()
fillPts = array.new()
hi_vals = array.new_float()
md_vals = array.new_float()
lo_vals = array.new_float()
curHiLocal = hi0
curLoLocal = lo0
curMidLocal = md0
segBars = math.floor(steps / 3)
segBars := segBars < 1 ? 1 : segBars
for b = 0 to steps
mdProj = md0 + midSlp * b
prevRange = curHiLocal - curLoLocal
rngProj = prevRange + rngSlp * b
hiTemp = 0.0
loTemp = 0.0
if midSlp >= 0
hiTemp := math.max(curHiLocal, mdProj + rngProj * 0.5)
loTemp := math.max(curLoLocal, mdProj - rngProj * 0.5)
else
hiTemp := math.min(curHiLocal, mdProj + rngProj * 0.5)
loTemp := math.min(curLoLocal, mdProj - rngProj * 0.5)
hiProj = hiTemp < mdProj ? curHiLocal : hiTemp
loProj = loTemp > mdProj ? curLoLocal : loTemp
if b % segBars == 0
curHiLocal := hiProj
curLoLocal := loProj
curMidLocal := mdProj
array.push(hi_vals, curHiLocal)
array.push(md_vals, curMidLocal)
array.push(lo_vals, curLoLocal)
array.push(upPts, chart.point.from_index(bar_index + b, curHiLocal))
array.push(mdPts, chart.point.from_index(bar_index + b, curMidLocal))
array.push(dnPts, chart.point.from_index(bar_index + b, curLoLocal))
ptSet.new(upPts, mdPts, dnPts)
⚪ Rejection Signals
The script also tracks failed Donchian breakouts and marks them as potential reversal/reversion cues:
Signal Down: Triggered when price makes an attempt above the upper Donchian band but then pulls back inside and closes above the midline, provided enough bars have passed since the last signal.
Signal Up: Triggered when price makes an attempt below the lower Donchian band but then snaps back inside and closes below the midline, also requiring sufficient spacing from the previous signal.
// Base signal conditions (unfiltered)
bearCond = high < dcHi and high >= dcHi and close > dcMd and bar_index - lastMarker >= lenDC
bullCond = low > dcLo and low <= dcLo and close < dcMd and bar_index - lastMarker >= lenDC
// Apply MA filter if enabled
if signalfilter
bearCond := bearCond and close < ma // Bearish only below MA
bullCond := bullCond and close > ma // Bullish only above MA
signalUp := false
signalDn := false
if bearCond
lastMarker := bar_index
signalDn := true
if bullCond
lastMarker := bar_index
signalUp := true
█ How to Use
The Donchian Predictive Channel is designed to outline possible future price trajectories. Treat it as a directional guide, not a fixed prediction tool.
⚪ Map Future Support & Resistance
Use the projected upper and lower paths as dynamic future reference levels:
Projected upper band ≈ is likely a resistance corridor if the current trend and volatility persist.
Projected lower band ≈ likely support corridor or expected downside range.
⚪ Trend Path & Volatility Cone
Because the projection is driven by midline and range slopes, the channel behaves like a trend + volatility cone:
Steep positive midline slope + expanding range → accelerating, high-volatility trend.
Flat midline + compressing range → coiling/contracting regime ahead of potential expansion.
This helps you distinguish between a gentle drift and an aggressive move that likely needs more risk buffer.
⚪ Reversion & Rejection Signals
The Donchian-based signals are especially useful for mean-reversion and fade-style trades.
A Signal Down near the upper band can mark a failed breakout and a potential rotation back toward the midline or the lower projected band.
A Signal Up near the lower band can flag a failed breakdown and a potential snap-back up the channel.
When Filter Signals is enabled, these signals are only generated when they align with the chart’s directional bias as defined by the moving average. Bullish signals are allowed only when the price is above the MA, and bearish signals only when the price is below it.
This reduces noise and helps ensure that reversions occur in harmony with the prevailing trend environment.
█ Settings
Length – Donchian lookback length. Higher values produce a smoother channel with fewer but more stable signals. Lower values make the channel more reactive and increase sensitivity at the cost of more noise.
Forecast Bars – Number of bars used for projecting the Donchian channel forward.
Higher values create a broader, longer-term projection. Lower values focus on short-horizon price path scenarios.
Filter Signals – Enables directional filtering of Donchian signals using the selected moving average. When ON, bullish signals only trigger when the price is above the MA, and bearish signals only trigger when the price is below it. This helps reduce noise and aligns reversions with the broader trend context.
Moving Average Type – The type of moving average used for signal filtering and optional plotting.
Choose between SMA, EMA, WMA, or HMA depending on desired responsiveness. Faster averages (EMA, HMA) react quickly, while slower ones (SMA, WMA) smooth out short-term noise.
Moving Average Length – Lookback length of the moving average. Higher values create a slower, more stable trend filter. Lower values track price more tightly and can flip the directional bias more frequently.
-----------------
Disclaimer
The content provided in my scripts, indicators, ideas, algorithms, and systems is for educational and informational purposes only. It does not constitute financial advice, investment recommendations, or a solicitation to buy or sell any financial instruments. I will not accept liability for any loss or damage, including without limitation any loss of profit, which may arise directly or indirectly from the use of or reliance on such information.
All investments involve risk, and the past performance of a security, industry, sector, market, financial product, trading strategy, backtest, or individual's trading does not guarantee future results or returns. Investors are fully responsible for any investment decisions they make. Such decisions should be based solely on an evaluation of their financial circumstances, investment objectives, risk tolerance, and liquidity needs.

EMA Cloud5 EMA works as a single indicator.
You can see 8-21-55-100-200 EMAs all together in one indicator.
There is also a cloud between the 8 and 21 EMA. When the 8 EMA is above the 21 EMA, the cloud appears green. When the 21 EMA is above the 8 EMA, the cloud appears red.

MTF VWAP + Candlestick VWAP Reactions (Bounce + Score)It’s an intraday VWAP + candlestick confluence tool that:
Draws daily, weekly, monthly, yearly VWAPs.
Detects textbook candlestick patterns, classed as BuH/BuM (bullish high/moderate) and BeH/BeM (bearish high/moderate) with colored boxes.
Triggers long/short arrows only when price bounces off a VWAP by at least 0.15% AND there’s a recent matching pattern.
Grades every signal as A / B / C with a score 1–10:
A (8–10) = high-reliability pattern (BuH/BeH) + strong 2-candle body reaction (your A+ setups).
B (5–8) = moderate pattern (BuM/BeM) + one solid bounce.
C (1–5) = weaker / mixed context (scalpy or gamble).

amir Liquidity Sweeps [amir]this indicator is from luxalgon i think this is the code that made this incdicator never get destroyed by aanyone

9:00-9:59 NY Range -> 10:00-11:00 Lines (v6)//@version=6
indicator("9:00-9:59 NY Range -> 10:00-11:00 Lines (v6)", overlay=true, max_lines_count=500)
// --- state vars ---
var float sessionHigh = na
var float sessionLow = na
var line hiLine = na
var line loLine = na
var line v10 = na
var line v11 = na
// --- New York time ---
t_ny = time("America/New_York")
hr = hour(t_ny)
mn = minute(t_ny)
// --- reset / clear at 16:00 (4 PM NY) ---
if hr == 16 and mn == 0
sessionHigh := na
sessionLow := na
if not na(hiLine)
line.delete(hiLine)
hiLine := na
if not na(loLine)
line.delete(loLine)
loLine := na
if not na(v10)
line.delete(v10)
v10 := na
if not na(v11)
line.delete(v11)
v11 := na
// --- accumulate 9:00 - 9:59 NY range ---
if hr == 9
if mn == 0
sessionHigh := high
sessionLow := low
else
sessionHigh := na(sessionHigh) ? high : math.max(sessionHigh, high)
sessionLow := na(sessionLow) ? low : math.min(sessionLow, low)
// --- at 10:00 NY: draw horizontal lines (start) and vertical dashed at 10:00 ---
if hr == 10 and mn == 0
// delete previous day's horizontal lines if any
if not na(hiLine)
line.delete(hiLine)
hiLine := na
if not na(loLine)
line.delete(loLine)
loLine := na
hiLine := line.new(bar_index, sessionHigh, bar_index, sessionHigh, color=color.red, width=1, extend=extend.none)
loLine := line.new(bar_index, sessionLow, bar_index, sessionLow, color=color.red, width=1, extend=extend.none)
if not na(v10)
line.delete(v10)
v10 := na
v10 := line.new(bar_index, low, bar_index, high, color=color.red, width=1, style=line.style_dashed)
// --- at 11:00 NY: draw vertical dashed at 11:00 ---
if hr == 11 and mn == 0
if not na(v11)
line.delete(v11)
v11 := na
v11 := line.new(bar_index, low, bar_index, high, color=color.red, width=1, style=line.style_dashed)
// --- extend the horizontal lines forward every bar, but only until 11:00 ---
if hr < 11
if not na(hiLine)
line.set_x2(hiLine, bar_index)
if not na(loLine)
line.set_x2(loLine, bar_index)
// --- required output so script compiles (hidden) ---
plot(na)

30m Hollow Candle on 5m - SSThis indicator overlays 30-minute candles on a 5-minute chart using clean, hollow-style higher-timeframe (HTF) candles.
The design keeps your chart readable while giving you full insight into the 30m structure that drives intraday price movements.
Each 30-minute candle is drawn as a transparent, hollow outline, so your 5-minute candles remain perfectly visible. The indicator preserves all candle characteristics:
Wicks (high & low)
Open/close levels
Color-coded direction (green = bullish, red = bearish)
Invisible body to avoid overlapping or chart clutter
This tool allows intraday traders to track 30m market structure without constantly switching timeframes.

1h Hollow Candle on 5m - SSThis indicator displays 1-hour candles on a 5-minute chart using a clean, minimal visual style designed for intraday traders who want to track higher-timeframe structure without cluttering the chart.
The higher-timeframe (HTF) candles are drawn as hollow outlines, which makes them easy to read while keeping the underlying 5-minute price action fully visible. Each 1-hour candle includes:
Wicks (high & low)
Open/close borders
Color-coded direction (green = bullish, red = bearish)
Transparent body so they never block real candles
This is ideal for traders who want to:
Identify HTF structure during scalping
Spot key reversals inside hourly candles
Track premium/discount zones relative to each 1h candle
Improve top-down analysis without switching timeframes

9/15 EMA Scalper 9/15 EMA Scalper — by uzairbaloch
This script is a price-action based scalping system built around the 9 EMA and 15 EMA trend structure.
It identifies short-term reversal points where the market pulls back into the EMAs and confirms direction with a strong candle signal.
The strategy looks for:
• A clear EMA trend (9 above 15 for buys, 9 below 15 for sells)
• Pullback into EMA9/EMA15 with candle bodies touching the fast EMA
• Strong confirmation candle (engulfing / strong momentum / controlled wick)
• Optional slope filter to avoid flat, choppy sessions
• Automatic trade labels showing Entry, SL and TP (based on R:R)
The script is designed for scalping on gold, indices, and high-volatility FX pairs.
It resets trade logic immediately after SL or TP is hit, so it can catch the next valid signal without delay.
This tool is meant as an indicator — not a full strategy — and can be used to visually mark high-probability EMA pullback setups with precise levels.
Author: uzairbaloch


Macketings 1min ScalpingThis is a hyper-reactive scalping strategy designed for the 1-minute chart. It utilizes a strict four-EMA hierarchy (80/90/340/500) to ensure trades are only taken in the strongest aligned market trend. The strategy is built to be extremely tight on risk and focuses on capturing the immediate, high-momentum swing that follows a confirmed EMA retest or breakout.
Key Mechanics (How it Works):
Strict Trend Alignment: Entry is only permitted when the faster EMA band (80/90) and the price action are correctly aligned with the slow trend (340/500).
Long: EMA 80/90 must be above EMA 340/500, AND EMA 340 must be above EMA 500. (And vice-versa for Short.)
Expanded Retest Entry: The strategy waits for the price to retest or briefly enter the 80/90 band, then immediately enters upon the confirmed momentum breakout from that band.
Dynamic Risk Management (Tight Ride): The strategy is engineered to ride the wave aggressively while protecting capital immediately:
Extremely Tight Initial Stop Loss (0.2% default): Limits initial risk instantly.
Break-Even Security: Once profit hits 0.3%, the Stop Loss is automatically trailed to secure 0.2% profit (a risk-free trade).
Aggressive Exit Logic: Positions are closed not only upon hitting the Take Profit target (2.5%) but also immediately if the 80/90 EMA band crosses the 340 EMA, signaling a critical loss of momentum.
Disclaimer:
This strategy requires high-liquidity instruments and is best used on low timeframes (1-minute) due to its dependency on fast momentum shifts and tight stops. Backtesting and forward testing are crucial before deployment.

XAUUSD Scalper — VolEx + Imbalance (Cleaned)this scalping technique is only applicable for Gold Scalp Trading.

Footprint Safe FinalThis script is made for guide purpose only. It has some few important functions that can help you with your trading strategy.

Energy Meter (Candle Range/ATR Ratio)Purpose:
This indicator is a simple, intuitive way to visualize auction energy — the actual force behind a price move — rather than just its appearance on the chart. It’s built on a single idea:
If a bar travels farther than normal in its fixed amount of time, something pushed harder than usual.
That “push” is auction energy, and it’s the raw material of microstructure inference: reading intent and imbalance from nothing more than candles, tempo, and volatility.
Traditional indicators focus on price patterns or volume. This one focuses on pressure — the underlying imbalance driving each bar.
How It Works
Each bar’s True Range is divided by its ATR, producing a normalized ratio:
1.0 = Average energy
>1.2 (default) = Above-normal energy
<1.0 = Quiet, low-pressure bars
This ratio is plotted as a histogram to highlight bursts of force, with a smoothed line added to show the tempo of recent energy changes.
When the histogram spikes, you’re seeing the auction flash its teeth: aggression, initiative, failed absorption, breakout ignition, or the first punch of a reversal.
When the line rolls over, you’re seeing the engine lose torque.
It’s a minimalist tool for seeing who is actually winning the auction, even when price looks deceptively calm.
Why It Matters
Price moves because of imbalance, not geometry. Two candles that look identical can represent completely different internal dynamics.
This indicator helps you see:
Breakout strength vs. fakeouts
Acceleration vs. drift
Exhaustion after extended runs
Reversal attempts with real intent
Quiet absorption before explosive moves
Shifts in aggression hidden inside consolidation
For new traders, it’s a clean introduction to microstructure inference — extracting meaningful order-flow insights without needing L2, DOM, or volume profile.
For experienced traders, it's a compact impulse detector that complements trend, volatility, and liquidity models.
Summary
This is a lightweight, first-principles tool designed to expose the energy signature of the auction: how hard the market is trying to go somewhere.
It doesn’t predict direction — it reveals pressure, so you can judge the quality of the move you’re trading.
Energy beats geometry.
Intent beats patterns.
Microstructure is hiding in every candle; this indicator makes it visible.

AI Candlestick Pattern Identifier — Arrows & AlertsAI shows you high confidence candlestick patterns so that you can identify them quickly. Buy/Sell arrows will be placed alongside the pattern to alert you of which direction the indicator believes the market will go, as well as showing you the confidence in that indicator.

EQT Stochastic RibbonEQT Stochastic Ribbon is a modified Stochastic Oscillator with ribbon fill visualization.
Features:
- Dynamic color ribbon that changes based on trend direction (Blue for bullish, White for bearish)
- Crossover signals with triangle markers when %K crosses %D
- Customizable colors and signal offset
- Dashed lines at 80/20 levels for overbought/oversold zones
How to use:
- Blue ribbon = Bullish momentum (%K above %D)
- White ribbon = Bearish momentum (%K below %D)
- Triangle up = Buy signal (K crosses above D)
- Triangle down = Sell signal (K crosses below D)
Settings:
- K, D, Smooth - Standard Stochastic parameters
- Signal Offset - Distance of signal arrows from the line
- Bullish/Bearish Colors - Customize ribbon and signal colors

Smart Margin Zone
SMART MARGIN ZONE - CME-BASED SUPPORT & RESISTANCE INDICATOR
TITLE FOR PUBLICATION:
Smart Margin Zone - CME Margin-Based Support and Resistance
CATEGORY:
Support and Resistance
SHORT DESCRIPTION (for preview):
Automatically plots margin zones based on CME Group requirements. These zones represent critical price levels where leveraged traders face margin calls, creating natural support and resistance through forced liquidations.
═══════════════════════════════════════════════════════════════
FULL DESCRIPTION FOR TRADINGVIEW:
═══════════════════════════════════════════════════════════════
📊 Smart Margin Zone - Professional Trading Zones Based on CME Data
This indicator automatically calculates and displays margin zones derived from official CME Group margin requirements. These zones represent critical price levels where traders using leverage receive margin calls, triggering forced position closures that create natural support and resistance levels.
═══════════════════════════════════════════════════════════════
🎯 CORE CONCEPT
═══════════════════════════════════════════════════════════════
When price reaches calculated margin zones, traders using 2:1 or 4:1 leverage on CME futures receive margin calls. Brokers automatically liquidate these positions, creating waves of buying or selling pressure that form strong support and resistance levels.
This is not theoretical - it's based on actual margin requirements from CME Group, the world's largest derivatives marketplace.
═══════════════════════════════════════════════════════════════
📐 CALCULATION METHODOLOGY
═══════════════════════════════════════════════════════════════
The indicator uses the following formula to calculate zone sizes:
Zone Size = (Margin Requirement / Tick Value) × Tick Size × 1.10
Where:
• Margin Requirement = Official CME initial margin (updated November 2024)
• Tick Value = Dollar value of minimum price movement
• Tick Size = Minimum price increment
• 1.10 = 10% buffer for realistic zone width
SUPPORTED INSTRUMENTS WITH CME DATA:
Currency Pairs:
• EURUSD: $2,100 margin → 0.0168 zone size
• GBPUSD: $1,800 margin → 0.0144 zone size
• AUDUSD: $1,300 margin → 0.0065 zone size
• NZDUSD: $1,100 margin → 0.0055 zone size
• USDJPY: $3,200 margin → custom calculation
• USDCAD: $950 margin → calculated
• USDCHF: $1,650 margin → calculated
Commodities:
• Gold (XAUUSD): $8,000 margin → 80 points zone size
• Silver (XAGUSD): $6,500 margin → calculated
• WTI Crude Oil: $4,500 margin → calculated
═══════════════════════════════════════════════════════════════
🔍 HOW IT WORKS
═══════════════════════════════════════════════════════════════
1. SWING POINT DETECTION
The indicator automatically identifies swing highs and swing lows using a configurable lookback period (default 10 bars). These become anchor points for zone calculations.
2. FIVE ZONE LEVELS
From each swing point, five zone levels are calculated:
• Zone 1/4 (25%) - First correction level
• Zone 1/2 (50%) - KEY ZONE for trend determination
• Zone 3/4 (75%) - Intermediate level
• Zone 1/1 (100%) - Full margin zone (strongest level)
• Zone 5/4 (125%) - Extended zone
3. TREND IDENTIFICATION
• Close above Zone 1/2 resistance = Bullish trend
• Close below Zone 1/2 support = Bearish trend
• Between zones = Range/consolidation
4. HISTORICAL CONTEXT
Current zones are displayed prominently with fills and labels. Historical zones appear as thin, semi-transparent lines for context without cluttering the chart.
═══════════════════════════════════════════════════════════════
⚙️ FEATURES
═══════════════════════════════════════════════════════════════
AUTOMATED CALCULATION:
✅ Auto-detection of swing highs and lows
✅ Real-time zone updates as new swings form
✅ CME margin data built-in for major instruments
✅ Manual override option for custom calculations
VISUAL CLARITY:
✅ Color-coded zones (red=resistance, green=support)
✅ Adjustable transparency for fills and lines
✅ Current zones bold with fills and price labels
✅ Historical zones thin and transparent
✅ Swing point markers show calculation origins
CUSTOMIZATION:
✅ Show/hide individual zone levels (1/4, 1/2, 3/4, 1/1, 5/4)
✅ Toggle historical zones on/off
✅ Adjustable lookback period (5-50 bars)
✅ Customizable colors for all elements
✅ Line width and transparency controls
✅ Zone extension options (none/right/both)
TREND ANALYSIS:
✅ Optional trend background coloring
✅ Customizable trend colors and transparency
✅ Real-time trend identification display
STATISTICS:
✅ Live statistics table showing:
- Current instrument
- Active zone size
- Calculation mode
- Current trend direction
- Number of zones displayed
ALERTS:
✅ Zone 1/2 breakout (up/down)
✅ Full margin zone 1/1 reached
✅ Customizable alert messages
═══════════════════════════════════════════════════════════════
📈 TRADING APPLICATIONS
═══════════════════════════════════════════════════════════════
ENTRY SIGNALS:
• Bounces from zone levels = potential entry points
• Zone 1/2 breakouts = trend continuation entries
• Zone rejections = reversal opportunities
RISK MANAGEMENT:
• Zone levels = logical stop-loss placement
• Zone 1/1 = maximum risk level
• Zone spacing = position sizing guide
PROFIT TARGETS:
• Next zone level = first target
• Zone 1/1 = full profit target
• Zone breakouts = extended targets
TREND CONFIRMATION:
• Price above Zone 1/2 resistance = confirmed uptrend
• Price below Zone 1/2 support = confirmed downtrend
• Consolidation between zones = wait for breakout
═══════════════════════════════════════════════════════════════
📚 USAGE INSTRUCTIONS
═══════════════════════════════════════════════════════════════
GETTING STARTED:
1. Add indicator to chart of any supported instrument
2. Zones automatically calculate and display
3. Adjust swing detection period if needed (default 10 works well)
4. Customize colors and visibility to your preference
OPTIMAL SETTINGS:
• Best timeframes: H1, H4, Daily, Weekly
• Default swing length (10) suitable for most markets
• Show 2-3 historical zones for context
• Enable swing point markers to see calculation origins
INTERPRETATION:
• Watch for price reactions at zone boundaries
• Strong bounces = respect for margin level
• Clean breaks = momentum continuation
• Multiple touches = zone strength confirmation
SET ALERTS:
• Zone 1/2 breakouts for trend entries
• Zone 1/1 reaches for profit-taking
• Custom alerts for your specific strategy
═══════════════════════════════════════════════════════════════
⚠️ IMPORTANT NOTES
═══════════════════════════════════════════════════════════════
DATA ACCURACY:
• CME margin requirements updated November 2024
• Margins change periodically - check CME Group website
• Manual mode available for latest margin data
• Indicator provides analysis tool, not financial advice
STATISTICAL PERFORMANCE:
• Historical data shows >60% probability of continued movement after Zone 1/2 breakout
• Zone effectiveness varies by market conditions
• Best results in trending markets with clear swings
LIMITATIONS:
• Margin requirements change - monitor CME updates
• Works best on liquid instruments with clear swings
• Not a standalone trading system
• Should be combined with additional analysis
═══════════════════════════════════════════════════════════════
🔧 METHODOLOGY CREDIT
═══════════════════════════════════════════════════════════════
This indicator is based on the margin zones concept developed by Alexander Bazylev (BTrade indicator for MetaTrader platforms).
The TradingView implementation has been completely rewritten with original enhancements:
• Multiple zone levels instead of single level
• Automatic swing point detection algorithm
• Direct CME data integration
• Historical zone visualization
• Advanced customization options
• Comprehensive statistics and alerts
All code is original and specifically designed for TradingView's Pine Script v5 environment.
═══════════════════════════════════════════════════════════════
💡 BEST PRACTICES
═══════════════════════════════════════════════════════════════
COMBINE WITH:
• Volume analysis for confirmation
• Trend indicators for direction bias
• Price action patterns at zones
• Higher timeframe analysis
AVOID:
• Trading against strong trends at minor zones
• Over-leveraging based solely on zone placement
• Ignoring broader market context
• Expecting perfect bounces every time
OPTIMIZE:
• Adjust swing length for different timeframes
• Shorter period (5-7) for intraday trading
• Longer period (15-20) for swing trading
• Test historical effectiveness on your instruments
═══════════════════════════════════════════════════════════════
📖 EDUCATIONAL VALUE
═══════════════════════════════════════════════════════════════
This indicator helps traders understand:
• How institutional margin requirements affect price
• Where forced liquidations create pressure
• Natural support and resistance formation
• Relationship between leverage and price levels
• Market structure and key technical levels
═══════════════════════════════════════════════════════════════
🔄 VERSION HISTORY
═══════════════════════════════════════════════════════════════
Version 1.0 (Initial Release):
• CME-based zone calculation for 10 instruments
• Automatic swing high/low detection
• 5 zone levels with customizable display
• Historical zones with transparency control
• Swing point markers
• Trend background indicator
• Live statistics table
• Multiple alert conditions
• Fully customizable colors and styles
• English language interface
═══════════════════════════════════════════════════════════════
📞 SUPPORT & FEEDBACK
═══════════════════════════════════════════════════════════════
Questions or suggestions? Leave a comment below!
If you find this indicator useful:
⭐ Please leave a like
💬 Share your experience in comments
🔔 Follow for updates and new indicators
═══════════════════════════════════════════════════════════════
⚖️ DISCLAIMER
═══════════════════════════════════════════════════════════════
This indicator is provided for educational and analytical purposes only. It is not financial advice and should not be the sole basis for trading decisions.
• Past performance does not guarantee future results
• Trading involves substantial risk of loss
• CME margin requirements subject to change
• Always do your own research and risk management
• Consult a financial advisor for investment advice
The creator is not responsible for any trading losses incurred through use of this indicator.

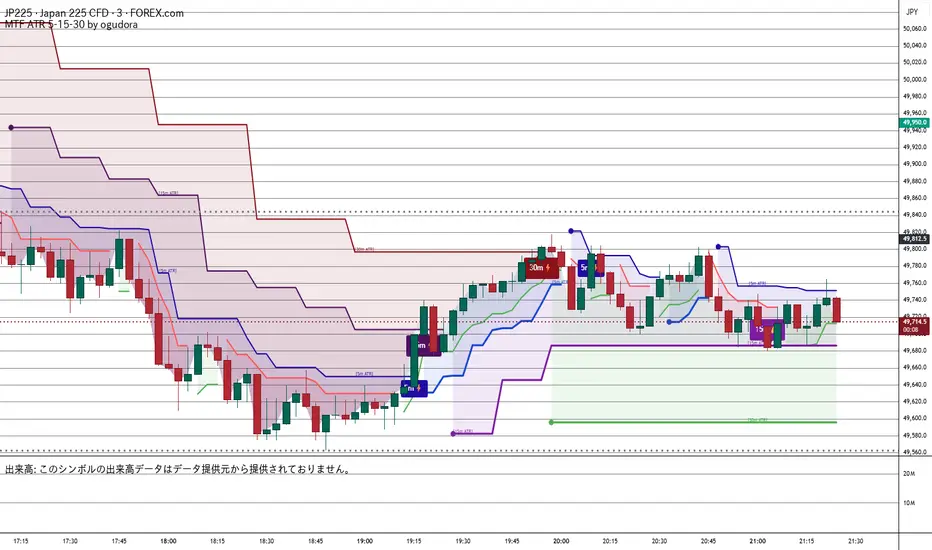
Multitime ATR (5m/15m/30m)Special thanks to Ogura
“This indicator displays ATR values for timeframes shorter than 30 minutes.”
“An ATR indicator designed to visualize volatility across 5-minute, 15-minute, and 30-minute timeframes.”
30分未満のATRを表示するインジケーターです。おぐさんありがとう。
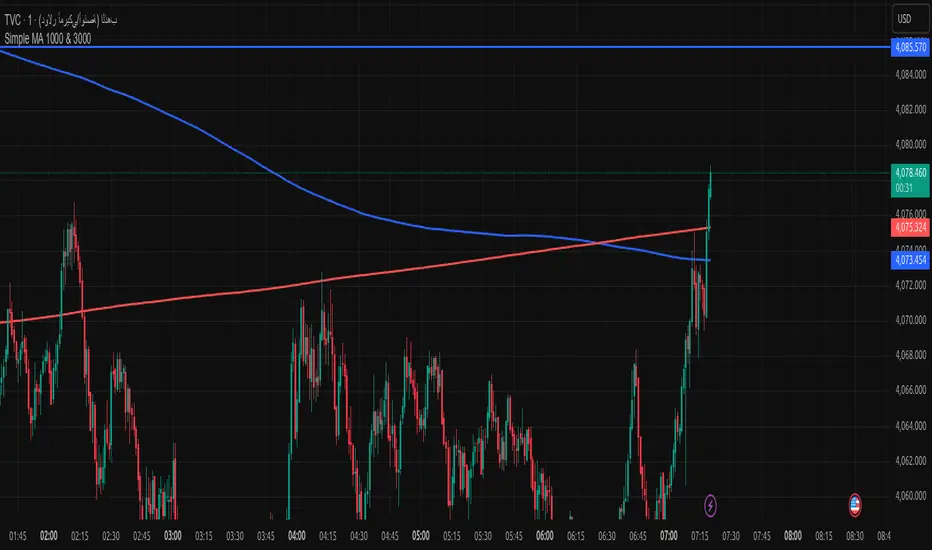
Simple MA 1000 & 3000when toche moving address add buy if from high or sell if from donw with sl 20pip
DANGHIEU EMA 34/89/200 Ribbon (Scaled HTF)📘 Indicator Description – EMA 34/89/200 Ribbon (Scaled HTF)
The EMA 34/89/200 Ribbon (Scaled HTF) indicator is designed to replicate higher-timeframe EMAs directly on your current chart without switching timeframes.
Using a precise HTF Scaling Algorithm, the script converts EMAs from 1H, 2H, 4H, 6H, 12H, 1D, and even 1W into equivalent lengths on lower timeframes—allowing traders to perform true multi-timeframe trend analysis on a single chart.
The 34-EMA and 89-EMA form a dynamic trend ribbon that changes color based on the relationship between the two moving averages. This helps traders quickly identify trend direction, momentum strength, and potential market reversals. The indicator also includes optional crossover markers (X symbols) to highlight bullish and bearish crossovers for cleaner signal recognition. EMA200 is included as the long-term trend anchor.
This tool is ideal for scalpers, day traders, and swing traders who require higher-timeframe context while trading lower-timeframe entries.
🟦 How to Use the Indicator
1. Choose the Higher Timeframe to Simulate
Use the “HTF to Simulate” dropdown to select the timeframe you want to emulate (e.g., 4H, 2H, 1D, 1W).
The script automatically scales the EMA lengths so they match the selected HTF.
2. Read the Ribbon for Trend Direction
Green Ribbon → EMA34 above EMA89 → Bullish momentum
Red Ribbon → EMA34 below EMA89 → Bearish momentum
The ribbon expands when momentum strengthens and contracts during consolidation.
3. Use EMA Crossovers as Signal Zones
Optional X markers highlight crossover points:
Bullish Crossover → EMA34 crosses above EMA89
Bearish Crossover → EMA34 crosses below EMA89
These crossovers often align with trend shifts or early momentum changes.
4. EMA200 as Trend Filter
The EMA200 acts as the macro trend filter:
Price above EMA200 → only consider long setups
Price below EMA200 → only consider short setups
Combining ribbon trend + EMA200 alignment improves signal accuracy.
5. Multi-Timeframe Trading Strategy
This indicator is powerful for:
Scalping with HTF bias
Pullback entry on lower timeframe during HTF trend
Identifying trend exhaustion when the ribbon flips
Confirming wave structure (Elliott Wave, Dow Theory)
Spotting strong momentum phases and squeeze zones
Example workflow:
Select 4H as HTF simulation.
Trade on 15m or 5m chart.
Enter only when price aligns with the HTF ribbon + EMA200 trend.
Use EMA crossovers as confirmation signals.
