Goldencrossover - ema 5 over 13&26Goldencrossover - ema 5 over ema13& ema26 over the same candle.
Both up and down. If there is any such crossover during the same candle, then the indicator will highlight.
"纳斯达克期货cfd"に関するスクリプトを検索

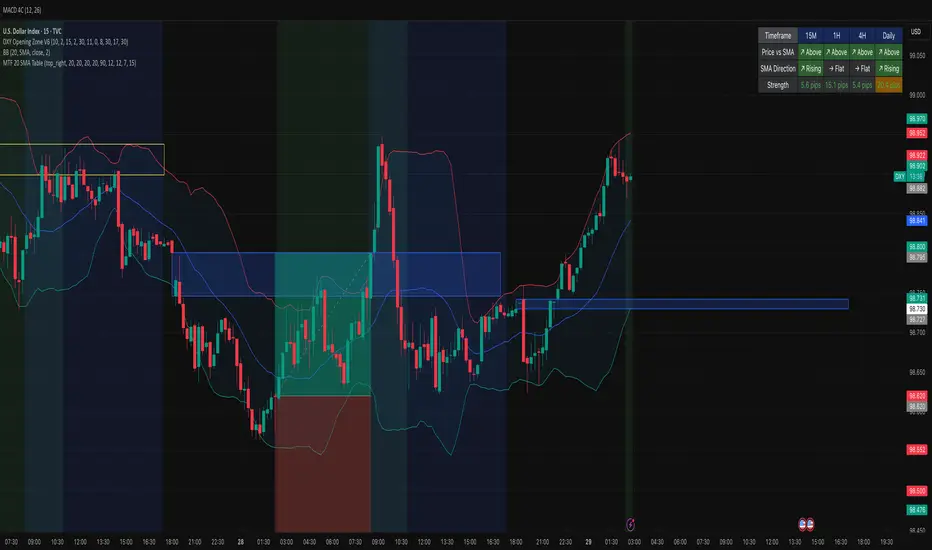
MTF 20 SMA Table - DXY**MTF 20 SMA Table - Multi-Timeframe Trend Analysis Dashboard**
**Overview:**
This indicator provides a comprehensive multi-timeframe analysis dashboard that displays the relationship between price and the 20-period Simple Moving Average (SMA) across four key timeframes: 15-minute, 1-hour, 4-hour, and Daily. It's designed to help traders quickly identify trend alignment and potential trading opportunities across multiple timeframes at a glance. It's definitely not perfect but has helped me speed up my backtesting efforts as it's worked well for me eliminating flipping back and forth between timeframes excpet when I have confluence on the table, then I check the HTF.
**How It Works:**
The indicator creates a table overlay on your chart showing three critical metrics for each timeframe:
1. **Price vs SMA (Row 1):** Shows whether price is currently above (bullish) or below (bearish) the 20 SMA
- Green = Price Above SMA
- Red = Price Below SMA
2. **SMA Direction (Row 2):** Indicates the trend direction of the SMA itself over a lookback period
- Green (↗ Rising) = Uptrend
- Red (↘ Falling) = Downtrend
- Gray (→ Flat) = Ranging/Consolidation
3. **Strength (Row 3):** Displays the distance between current price and the SMA in pips
- Purple background = Strong move (>50 pips away)
- Orange background = Moderate move (20-50 pips)
- Gray background = Weak/consolidating (<20 pips)
- Text color: Green for positive distance, Red for negative
**Key Features:**
- **Customizable Table Position:** Place the table anywhere on your chart (9 position options)
- **Adjustable SMA Lengths:** Modify the SMA period for each timeframe independently (default: 20)
- **Direction Lookback Settings:** Fine-tune how far back the indicator looks to determine SMA direction for each timeframe
- **Flat Threshold:** Set the pip threshold for determining when an SMA is "flat" vs trending (default: 5 pips)
- **DXY Optimized:** Calculations are calibrated for the US Dollar Index (1 pip = 0.01)
**Best Use Cases:**
1. **Trend Alignment:** Identify when multiple timeframes align in the same direction for higher probability trades
2. **Divergence Spotting:** Detect when lower timeframes diverge from higher timeframes (potential reversals)
3. **Entry Timing:** Use lower timeframe signals while higher timeframes confirm overall trend
4. **Strength Assessment:** Gauge how extended price is from the mean (SMA) to avoid overextended entries
**Settings Guide:**
- **SMA Settings Group:** Adjust the SMA period for each timeframe (15M, 1H, 4H, Daily)
- **SMA Direction Group:** Control lookback periods to determine trend direction
- 15M: Default 5 candles
- 1H: Default 10 candles
- 4H: Default 15 candles
- Daily: Default 20 candles
- **Flat Threshold:** Set sensitivity for "flat" detection (lower = more sensitive to ranging markets)
**Trading Strategy Examples:**
1. **Trend Following:** Look for all timeframes showing the same direction (all green or all red)
2. **Pullback Trading:** When Daily/4H are green but 15M/1H show red, wait for lower timeframes to flip green for entry
3. **Ranging Markets:** When multiple SMAs show "flat", consider range-bound strategies
**Important Notes:**
- This is a reference tool only, not a standalone trading system
- Always use proper risk management and combine with other analysis methods
- Best suited for trending instruments like indices and major forex pairs
- Calculations are optimized for DXY but can be used on other instruments (pip calculations may need adjustment)
**Credits:**
Feel free to modify and improve this code! Suggestions for enhancements are welcome in the comments.
---
**Installation Instructions:**
1. Add the indicator to your TradingView chart
2. Adjust the table position via settings to avoid overlap with price action
3. Customize SMA lengths and lookback periods to match your trading style
4. Monitor the table for timeframe alignment and trend confirmation
---
This indicator is published as open source for the community to learn from and improve upon. Happy trading! 📈
Z-Score Bands + SignalsZ-Score Statistical Market Analyzer
A multi-dimensional market structure indicator based on standardized deviation & regime logic
English Description
Concept
This indicator builds a statistical model of price behaviour by converting every candle’s movement into a Z-score — how many standard deviations each close is away from its moving average.
It visualizes the normal distribution structure of returns and provides adaptive entry signals for both Mean Reversion and Breakout regimes.
Rather than predicting price direction, it measures statistical displacement from equilibrium and dynamically adjusts the decision logic according to the market’s volatility regime.
⚙️ Main Components
Z-Score Bands (±1σ, ±2σ, ±3σ)
– The core structure visualizes volatility boundaries based on rolling mean and standard deviation.
– Price outside ±2σ often indicates statistical extremes.
Dual Signal Systems
Mean Reversion (MRL / MRS): when price (or return z-score) crosses back inside ±2σ bands.
Breakout (BOL / BOS): when price continues to expand beyond ±2σ.
Volatility Regime Classification
The indicator detects whether the market is currently in a low-vol or high-vol regime using percentile statistics of σ.
Low vol → Mean Reversion preferred
High vol → Breakout preferred
🧠 Adaptive Switches
A. Freeze MA/σ - Use previous-bar stats to avoid repainting and lag.
B. Confirm on Close - Only generate signals once the base-timeframe bar closes (eliminates look-ahead bias).
C. Return-based Signal - Use log-return Z-score instead of price deviation — normalizes volatility across assets.
D. Outlier Filter - Exclude bars with abnormal single-bar returns (e.g., >20%). Reduces false spikes.
E. Regime Gating - Automatically switch between Mean Reversion and Breakout logic depending on volatility percentile.
Each module can be toggled individually to test different statistical behaviours or tailor to a specific market condition.
📊 Interpretation
When the histogram of returns approximates a normal distribution, mean-reversion logic is often more effective.
When price persistently drifts beyond ±2σ or ±3σ, the distribution becomes leptokurtic (fat-tailed) — a breakout structure dominates.
Hence, this tool can help you:
Identify whether an asset behaves more “Gaussian” or “fat-tailed”;
Select the correct trading regime (MR or BO);
Quantitatively measure market tension and volatility clusters.
🧩 Recommended Use
Works on any timeframe and any asset.
Best used on liquid instruments (e.g., XAU/USD, indices, major FX pairs).
Combine with volume, sentiment or structural filters to confirm signals.
For strategy automation, pair with the companion script:
🧠 “Z-Score Strategy • Multi-Source Confirm (MRL/MRS/BOL/BOS)”.
⚠️ Disclaimer
This script is designed for educational and research purposes.
Statistical deviation ≠ directional prediction — use with sound risk management.
Past distribution patterns may shift under new volatility regimes.
==================================================================================
中文说明(简体)
概念简介
该指标基于价格的统计分布原理,将每根 K 线的波动转化为标准化的 Z-Score(标准差偏离值),用于刻画市场处于均衡或偏离状态。
它同时支持 均值回归(Mean Reversion) 与 突破延展(Breakout) 两种逻辑,并可根据市场波动结构自动切换策略模式。
⚙️ 主要功能模块
Z-Score 通道(±1σ / ±2σ / ±3σ)
用滚动均值与标准差动态绘制的统计波动带,价格超出 ±2σ 区域通常意味着极端偏离。
双信号系统
MRL / MRS(均值回归多空):价格重新回到 ±2σ 以内时触发。
BOL / BOS(突破延展多空):价格持续运行在 ±2σ 之外时触发。
波动率分层
自动识别市场处于高波动还是低波动区间:
低波动期 → 适合均值回归逻辑;
高波动期 → 适合突破趋势逻辑。
🧠 A–E 模块说明
A. 固定统计参数:使用上一根 K 线的均值和标准差,防止重绘。
B. 收盘确认信号:仅在当前时间框架收盘后生成信号,避免前视偏差。
C. 收益率信号模式:采用对数收益率的 Z-Score,更具普适性。
D. 异常波过滤:忽略单根极端波动(如 >20%)的噪声信号。
E. 波动率调节逻辑:根据市场处于高/低波动区间,自动切换 MRL/MRS 或 BOL/BOS。
📊 应用解读
如果收益率分布接近正态分布 → 市场倾向震荡,MRL/MRS 效果较佳;
若价格频繁偏离 ±2σ 或 ±3σ → 市场呈现“肥尾”分布,趋势延展占主导。
因此,该指标的核心目标是:
识别当前市场的统计结构类型;
根据波动特征自动切换交易逻辑;
提供结构化、可量化的市场状态刻画。
💡 使用建议
适用于所有时间框架与金融品种。
建议结合成交量或结构性指标过滤。
若用于策略回测,可搭配同名 “Z-Score Strategy • Multi-Source Confirm” 策略脚本。
⚠️ 免责声明
本指标仅用于研究与教学,不构成任何投资建议。
统计偏离 ≠ 趋势预测,实际市场行为可能在不同波动结构下改变。
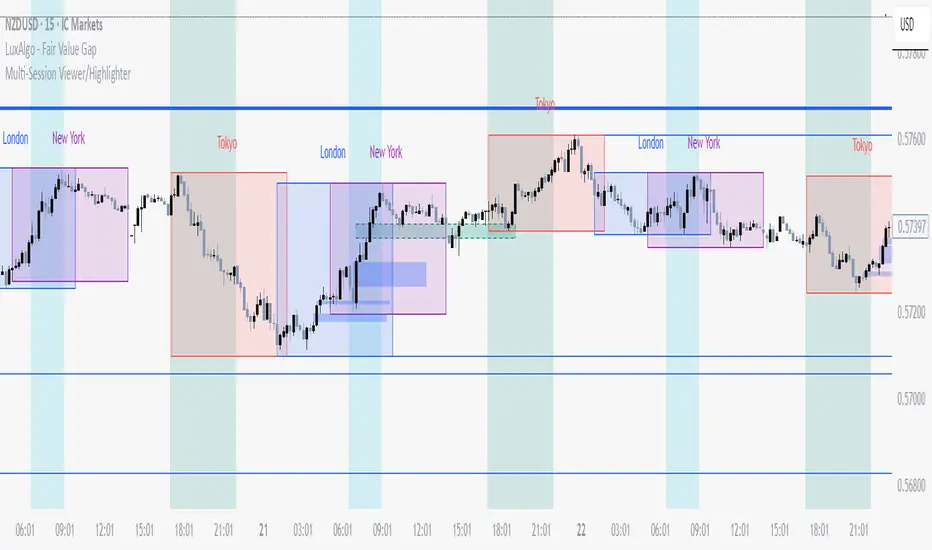
Multi-Session Viewer and AnalyzerFully customizable multi-session viewer that takes session analysis to the next level. It allows you to fully customize each session to your liking. Includes a feature that highlights certain periods of time on the chart and a Time Range Marker.
It helps you analyze the instrument that you trade and pinpoint which times are more volatile than others. It also helps you choose the best time to trade your instrument and align your life schedule with the market.
NZDUSD Example:
- 3 major sessions displayed.
- Although this is NZDUSD, Sydney is not the best time to trade this pair. Volatility picks up at Tokyo open.
- I have time to trade in the evening from 18:00 to 22:00 PST. I live in a different time zone, whereas market is based on EST. How does the pair behave during the time I am available to trade based on my time zone? Time Range Marker feature allows you to see this clearly on the chart (black lines).
- I have some time in the morning to trade during New York session, but there is no way I am waking up at 05:00 PST. 06:30 PST seems doable. Blue highlighted area is good time to trade during New York session based on what Bob said. It seem like this aligns with when I am available and when I am able to trade. Volatility is also at its peak.
- I am also available to trade between London close and Tokyo open on some days of the week, but... based on what I see, green highlighted area is clearly showing that I probably don't want to waste my time trading this pair from London close and until Tokyo open. I will use this time for something else rather than be stuck in a range.
Spooky Time (10/31/25) [VTB]Get ready to add some eerie fun to your charts this Halloween! "Spooky Time" is a lighthearted indicator that draws a festive, animated Halloween scene right on your TradingView chart. Perfect for traders who want to celebrate the spooky season without missing a beat on the markets. Whether you're analyzing stocks, crypto, or forex, this overlay brings a touch of holiday spirit to your setup.
#### Key Features:
- **Jack-o'-Lantern Pumpkin**: A detailed, glowing pumpkin with carved eyes, nose, and a jagged mouth. The eyes and mouth cycle through black (off), yellow, and red glows for a subtle animation effect, giving it that classic haunted vibe.
- **Flickering Candle**: A wax candle with a wick and an animated flame that shifts positions slightly across three frames, mimicking a real flickering light. The flame color changes between yellow, red, and orange for added dynamism.
- **Spider Web and Spider**: A spiral web with radial lines, complete with a creepy-crawly spider. The spider's legs animate with small movements, as if it's ready to pounce—perfect for that extra spooky touch!
- **Customization Options**: Toggle the "Desiringmachine" label on/off, choose its position on the chart (e.g., Bottom Center), and select the text color. The entire scene is positioned relative to the chart's open price and ATR for better scaling.
- **Animation Cycle**: The whole setup uses a simple 3-frame animation based on bar_index, making it feel alive without overwhelming your chart.
This indicator is purely visual and non-intrusive—it doesn't plot any trading signals or data, so it won't interfere with your strategies. Just add it to your chart for some Halloween cheer during your trading sessions!
**Date Note**: Timed for Halloween 2025 (10/31/25)—feel the spooky energy!
**Happy Halloween!!!** 🎃👻🕸️

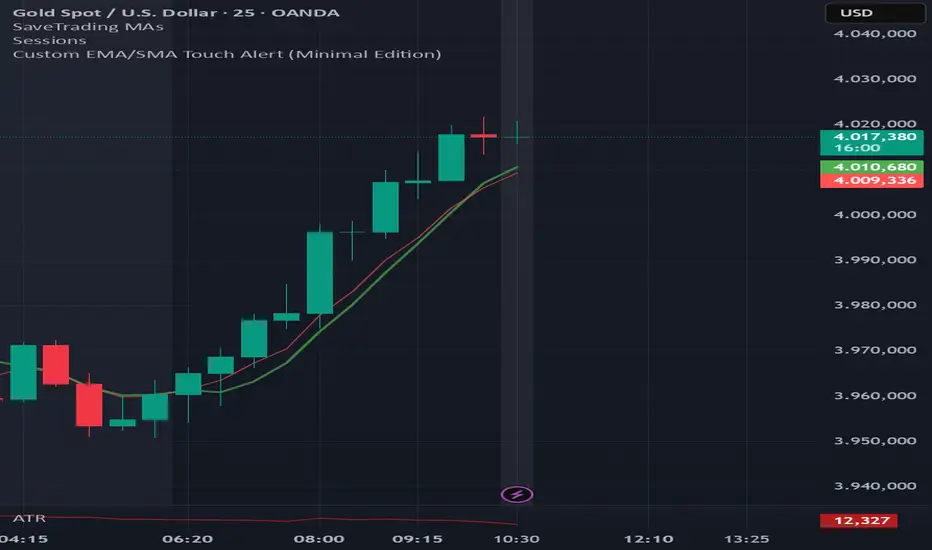
EMA6 or SMA6 Touch AlertThis script monitors the market and notifies you whenever the price touches either the 6-period EMA or the 6-period SMA.
It helps identify potential pullbacks, reaction points, or entry zones, as price interaction with these moving averages often signals short-term market shifts.
What the script does:
Calculates the EMA 6 and SMA 6
Detects if price touches either moving average within the candle
Plots both lines on the chart for visibility
Allows you to set alerts to receive automatic notifications
Best suited for:
Scalping
Day Trading
Pullback Entries
Short-term trend reactions


3 Lines RCI + Psy + ADX Title: 3 Lines RCI + Psy + ADX (Integrated)
Description:
An all-in-one indicator combining RCI (short, mid, long), Psychological Line (Psy), and ADX.
RCI: Shows overbought/oversold zones and trend potential.
Psy: Measures market sentiment with adjustable thresholds.
ADX: Indicates trend strength with color-coded levels.
Use it to identify reversals, confirm trend strength, and improve entry/exit timing. Fully customizable for different trading styles.

Mean Reversion Trading V1Overview
This is a simple mean reversion strategy that combines RSI, Keltner Channels, and MACD Histograms to predict reversals. Current parameters were optimized for NASDAQ 15M and performance varies depending on asset. The strategy can be optimized for specific asset and timeframe.
How it works
Long Entry (All must be true):
1. RSI < Lower Threshold
2. Close < Lower KC Band
3. MACD Histogram > 0 and rising
4. No open trades
Short Entry (All must be true):
1. RSI > Upper Threshold
2. Close > Upper KC Band
3. MACD Histogram < 0 and falling
4. No open trades
Long Exit:
1. Stop Loss: Average position size x ( 1 - SL percent)
2. Take Profit: Average position size x ( 1 + TP percent)
3. MACD Histogram crosses below zero
Short Exit:
1. Stop Loss: Average position size x ( 1 + SL percent)
2. Take Profit: Average position size x ( 1 - TP percent)
3. MACD Histogram crosses above zero
Settings and parameters are explained in the tooltips.
Important
Initial capital is set as 100,000 by default and 100 percent equity is used for trades


Forex Dynamic Lot Size CalculatorForex Dynamic Lot Size Calculator for Forex. Works on USD Base and USD Quote pairs. Provides real-time data based on stop-loss location. Allows you to know in real-time how the number of lots you need to purchase to match your risk %.
Number of Lots is calculated based on total risk. Total risk is calculated based on Stop-Loss + Commission + Spread Fees + Slippage measured in pips. Also includes data such as break-even pips, net take profit, margin required, buying power used, and a few others. All are real-time and anchored to the current price.
The intention of creating this indicator is to help with risk management. You know exactly how many lots you need to get this very moment to have your total risk at lets say $250, which includes commission fees, spread fees, and slippage.
To put it simply, if I was to enter the trade right now and willing to risk exactly $250, how many lots will I need to get right this second?
---
- To use adjust Account Settings along with other variables.
- Stop Loss Mode can be Manual or Dynamic. If you select Dynamic, then you will have to adjust Stop Loss Level to where you can see the reference line on the screen. It is at 1.1 by default. Just enter current price and the line will appear. Adjust it by dragging it to where you want your stop loss to be.
- Take Profit Mode can also be Manual or Dynamic. I just keep my TP at Manual and use Quick Access to set Quick RR levels.
- Adjust Spreads and Slippage to your liking. I tried to have TV calculate current spread, but it seem like it doesn't have access to real-life data for me like MT5 does. I just use average instead. Both are optional, depending on your broker and type of account you use.
- Pip Value for the current pair, Return on Margin, and Break-even line can be turned on and off, based on your needs. I just get the Break-even value in pips from the pannel and use that as reference where I need to relocate my stop loss to break-ever (commission + spreds + slippage).
- Panel is fully customizable based on your liking. Important fields are highlighted along with reference lines.

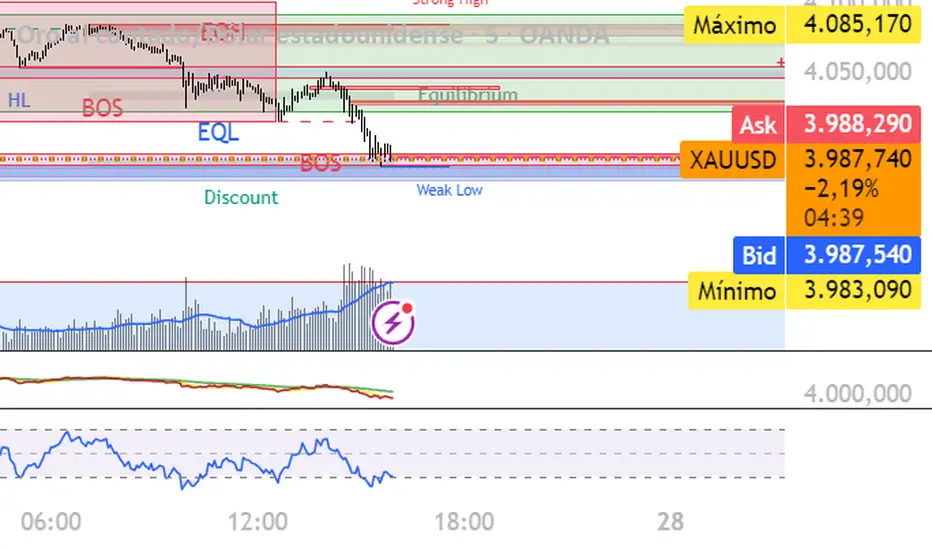
Pre-London & London Session (Auto DST) MMMThis indicator automatically marks the Pre-London and London Open sessions for any trading day, with full U.S. Daylight Saving Time (DST) adjustment.
It’s ideal for traders backtesting Gold (XAUUSD) or other pairs sensitive to London liquidity, as it dynamically shifts between UTC-4 and UTC-5 to stay perfectly aligned with institutional session timing.
Features:
🕑 Auto-detects whether the date falls under U.S. Daylight or Standard Time
🟧 Highlights Pre-London session (2 a.m.–3 a.m. EDT / 1 a.m.–2 a.m. EST)
🟩 Highlights London session (3 a.m.–5 a.m. EDT / 2 a.m.–4 a.m. EST)
⚙️ No manual adjustments needed — fully automatic for any backtest date
📈 Perfect for ICT, Smart Money, and liquidity-based session strategies
Recommended settings:
Chart timezone: New York
Works on all symbols and timeframes


Iriza4 -DAX EMA+HULL+ADX TP40 SL205 MIN SKALP. Additional filters improve accuracy: the strategy blocks trades after too many consecutive bullish or bearish candles (streak filter) and ignores signals when price is too far from the EMA (measured by ATR distance).
Each position uses a fixed risk-to-reward ratio of 1 : 2 with clear stop-loss and take-profit targets, without partial exits or breakevens. The goal is to identify clean pullbacks inside strong trends and filter out late or exhausted entries

Cruce TEMA SMMA con Alarma a 12 Barras LLUCes un cruce de TEMA SMMA, luego del cruce contar 12 barras controladas por otros
Quantum Portfolio vs S&P 500 (Base: May 2, 2021)This script compares the performance of a custom Quantum Portfolio — a weighted basket of quantum computing, semiconductor, and cybersecurity stocks — against the S&P 500 Index, with both series rebased to 100 on May 2 2021.
It provides a clear, normalized view of cumulative returns, allowing you to visualize portfolio outperformance or underperformance relative to the broader market benchmark.

Quantum Portfolio vs NASDAQ (Base: May 2, 2021)This custom Pine Script indicator tracks and compares the cumulative performance of a multi-asset “Quantum Portfolio” against the NASDAQ 100 benchmark, rebased to a common starting point on May 2, 2021.
Both series are normalized to a base value of 100 on that date, allowing direct visual comparison of percentage growth or decline over time.

Renko ATR Trend + SMA Indicator by YCGH Capital🧭 Overview
The Renko ATR Trend + SMA Indicator is a trend-following tool designed for chart trading.
It combines Renko-style price movement logic (based on ATR) with a Simple Moving Average (SMA) filter to identify sustained bullish or bearish phases on any timeframe.
It plots a color-coded trend line directly on the price chart — green for bullish trends, red for bearish — and maintains a single active state (no repeated buy/sell signals) until the opposite condition appears.
⚙️ How It Works
1️⃣ Renko ATR Engine
Instead of using fixed box sizes like classic Renko charts, this indicator builds synthetic Renko movement based on ATR (Average True Range) of a chosen timeframe.
It pulls OHLC data from your selected Renko Source Timeframe (for example, 60-minute candles).
It calculates an ATR brick size — representing the minimum price move needed for a new Renko brick.
When price moves by at least one ATR in the opposite direction, it flips the trend.
This filters out small fluctuations and captures the underlying directional bias.
2️⃣ SMA Filter
A Simple Moving Average (SMA) acts as a trend confirmation filter.
Only when Renko direction aligns with the price relative to the SMA, a trend signal activates.
BUY → Renko uptrend + price above SMA
SELL → Renko downtrend + price below SMA
3️⃣ Stateful Signal Logic
Unlike typical indicators that spam multiple buy/sell shapes:
This version holds one persistent signal (Buy or Sell)
The state continues until an opposite signal is confirmed
No “continuation” arrows — clean and minimal trend visualization
🎨 Visuals
Element Meaning
🟩 Green Renko Line Active Bullish Trend
🟥 Red Renko Line Active Bearish Trend
⚪ Gray Line Neutral / Waiting phase
🟡 Yellow Line SMA (trend filter)
📍 Label (Buy Active / Sell Active) Displays the current market bias
🔧 Inputs
Input Description
Renko Source Timeframe The timeframe from which Renko data is calculated (e.g., 60 = 1h candles).
ATR Period Determines brick size sensitivity (lower = more responsive, higher = smoother).
SMA Length Moving Average length used as a directional filter.
💡 How Traders Use It
Trend Confirmation:
Use green/red Renko line to stay aligned with the dominant market move.
Entry Timing:
Enter trades when a new Renko direction is confirmed along with SMA alignment.
Exit or Reverse:
Exit long when a red line (Sell Active) appears, and vice versa.
Combine with Price Action:
Add support/resistance or volume analysis for confirmation.

XAUUSD 5m — NY Supertrend+RSI Optimizer (1:2 RR) — $240k/orderThis strategy is built for XAUUSD (Gold) on the 5-minute timeframe, focusing exclusively on the New York trading session (08:00–17:00 NY time) — the most volatile and liquid hours of the day.
It combines a Supertrend trend filter with RSI momentum signals to identify high-probability entries, using a 1:2 risk–reward ratio for disciplined trade management.
🧠 Strategy Logic:
Buy Condition: RSI crosses above 55 while Supertrend indicates an uptrend
Sell Condition: RSI crosses below 45 while Supertrend indicates a downtrend
Session Filter: Trades only between 08:00 → 17:00 New York time
Risk/Reward: 1:2 (Take-Profit = 2× Stop-Loss distance from Supertrend line)
Position Size: $240,000 notional per order
Auto-Exit: Closes all trades at NY session end
⚡ Highlights:
Targets NY session volatility
Combines trend + momentum for cleaner entries
Strict 1:2 RR for consistent outcomes
Avoids overnight exposure
⚠️ Disclaimer:
This script is intended for educational and research purposes only.
Past performance is not indicative of future results.
Always forward-test on demo before using live capital.

XAUUSD 5m — CET 13:00→01:00 Supertrend + RSI (1:2 RR) — $240KThis strategy is designed for XAUUSD (Gold) on the 5-minute chart, optimized for trading during the most active hours (13:00–01:00 CET).
It combines a Supertrend direction filter with RSI crossovers for precise entries, and applies a 1:2 risk–reward ratio for consistent risk management.
🧠 Logic Overview:
Buy Signal: RSI crosses above 55 while Supertrend is bullish
Sell Signal: RSI crosses below 45 while Supertrend is bearish
Trading Hours: 13:00 → 01:00 CET (corresponding to 07:00 → 19:00 New York time)
Risk Management: Fixed 1:2 RR (TP = 2× SL distance from Supertrend line)
Session Management: Automatically closes all trades after 01:00 CET
Order Size: $240,000 notional exposure per position
💡 Best used for:
Scalping or intraday trading on XAUUSD during high-volatility hours.
The setup works best when combined with strong price action or volume confirmation.
⚠️ Disclaimer:
This script is for educational and testing purposes only.
Past performance does not guarantee future results.
Always test on demo before using live funds.

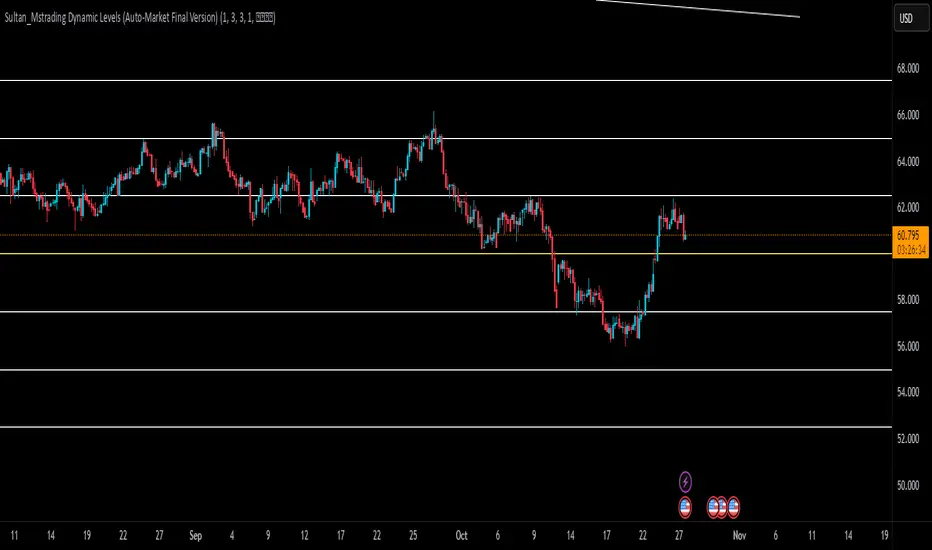
Sultan_Mstrading Dynamic Levels (Auto-Market Final Version)The Sultan_Mstrading Dynamic Levels indicator automatically generates dynamic support and resistance levels based on the market type or trading symbol (such as Gold, Bitcoin, Indices, Oil, or Forex pairs).
It plots multiple levels above and below the current price with adjustable spacing, and automatically highlights the nearest level to the current price for quick visual reference
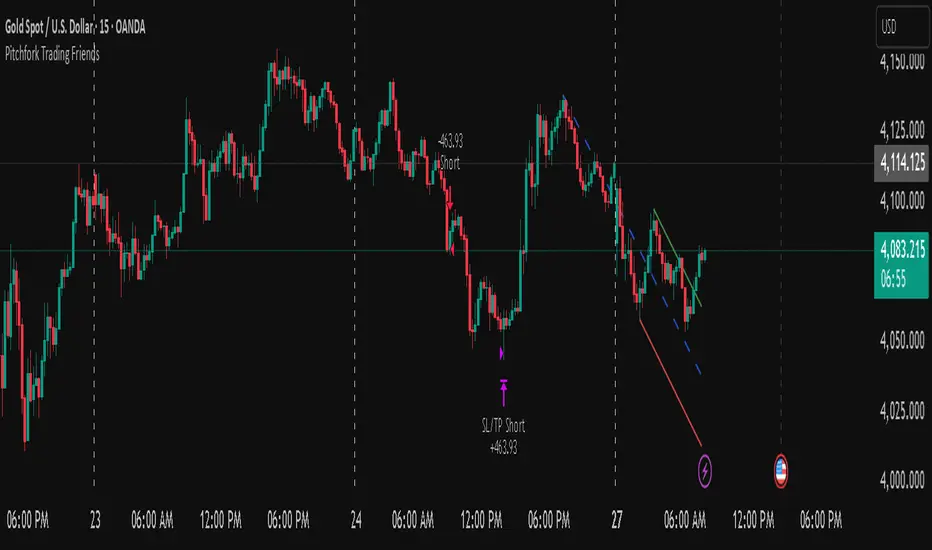
Pitchfork-Trading Friendsuses the pitchfork to give entry and exit zones, and gives a net overall summary for a beginner trader to enter into.