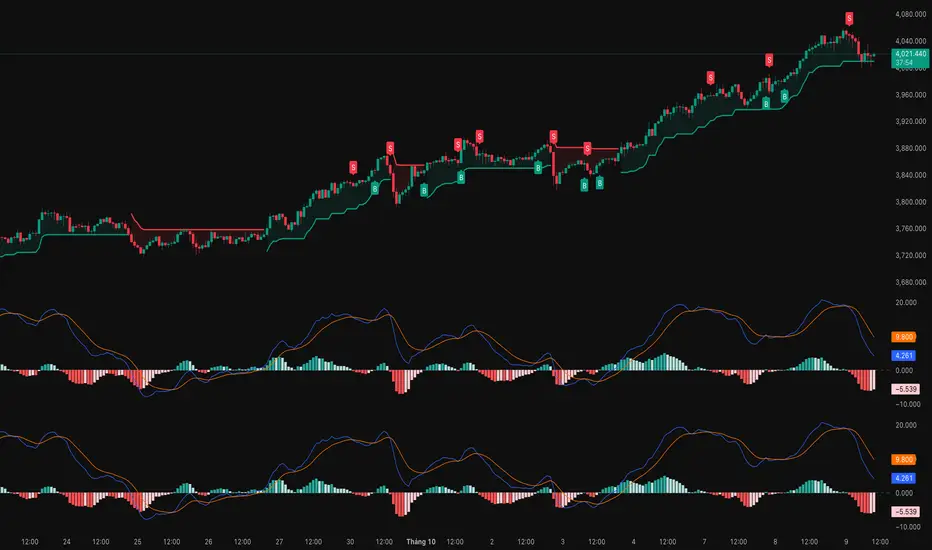
My EMA IndicatorMy Absolutely Profitable Indicator
It can be use when ema9 crosses ema100 and so on...
Use it with Volume Oscillator...
"纳斯达克期货cfd"に関するスクリプトを検索

Simple RSIThis script is just a fun little project I decided to do. It serves as a way for me to practice my coding and was not made with the intent of making money.

- Standardized Money Flow Index with Multi-MA and BB OverlayThis custom Money Flow Index (MFI) script enhances the standard MFI by introducing multiple layers of configurability, statistical normalization, and visual clarity. It begins with the traditional MFI calculation using the average price, hlc3, and a user-defined length, then offers the option to standardize the output. Standardization transforms the MFI into a z-score by subtracting a rolling mean and dividing by a rolling standard deviation, making the indicator statistically interpretable across different assets, timeframes, and volatility regimes. When standardization is active, the overbought and oversold thresholds shift from the conventional 80 and 20 to +2 and –2, aligning them with standard deviation boundaries and improving signal clarity in volatile environments.
Beyond standardization, the script introduces a robust smoothing engine. Users can choose from several moving average types, including SMA, EMA, SMMA (RMA), WMA, and VWMA, to reduce noise and highlight trend shifts. A particularly advanced option is the “SMA + Bollinger Bands” mode, which overlays volatility envelopes around the smoothed MFI using a user-defined standard deviation multiplier. This feature helps traders identify when the MFI is unusually high or low relative to its recent behaviour, adding a volatility-adjusted layer of insight, especially useful in momentum or mean-reversion setups.
Visually, the script is designed for clarity, modularity, and flexibility. It plots the raw or standardized MFI in purple, overlays the smoothed version in yellow if enabled, and adds green Bollinger Bands when selected. It also includes horizontal reference lines for overbought, oversold, and midpoint levels, which dynamically adjust based on whether standardization is active. A shaded background between the overbought and oversold lines further enhances readability, helping traders quickly assess momentum extremes and potential inflection zones.
Compared to the standard MFI, which offers a fixed calculation, limited visual feedback, and no statistical context, this enhanced version is modular, customizable, and statistically grounded. It allows traders to tailor the indicator to their strategy, whether they prefer raw signals, smoothed trends, or volatility-adjusted extremes. These enhancements make it a powerful building block for more sophisticated signal engines, especially when combined with filter gating, persistent state logic, or multi-indicator overlays.

Confluence Zone BuilderWhat It Does
The Confluence Zone Builder is a technical analysis indicator that identifies high-probability price levels by detecting where multiple technical factors align (converge) at the same price area. These "confluence zones" represent levels where price is statistically more likely to react - either bouncing (support/resistance) or breaking through (breakout targets).
How It Works
1. Multi-Factor Analysis
The indicator calculates key technical levels from various sources:
Fibonacci Retracements (23.6%, 38.2%, 50%, 61.8%, 78.6%) - Support/resistance levels based on recent price swings
Fibonacci Extensions (127.2%, 141.4%, 161.8%, 200%, 261.8%) - Breakout targets beyond the current range (both bullish and bearish)
Pivot Points (Classic pivots: P, R1-R3, S1-S3) - Daily/weekly reference points traders watch
Moving Averages (EMA 20, 50 and SMA 100, 200) - Dynamic support/resistance that institutions track
VWAP - Volume-weighted average price, popular among institutional traders
Psychological Levels - Round numbers that attract orders
Previous Period Levels - Prior day/week high, low, and close
2. Proximity Clustering
When multiple factors fall within a defined proximity range (default 0.5%), they're grouped together into a single "confluence zone." This prevents cluttering the chart with dozens of individual lines.
3. Weighted Scoring System
Not all technical factors are equal. The indicator assigns importance weights:
Key Fibonacci levels (61.8%) and major MAs (200, 50) get higher weights (2.0-2.5x)
Pivot points and VWAP get medium weights (1.5x)
Minor factors get lower weights (1.0x)
The total score reflects both the number of factors and their importance.
4. Historical Validation
The indicator analyzes the last 50 bars (customizable) to track:
Touches: How many times price reached each zone
Rejections: Times price bounced off the zone (✅)
Breaks: Times price broke through the zone (❌)
Win Rate: Percentage of times the zone held (rejections ÷ touches)
5. Dynamic Adjustment
Zones aren't static - they adapt based on how price interacts with them:
Strengthens (+0.5 per rejection, +0.2 per touch): Zones that repeatedly hold become more important
Weakens (-0.8 per break): Zones that fail to hold lose credibility
Visual Indicators:
Thick solid lines = Strong zones (more rejections than breaks)
Dashed lines = Weak zones (more breaks than rejections)
Color-coded by score: Blue (low), Yellow (medium), Red (high)
What You Gain From Using It
For Support/Resistance Trading:
High-probability entries: Enter at zones with high confluence scores and strong historical win rates
Better risk management: Place stops beyond strong confluence zones that are likely to hold
Reduced false signals: Multi-factor confirmation reduces reliance on single indicators
For Breakout Trading:
Target identification: Fibonacci extensions provide profit targets beyond current ranges
Breakout confirmation: Weak zones (dashed lines, low win rates) are easier to break - ideal for breakout entries
False breakout avoidance: Strong zones (thick lines, high win rates) require more confirmation before entering
For Position Management:
Exit planning: Take profits at high-confluence zones ahead
Stop placement: Use strong zones as logical stop-loss levels
Trade filtering: Higher probability setups occur at stronger zones
Key Advantages:
Objective confluence detection - No manual line drawing needed
Data-driven validation - Historical performance shows which zones actually matter
Adaptive intelligence - Zones strengthen/weaken based on real price action
Clean visualization - Top zones only, with compact labels showing score and factors
Customizable - Adjust weights, components, and thresholds to your trading style
Bottom Line:
Instead of guessing which technical level matters most, this indicator does the heavy lifting - analyzing multiple factors, validating them historically, and highlighting only the zones where price is most likely to react. It's like having confluence analysis automated with statistical backing.

SJA WINFUT B3-10
INDICATOR FOR WINFUT B3 – 5-minute chart.
This indicator was designed to trade the Bovespa index futures contract (WINFUT) on the 5-minute chart.
It integrates technical analysis and macroeconomic context elements.
It combines several indicators in which the system calculates a score weighted by color and intensity for each indicator, generating a metric called “STRENGTH %,” which reflects the dominance of buyers (green), sellers (red), or sideways movement (orange) at the moment.
The calculation is adapted to market hours:
Between 9:00 a.m. and 9:59 a.m., it considers only the available indicators; after 10:00 a.m., it uses all data.
The panel displays real-time information, including divergences between strength and price, providing robust decision support for short-term operations on the mini index.
Buying trend.
The more green indicators (at the top of the panel) and dark blue indicators (at the bottom of the panel) and the higher the strength percentage, the greater the probability of buying.
Selling trend.
The more red indicators (at the top of the panel) and dark blue indicators (at the bottom of the panel) and the higher the strength percentage, the greater the probability of selling.
Translated with DeepL.com (free version)

Dynamic 21 SMA Zone S/R (Weekly and 2-Day)This custom indicator creates a dynamic support and resistance zone based on the 21-period Simple Moving Average (SMA) from the weekly timeframe and the 21-period SMA from the 2-day timeframe. The zone is visible and functional across all chart timeframes, adapting seamlessly to provide multi-timeframe insights.
Color Logic:
Green: When the current price is fully above the upper boundary of the zone, indicating potential bullish strength or a support level.
Gray: When the price is fully below the lower boundary, signaling potential bearish pressure or a resistance level.
Light Blue: When the price is within the zone (between the two SMAs), representing a neutral "no man's land" where the market is indecisive.
As the two SMAs converge or diverge, the zone naturally thins or widens, visually reflecting changes in market momentum—such as a thinning green zone during a potential reversal. Ideal for higher-timeframe swing trading to identify key levels, this indicator is also useful on lower timeframes for gauging the relative position of these SMAs, helping traders align short-term moves with broader trends.

Inverse VIX / Custom Inverse Line🎯 Main Idea
This indicator creates a line that moves opposite to the VIX (Volatility Index) — or any symbol you choose.
When VIX rises (fear increases), → this line goes down.
When VIX falls (market calm), → this line goes up.
It helps you visually understand market sentiment — calm periods (bullish) vs fear periods (bearish).
⚙️ Input Settings
Setting Description
Symbol to invert The symbol to invert. Default is CBOE:VIX.
Inverse mode The method used to invert the values. There are 3 options:
① Negate Simply flips the sign (multiplies by -1). Very straightforward.
② Reciprocal Uses the mathematical inverse (1 ÷ value). High values become smaller, and vice versa.
③ Inverse Normalized The most useful mode 🔥 — normalizes values between 0–100 and flips them, similar to an RSI.
Normalization lookback How many bars to use for normalization (default 252 = roughly one trading year).
Smoothing (SMA) Number of bars for smoothing (makes the line smoother).
Use log for reciprocal Uses logarithmic scaling to stabilize big swings.
Plot color / width Customize the line’s color and thickness.
Show original source If enabled, shows the original VIX line for comparison.
📈 How It Works
The script fetches the close price of the VIX (or your chosen symbol).
It applies the selected inversion method.
The inverted line is plotted on the chart.
In “Inverse Normalized” mode:
The range is 0–100.
Values above 75 = high optimism (market often overheated).
Values below 25 = high fear (potential buying opportunity).
A middle line at 50 marks neutral sentiment.
⚠️ Alerts
The indicator includes two default alerts when using “Inverse Normalized” mode:
🔔 Above 75: Market showing strong optimism (potential top or correction zone).
🔔 Below 25: Market showing fear (potential bottom or buy signal).
🧠 How to Use It
Use it on daily or weekly charts for clearer signals.
Compare it with SPX or NASDAQ:
When the Inverse VIX line rises, markets often go up.
When it falls, markets usually drop or consolidate.
Combine it with other indicators (e.g., RSI, MACD) for confirmation.

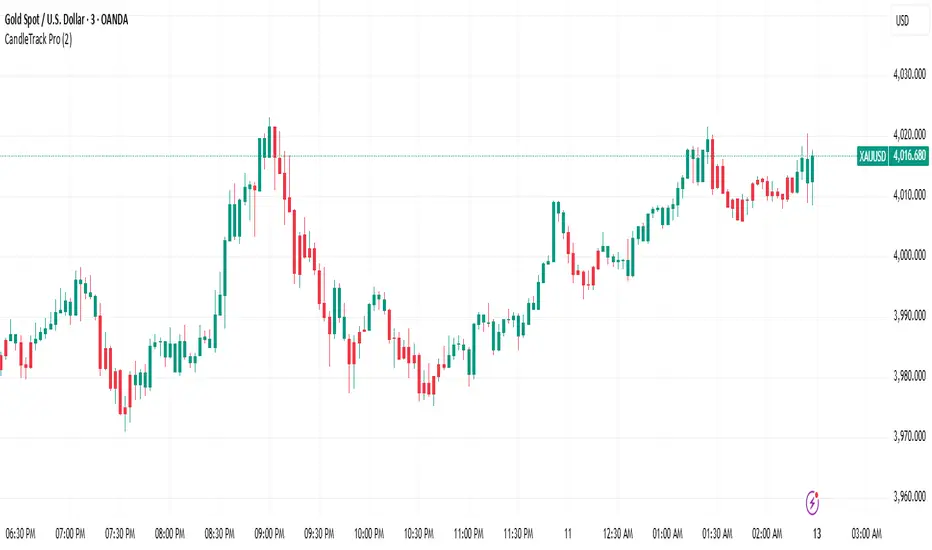
CandleTrack Pro | Pure Price Action Trend Detection📖 CandleTrack Pro | Pure Price Action Trend Detection
CandleTrack Pro is a clean, non-repainting trend detection tool built purely on price action logic.
It uses a dynamic ATR-based trailing system to detect trend shifts while keeping the chart visually simple.
🧠 How It Works
Tracks volatility using ATR.
Identifies trend shifts when price crosses trailing stops.
Highlights bullish and bearish bars visually for easy reading.
⚙️ Inputs
ATR Sensitivity: Controls how fast the trend adapts.
Use High/Low for Stop: Enables candle wick–based structure tracking.
📊 Ideal For
Traders who want a minimalist price action view with clear trend direction — no clutter, no lagging oscillators.
⚠️ Disclaimer
This script is for educational and technical analysis purposes only.
It is not financial advice. Always confirm setups using your own judgment and risk management.
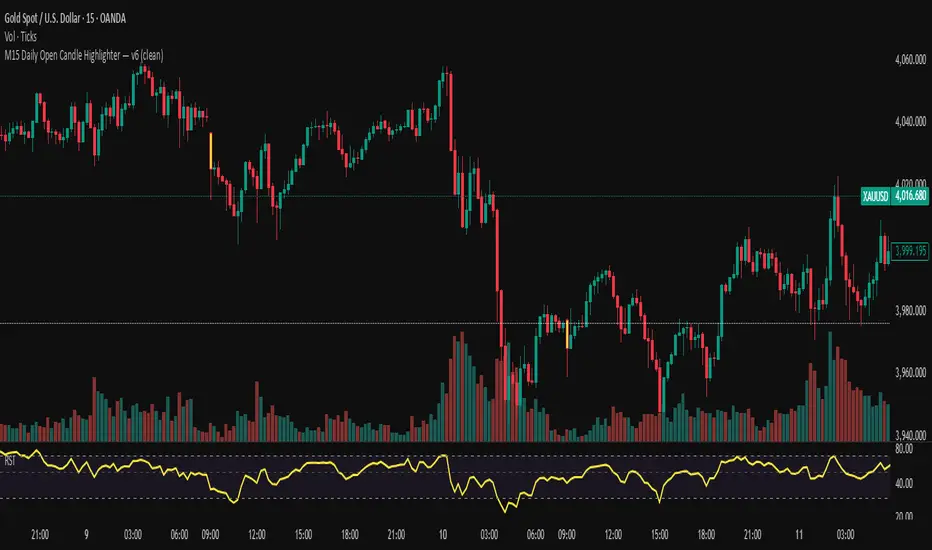
M15 Daily Open Candle Highlighter — v6Tô màu cây nến 15 phút đầu tiên của mỗi NGÀY giao dịch (theo múi giờ của symbol).
Orderflow Label with OffsetThis Pine Script automatically displays orderflow labels on the chart to visualize the current market structure and potential breakout or reversal zones.
It compares the current candle’s high and low with those of the previous cycle (e.g., 90 minutes) and places descriptive labels that highlight possible bullish or bearish behavior.
Functionality & Logic (Step-by-step explanation)
Inputs:
cycleLength: Defines the duration of one “cycle” in minutes (for example, 90 minutes).
labelXOffset: Moves the label a few bars to the right, so it doesn’t overlap the current candle.
labelStyleOffset: Controls whether labels appear pointing to the right or left side of the chart.
Previous Cycle:
The script uses request.security to retrieve the high and low from the previous cycle timeframe.
These act as reference points (similar to key levels or market structure highs/lows).
Current Candle:
The script reads the current bar’s high, low, and close values for comparison.
Orderflow Conditions:
bullSupport: The current high and close are both above the previous high → bullish breakout (strong continuation).
bullReject: The high breaks above the previous high but closes below → bullish rejection / possible top.
bearRes: The low and close are both below the previous low → bearish breakdown (continuation to downside).
bearReclaim: The low goes below the previous low but closes above → bearish reclaim / possible reversal.
Label Logic:
Before creating a new label, the previous one is deleted (label.delete(flowLbl)) to avoid clutter.
The label’s X position is shifted using xPos = bar_index + labelXOffset.
The style (left/right) is set based on the user’s preference.
Displayed Labels:
🟢 Bullish Breakout → price closes above the previous cycle high.
🟠 Bullish Rejection → fake breakout or possible top.
🔴 Bearish Breakdown → price closes below the previous cycle low.
🟡 Bearish Reclaim → failed breakdown or potential trend reversal.
⚪ Neutral (Wait) → no clear signal, advises patience and watching for setups (like CHoCH or FVGs).
Visual Behavior:
The labels appear slightly to the right of the bar for better visibility.
The color and text alignment dynamically adjust depending on whether the label is pointing left or right.

Fractals & SweepThe Fractals & Sweep indicator is designed to identify key market structure points (fractals) and detect potential liquidity sweeps around those areas. It visually highlights both Bill Williams fractals and regular fractals, and alerts the user when the market sweeps liquidity above or below the most recent fractal levels.
Fractal Recognition:
Detects both bullish (low) and bearish (high) fractals on the price chart.
Users can choose between:
Bill Williams fractal logic (default), or
Regular fractal logic (when the “Filter Bill Williams Fractals” option is enabled).
Fractals are plotted directly on the chart as red downward triangles for highs and green upward triangles for lows.
Fractal Tracking:
The indicator stores the most recent high and low fractal levels to serve as reference points for potential sweep detection.
Sweep Detection:
A bearish sweep is triggered when the price wicks above the last fractal high but closes below it — suggesting a liquidity grab above resistance.
A bullish sweep is triggered when the price wicks below the last fractal low but closes above it — suggesting a liquidity grab below support.
When a sweep occurs, the indicator draws a horizontal line from the previous fractal point to the current bar.
Alert System:
Custom alerts notify the trader when a bearish sweep or bullish sweep occurs, allowing for timely reactions to potential reversals or liquidity traps.

OBR 15min Session Opening Range Breakout + Volume Trend DeltaMLGOBR 15min Session Opening Range Breakout + Volume Trend DeltaMLG

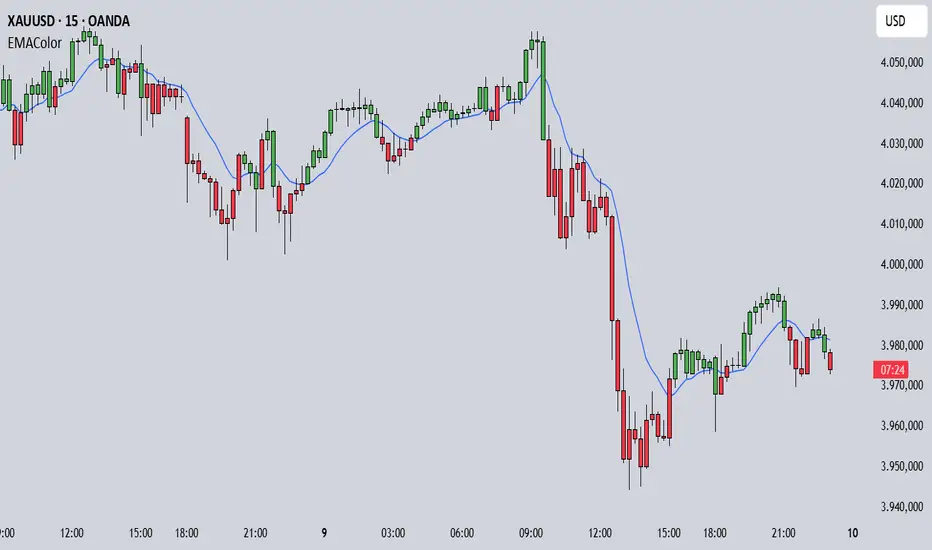
EMA Candle ColorEMA Candle Color - Visual EMA-Based Candle Coloring System
Overview:
This indicator provides a visual approach to trend identification by coloring candles based on their relationship with an Exponential Moving Average (EMA). The script dynamically colors both the candle bars and plots custom candles to give traders an immediate visual representation of price momentum relative to the EMA.
How It Works:
The indicator calculates an EMA based on your chosen source (default: open price) and length (default: 10 periods). It then applies a simple yet effective rule:
When the source price is ABOVE the EMA → Candles turn GREEN (bullish)
When the source price is BELOW the EMA → Candles turn RED (bearish)
This instant visual feedback helps traders quickly identify:
Current trend direction
Potential support/resistance levels (the EMA line itself)
Momentum shifts when candles change color
Key Features:
Customizable EMA Parameters: Adjust the EMA length (1-500) and source (open, close, high, low, hl2, hlc3, ohlc4)
Custom Color Selection: Choose your preferred bullish and bearish colors to match your chart theme
Dual Visualization: Both bar coloring and custom plotcandle for enhanced visibility
Offset Capability: Shift the EMA line forward or backward for advanced analysis
Clean Design: Minimal overlay that doesn't clutter your chart
How to Use:
1. Add the indicator to your chart
2. Adjust the EMA Length based on your trading timeframe:
- Shorter periods (5-20) for day trading and scalping
- Medium periods (20-50) for swing trading
- Longer periods (50-200) for position trading
3. Watch for candle color changes as potential entry/exit signals
4. Combine with other indicators for confirmation
Trading Applications:
Trend Following: Stay in trades while candles remain the same color
Reversal Signals: Watch for color changes as early reversal warnings
Filter System: Only take long positions during green candles, shorts during red
Visual Clarity: Quickly assess market sentiment at a glance
Settings:
Length: EMA calculation period (default: 10)
Source: Price data used for EMA calculation (default: open)
Offset: Shift EMA line on chart (default: 0)
Bullish Color: Color for candles above EMA (default: green)
Bearish Color: Color for candles below EMA (default: red)
Technical Details:
The script uses Pine Script v6 and employs the standard ta.ema() function for smooth, responsive EMA calculations. The candle coloring is achieved through both barcolor() and plotcandle() functions, ensuring visibility across different chart settings.
Note:
This indicator works on all timeframes and instruments. For best results, combine with proper risk management and additional confirmation indicators. The EMA Candle Color system is designed to simplify trend identification, not as a standalone trading system.
Tips:
Use on higher timeframes for more reliable signals
Combine with volume analysis for confirmation
Consider using multiple EMA periods for confluence
Disable default candles if using the plotcandle feature to avoid overlap
This script is open-source. Feel free to use it as a foundation for your own trading system or modify it to suit your specific trading style.
cd_VWAP_mtg_CxCd_VWAP_mtg_Cx
Overview
The most important condition for being successful and profitable in the market is to consistently follow the same rules without compromise, while the price constantly moves in countless different ways.
Regardless of the concept or trading school, those who have rules win.
In this indicator, we will define and use three main sections to set and apply our rules.
The indicator uses the VWAP (Volume Weighted Average Price) — price weighted by volume.
Two VWAPs can be displayed either by manually entering date and time, or by selecting from the menu.
From the menu, you can select the following reference levels:
• HTF Open: Opening candle of the higher timeframe
• ATH / ATL: All-Time High / All-Time Low candles
• PMH / PML, PWH / PWL, PDH / PDL, PH4H / PH4L: Previous Month, Week, Day, or H4 Highs/Lows
• MH / ML, WH / WL, DH / DL, H4H / H4L: Current Month, Week, Day, or H4 Highs/Lows
Additionally, it includes:
• Mitigation / Order Block zones (local buyer-seller balance) across two timeframes.
• Buy/Sell Side Liquidity levels (BSL / SSL) from the aligned higher timeframe (target levels).
________________________________________
Components and Usage
1 – VWAP
Calculated using the classical method:
• High + Volume for the upper value
• Close + Volume for the middle value
• Low + Volume for the lower value
The VWAP is displayed as a colored band, where the coloring represents the bias.
Let’s call this band FVB (Fair Value Band) for ease of explanation.
The FVB represents the final line of defense, the buyer/seller boundary, and in technical terms, it can be viewed as premium/discount zones or support/resistance levels.
Within this critical area, the strong side continues its move, while the weaker side is forced to retreat.
But does the side that breaks beyond the band always keep going?
We all know that’s not always the case — in different pairs and timeframes, price often violates both the upper and lower edges multiple times.
To achieve more consistent analysis, we’ll define a new set of rules.
________________________________________
2 – Mitigation / Order Blocks
In trading literature, there are dozens of different definitions and uses of mitigation or order blocks.
Here, we will interpret the candlesticks to create our own definition, and we’ll use the zones defined by candles that fit this pattern.
For simplicity, let’s abbreviate mitigation as “mtg.”
For a candle to be selected as an mtg, it must clearly show strength from one side (buyers or sellers) — which can also be observed visually on the chart.
________________________________________
Bullish mtg criteria:
1. The first candle must be bullish (close > open) → buyers are strong.
2. The next candle makes a new high (buyers push higher) but fails to close above and pulls back to close inside the previous range → sellers react.
It also must not break the previous low → buyers defend.
3. In the following candle(s), as long as the first candle’s low is protected and the second candle’s high is broken, it indicates buyer strength → a bullish mtg is confirmed.
When price returns to this zone later (gets mitigated), the expectation is that the zone holds and price pushes upward again.
If the low is violated, the mtg becomes invalid.
In technical terms:
If the previous candle’s high is broken but no close occurs above it, the expectation is a reversal move that will retest its low.
Question:
What if the low is protected and in the next candle(s) a new high forms?
Answer: → Bullish mtg.
Bearish mtg (opposite)
3 – Buy/Sell Side Liquidity Levels
With the help of the aligned higher timeframe (swing points), we will define our market structure framework and set our liquidity targets accordingly.
Let’s put the pieces together.
If we continue explaining from a trade-focused perspective, our first priority should be our bias — our projection or expectation of the market’s potential movement.
We will determine this bias using the FVB.
Since we know the band often gets violated on both sides, we want the price action to convince us of its strength.
To do that, we’ll use the first candle that closes beyond the band.
The distance from that candle’s high to low will be our threshold range
Bullish level = high + (candle length × coefficient)
Bearish level = low - (candle length × coefficient)
When the price closes beyond this threshold, it demonstrates strength, and our bias will now align in that direction.
How long will this bias remain valid?
→ Until a closing candle appears on the opposite side of the band.
If a close occurs on the opposite side, then a new bias will only be confirmed once the new threshold level is broken.
During the period in between, we have no bias.
Let’s continue on the chart:
Now that our bias has been established, where and how do we look for trade opportunities?
There are two possible entry approaches:
• Aggressive entry: Enter immediately with the breakout.
• Conservative entry: Wait for a pullback and enter once a suitable structure forms.
(The choice depends on the user’s preference.)
At this stage, the user can apply their own entry model. Let’s give an example:
Let’s assume we’re looking for setups using HTF sweep + LTF CISD confirmation.
Once our bias turns bearish, we look for an HTF sweep forming on or near an FVB or mtg block, and then confirm the entry with a CISD signal.
In summary:
• FVB defines the bias, the entry zone, and the target zone.
• Mtg blocks represent entry zones.
• BSL / SSL levels suggest target zones.
Overlapping FVB and mtg blocks are expected to be more effective.
The indicator also provides an option for a second FVB.
A band attached to a lower timeframe can be used as confirmation.
• Main band: Bias + FVB
• Extra band: Entry trigger confirmed by a close beyond it.
Mtg blocks can provide trade entry opportunities, especially when the price is moving strongly in one direction (flow).
Consecutive or complementary mtg blocks indicate that the price is decisive in one direction, while sometimes also showing areas where we should wait before entering.
Mtg blocks that contain an FVG (Fair Value Gap) within their body are expected to be more effective.
Settings:
The default values are set to 1-3-5m, optimized for scalping trades.
VWAP settings:
Main VWAP (FVB):
• Can be set by selecting a start time, manually entering date and time, or choosing a predefined level.
Extra VWAP (FVB):
• Set from the menu. If not needed, select “none.”
• Visibility, color, and fill settings for VWAP are located here.
• Threshold levels visibility and color options are also in this section.
• The multiplier is used for calculating the threshold level.
Important:
• If the Extra VWAP is selected but not displayed, you need to increase the chart timeframe.
o Example: If the chart is on 3m and you select WH from the extra options, it will not display correctly.
• Upper limits for VWAP:
o 1m and 3m charts: daily High/Low
o 5m chart: weekly High/Low
________________________________________
Mtg Settings:
• Visibility and color settings for blocks are configured here.
• To display on a second timeframe, the box must be checked and the timeframe specified.
• Optional display modes: “only active blocks,” “only last violated mtg,” or “all.”
• For confirmation and removal criteria, choosing high/low or close determines the source used for mtg block formation and deletion conditions.
BSL/SSL Settings:
• Visibility, color, font size, and line style can be configured in this section.
When “Auto” is selected, the aligned timeframe is determined automatically by the indicator, while in manual mode, the user defines the timeframe.
Final Words:
Simply opening trades every time the price touches the VWAP or mtg blocks will not make you a profitable trader. Searching for setups with similar structures while maintaining proper risk management will yield better results in the long run.
I would be happy to hear your feedback and suggestions.
Happy trading!

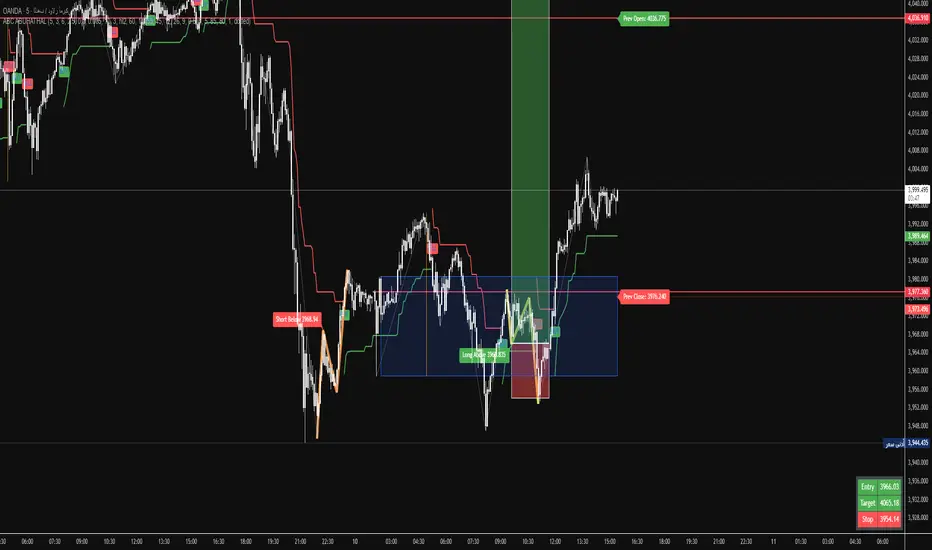
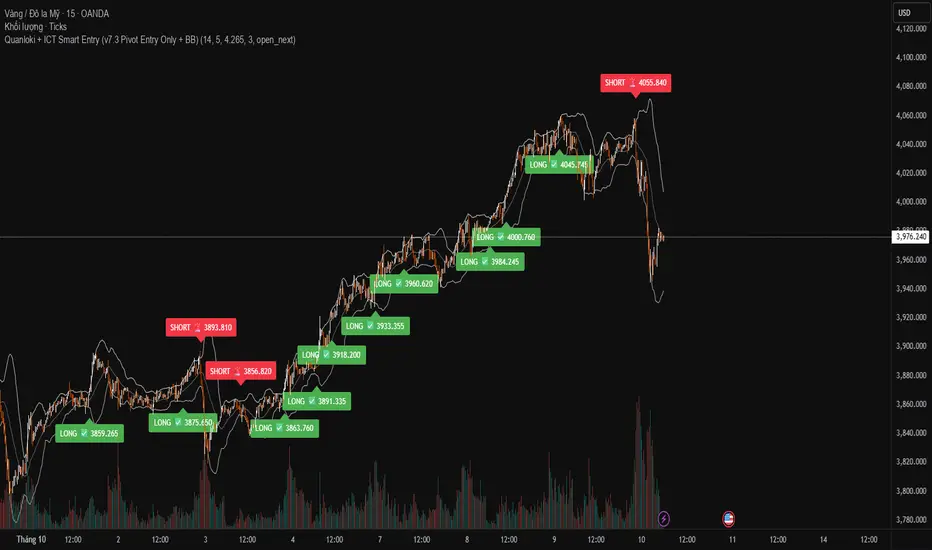
Quanloki + ICT Smart Entry (v7.3 Pivot Entry Only + BB)If you need a signal group or team, please contact @quanloki or tele to get support and refund for the VIP group.
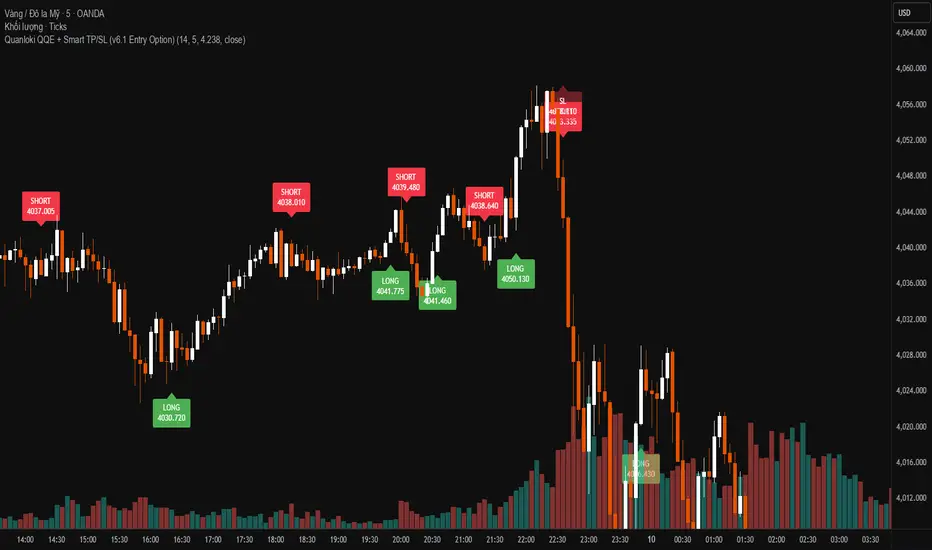
Quanloki QQE + Smart TP/SL (v6.1 Entry Option)Version v6.1 has more complete functions. You can choose open next to enter prices faster. For any information about orders or indicators, you can contact tele @Quanloki for instructions and refunds.
MULTI-CONDITION RSI SIGNAL GENERATOR═══════════════════════════════════════════════
MULTI-CONDITION RSI SIGNAL GENERATOR
═══════════════════════════════════════════════
OVERVIEW:
This indicator generates trading signals based on Relative Strength Index (RSI) movements with multiple confirmation layers designed to filter false signals and identify high-probability reversal opportunities.
═══════════════════════════════════════════════
WHAT MAKES THIS ORIGINAL:
═══════════════════════════════════════════════
Unlike basic RSI indicators that simply plot overbought/oversold crossovers, this system combines FOUR distinct confirmation mechanisms:
1. PERSISTENCE FILTERING - Requires RSI to remain in extreme zones for a minimum duration
2. LOOKBACK VALIDATION - Verifies recent extreme zone visits before signaling
3. DIVERGENCE DETECTION - Identifies price/RSI divergence for stronger signals
4. MOMENTUM CONFIRMATION - Provides trend-continuation entries via midline crosses
This multi-layered approach significantly reduces whipsaw trades that plague simple RSI crossover systems.
═══════════════════════════════════════════════
HOW IT WORKS (TECHNICAL METHODOLOGY):
═══════════════════════════════════════════════
STEP 1: RSI CALCULATION
- Standard RSI calculation using user-defined period (default: 14)
- Monitors two extreme zones: Overbought (default: 70) and Oversold (default: 30)
STEP 2: PERSISTENCE FILTERING
The script counts how many bars RSI has spent in extreme zones within the lookback period:
- For overbought signals: Counts bars where RSI > 70
- For oversold signals: Counts bars where RSI < 30
- Signal only triggers if count >= Minimum Duration (default: 4 bars)
This filters out brief spikes that immediately reverse, focusing on sustained extreme conditions that are more likely to lead to genuine reversals.
STEP 3: LOOKBACK VALIDATION
- Checks if RSI reached extreme zones within the Lookback Bars period (default: 20)
- Uses ta.highest() and ta.lowest() functions to verify recent extremes
- Ensures we're trading reversals from meaningful extremes, not random crossovers
STEP 4: BASIC SIGNAL GENERATION
- BUY SIGNAL: RSI crosses above the oversold level (30) after meeting persistence and lookback conditions
- SELL SIGNAL: RSI crosses below the overbought level (70) after meeting persistence and lookback conditions
STEP 5: DIVERGENCE DETECTION
The script identifies two types of divergence over the Divergence Lookback period (default: 5 bars):
A) BULLISH DIVERGENCE (indicates potential upward reversal):
- Price makes a lower low (current low < previous low)
- RSI makes a higher low (current RSI low > previous RSI low)
- Suggests weakening downward momentum
B) BEARISH DIVERGENCE (indicates potential downward reversal):
- Price makes a higher high (current high > previous high)
- RSI makes a lower high (current RSI high < previous RSI high)
- Suggests weakening upward momentum
STEP 6: STRONG SIGNAL CONFIRMATION
- STRONG BUY: Basic buy signal + bullish divergence present
- STRONG SELL: Basic sell signal + bearish divergence present
- These represent the highest-probability setups
STEP 7: MOMENTUM SIGNALS (OPTIONAL)
- MOMENTUM BUY: RSI crosses above 50 after being oversold (trend continuation)
- MOMENTUM SELL: RSI crosses below 50 after being overbought (trend continuation)
- Smaller signals for traders who want trend-following entries
═══════════════════════════════════════════════
SIGNAL TYPES AND VISUAL INDICATORS:
═══════════════════════════════════════════════
📈 GREEN TRIANGLE (below bar) - Standard Buy Signal
RSI crossed above oversold level with confirmation filters
📉 RED TRIANGLE (above bar) - Standard Sell Signal
RSI crossed below overbought level with confirmation filters
🔵 BLUE TRIANGLE (below bar) - Strong Buy Signal
Buy signal + bullish divergence (HIGHEST PRIORITY)
🟣 PURPLE TRIANGLE (above bar) - Strong Sell Signal
Sell signal + bearish divergence (HIGHEST PRIORITY)
🟢 GREEN CIRCLE (small) - Momentum Buy
RSI crosses above 50 after oversold conditions
🔴 RED CIRCLE (small) - Momentum Sell
RSI crosses below 50 after overbought conditions
BACKGROUND SHADING:
- Light red background: RSI currently overbought
- Light green background: RSI currently oversold
═══════════════════════════════════════════════
PARAMETER SETTINGS:
═══════════════════════════════════════════════
1. OVERBOUGHT LEVEL (default: 70, range: 50-90)
- Higher values = fewer but stronger overbought signals
- Lower values = more sensitive to overbought conditions
- Recommended: 70 for standard markets, 80 for crypto/volatile assets
2. OVERSOLD LEVEL (default: 30, range: 10-50)
- Lower values = fewer but stronger oversold signals
- Higher values = more sensitive to oversold conditions
- Recommended: 30 for standard markets, 20 for crypto/volatile assets
3. RSI PERIOD (default: 14, range: 2-50)
- Standard RSI calculation period
- Lower = more sensitive/faster signals
- Higher = smoother/slower signals
- Recommended: 14 (industry standard)
4. MINIMUM DURATION (default: 4, range: 1-20)
- Required bars in extreme zone before signal
- Higher values = fewer signals but better quality
- Lower values = more signals but more false positives
- Recommended: 3-5 for day trading, 5-10 for swing trading
5. LOOKBACK BARS (default: 20, range: 5-100)
- How far back to check for extreme zone visits
- Should match your typical trading timeframe
- Recommended: 20 for intraday, 50 for daily charts
6. DIVERGENCE LOOKBACK (default: 5, range: 2-20)
- Period for comparing price/RSI highs and lows
- Lower values = more frequent divergence signals
- Higher values = more significant divergences
- Recommended: 5-10 depending on timeframe
═══════════════════════════════════════════════
HOW TO USE THIS INDICATOR:
═══════════════════════════════════════════════
RECOMMENDED TRADING APPROACH:
1. PRIMARY ENTRIES: Focus on Strong Buy/Sell signals (blue/purple triangles)
- These have the highest win rate due to divergence confirmation
- Wait for price action confirmation (support/resistance, candlestick patterns)
2. SECONDARY ENTRIES: Regular Buy/Sell signals (green/red triangles)
- Use these when Strong signals are infrequent
- Require additional confirmation from other indicators or chart patterns
3. TREND CONTINUATION: Momentum signals (small circles)
- Best used when overall trend is clear
- Not recommended for reversal trading
4. FILTER TRADES: Use background shading as context
- Be cautious entering longs when background is red (overbought)
- Be cautious entering shorts when background is green (oversold)
RISK MANAGEMENT GUIDELINES:
- Never risk more than 2-5% of capital per trade
- Use stop losses below recent swing lows (buys) or above swing highs (sells)
- Target at least 1.5:1 reward-to-risk ratio
- Consider position sizing based on signal strength
TIMEFRAME RECOMMENDATIONS:
- 15min - 1hour: Day trading with adjusted parameters (lower minimum duration)
- 4hour - Daily: Swing trading with default parameters
- Weekly: Position trading with increased lookback periods
COMPLEMENTARY TOOLS:
This indicator works best when combined with:
- Support and resistance levels
- Trend indicators (moving averages, trend lines)
- Volume analysis
- Price action patterns (engulfing candles, pin bars)
═══════════════════════════════════════════════
LIMITATIONS AND CONSIDERATIONS:
═══════════════════════════════════════════════
- This is NOT a standalone trading system - requires additional analysis
- RSI-based strategies perform best in ranging/choppy markets
- May generate fewer signals in strong trending markets
- Divergence signals can be early - wait for price confirmation
- Not recommended for highly illiquid assets
- Backtest on your specific market before live trading
- No indicator is 100% accurate - always use proper risk management
═══════════════════════════════════════════════
TECHNICAL NOTES:
═══════════════════════════════════════════════
- Code is original and does not reuse external libraries
- Uses Pine Script v5 native functions only
- Alert conditions included for all signal types
- No repainting - signals appear and remain fixed
- Efficient calculation methods minimize processing load
═══════════════════════════════════════════════
ALERT SETUP:
═══════════════════════════════════════════════
Four alert conditions are available:
1. "Buy Alert" - Triggers on standard buy signals
2. "Sell Alert" - Triggers on standard sell signals
3. "Strong Buy Alert" - Triggers on divergence-confirmed buy signals
4. "Strong Sell Alert" - Triggers on divergence-confirmed sell signals
To set up alerts: Right-click chart → Add Alert → Select desired condition
═══════════════════════════════════════════════
This indicator is provided for educational and informational purposes. Always practice proper risk management and never trade with money you cannot afford to lose.

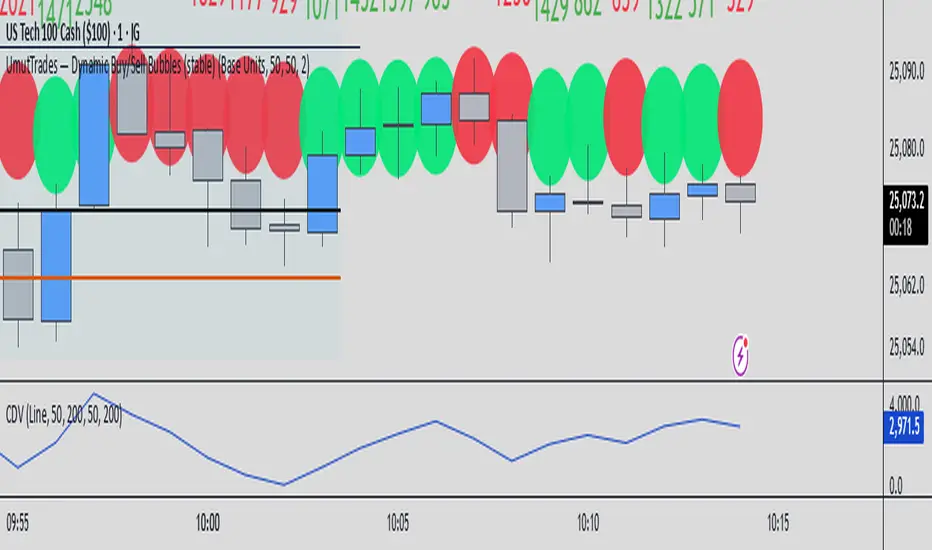
UmutTrades — Dynamic Buy/Sell Bubbles (stable)This indicator detects large buy and sell transactions based on user-defined thresholds (either in base units or quote value).
It places colored bubbles on the chart where those big orders occur green for buys and red for sells with the bubble’s color intensity and size reflecting how large the order is relative to your threshold.
MACD (Buy & Sell signals)This file uses the original code of the MACD and adds a Buy Sell signal when the MACD cuts the signal
Reversal Probability Meter PRO [optimized for Xau/Usd m5]🎯 Reversal Probability Meter PRO
A powerful multi-factor reversal probability detector that calculates the likelihood of bullish or bearish reversals using RSI, EMA bias, ATR spikes, candle patterns, volume spikes, and higher timeframe (HTF) trend alignment.
🧩 MAIN FEATURES
1. Reversal Probability (Bullish & Bearish)
Displays two key metrics:
Bull % — probability of bullish reversal
Bear % — probability of bearish reversal
These are computed using RSI, EMAs, ATR, demand/supply zones, candle confirmations, and volume spikes.
📊 Interpretation:
Bull % > 70% → Buying pressure building up
Bull % > 85% → Strong bullish reversal confirmed
Bear % > 70% → Selling pressure building up
Bear % > 85% → Strong bearish reversal confirmed
2. Alert Probability Threshold
Adjustable via alertThreshold (default = 85%).
Alerts trigger only when probability ≥ threshold, and confirmed by zone + volume spike + candle pattern.
🔔 Alerts Available:
✅ Bullish Smart Reversal
🔻 Bearish Smart Reversal
To activate: Right-click chart → “Add alert” → choose the alert condition from the indicator.
3. Demand / Supply Zone Detection
The script determines the price position within the last zoneLook (default 30) bars:
🟢 DEMAND → Lower 35% of range (potential bounce zone)
🔴 SUPPLY → Upper 35% of range (potential rejection zone)
⚪ MID → Neutral area
📘 Purpose: Validates reversals based on context:
Bullish only valid in Demand zones
Bearish only valid in Supply zones
4. Higher Timeframe (HTF) Trend Alignment
Reads EMA bias from a higher timeframe (default = 15m) for trend confirmation.
Reversals against HTF trend are automatically weighted down prevents false countertrend signals.
📈 Example:
M5 chart under M15 downtrend → Bullish probability is reduced.
5. Candle Confirmation Patterns
Two key price action confirmations:
Bullish: Engulfing or Pin Bar
Bearish: Engulfing or Pin Bar
A valid reversal requires both a candle confirmation and a volume spike.
6. Volume & ATR Spike Filters
Volume Spike: volume > SMA(20) × 1.3
ATR Spike: ATR > SMA(ATR, 50) × volMult
🎯 Ensures that only strong market moves with real energy are considered valid reversals.
7. Reversal Momentum Histogram
A color-gradient oscillator showing the momentum difference:
Green = bullish dominance
Red = bearish dominance
Flat near 0 = neutral
Controlled by showOscillator toggle.
8. Smart Info Panel
A compact dashboard displayed on the top-right with 4 rows:
Row Info Description
1 Bull % Bullish reversal probability
2 Bear % Bearish reversal probability
3 Zone Market context (DEMAND / SUPPLY / MID)
4 Signal Strength Current signal intensity (probability %)
Dynamic Colors:
90% → Bright (strong signal)
75–90% → Yellow/Orange (medium)
<75% → Gray (weak)
9. Sensitivity Mode
Fine-tunes indicator reactivity:
🟥 Aggressive: Detects reversals early (more signals, less accurate)
🟨 Normal: Balanced, default mode
🟩 Conservative: Filters only strongest reversals (fewer but more reliable)
10. Custom Color Options
Customize bullish and bearish colors via bullBaseColor and bearBaseColor inputs for your preferred chart theme.
⚙️ HOW TO USE
Add to Chart
→ Paste the script into Pine Editor → “Add to chart”.
Select Timeframe
→ Best for M5–M30 (scalping/intraday).
→ H1–H4 for swing trading.
Monitor the Info Panel:
Bull % ≥ 85% + Zone = Demand → Strong bullish reversal signal
Bear % ≥ 85% + Zone = Supply → Strong bearish reversal signal
Watch the Histogram:
Rising green bars = bullish momentum gaining
Deep red bars = bearish momentum gaining
Enable Alerts:
Right-click chart → “Add alert”
Choose Bullish Smart Reversal or Bearish Smart Reversal
🧠 TRADING TIPS
Use Conservative mode for noisy lower timeframes (M5–M15).
Use Aggressive mode for higher timeframes (H1–H4).
Combine with manual support/resistance or zone boxes for precision entries. Personally i use Order Block.
Best reversal setups occur when all align:
Bull % > 85%
Zone = DEMAND
Volume spike present
Candle = Bullish engulfing
HTF trend supportive

ADAM Projection - Efficiency Ratio Adaptive)Overview
The ADAM Projection is a visualization of how a price path might extend from its recent motion, expressed as a continuation (trend reflection) or anti-trend (mean reversion) pattern. This indicator expands upon Jim Sloman’s original ADAM projection—introduced in “The Adam Theory of Markets or What Matters Is Profit” (1983)—by adding a modern quantitative framework for Efficiency Ratio (ER) weighting, time-scaled path normalization, and smooth blending between continuation and anti-trend projections.
What Is the ADAM Theory?
Jim Sloman’s original ADAM projection was designed to model pure trend continuation. He proposed that every market motion could be mirrored around a central anchor price (the “Adam line”), effectively reflecting past price movements forward in time to visualize what a continuation of the same geometric path would look like. This reflection concept captured the idea that market structure exhibits self-similarity and that price trends often extend symmetrically beyond recent pivots.
How This Script Extends It
This version generalizes Sloman’s concept by introducing an adjustable blend between continuation (reflection) and anti-trend (forward paste) behavior, weighted by an adaptive ER domain.
Anchor Axis
The reflection axis (anchorPrice) can be Close, HL2, HLC3, or OHLC4.
The projection is drawn forward from this anchor for a user-defined horizon (len bars).
Dual Paths
Continuation (Reflection): Mirrors historical closes across the anchor.
Anti-trend (Forward Paste): Extends historical closes directly forward without inversion.
Efficiency Ratio (ER)
The Efficiency Ratio measures how directional recent price movement has been: ER = |Net Change| / Σ|Δi|
Values near +1 indicate strong directionality (favoring continuation); values near 0 indicate noise or consolidation (favoring anti-trend behavior).
Signed ER Normalization
ER values are mapped into a user-defined domain between erMin and erMax, with:
erSharp (γ) controlling the steepness of the blend curve
erFloor providing stability when ER ≈ 0
beta (β) weighting volatility across time (β = 0.5 approximates √time scaling)
Blended Projection
Each projected point is a weighted combination of the two paths: y_proj = (1 − w) * y_fade + w * y_cont
The blend factor w is derived from the normalized ER domain and gamma shaping, producing a smooth morph between the anti-trend and continuation geometries.
Visualization
The teal projection line shows the dynamically blended continuation/anti-trend forecast for the next len bars.
The gray anchor line marks the reflection axis.
Each segment adapts in real time based on ER magnitude and recent path structure.
Key Parameters
Core: len, anchorPrice, lineThin — projection horizon and appearance
Lines: showProj, colProj — show or recolor projection
ER Domain: erMin, erMax, erSharp, erFloor, beta — control domain scaling, shaping, and time weighting
Practical Use
High ER values emphasize continuation (trend-following behavior).
Low or negative ER values emphasize fading or mean reversion.
The projection helps visualize whether recent structure supports trend persistence or weakening.
Interpretation
The ADAM Projection is not a predictive indicator but a geometric tool for studying market symmetry and efficiency. It provides a structured way to visualize how recent movements would look if extended forward under both continuation and anti-trend assumptions. This blends Sloman’s original reflection concept with modern ER-based adaptivity.
Summary
Origin: Jim Sloman (1983) — trend continuation via reflection symmetry.
Extension: Adds ER-driven blending to model both continuation and anti-trend regimes.
Concept: Price reflection vs. direct forward extension.
Purpose: Study of geometric price symmetry and efficiency, not a trade signal.

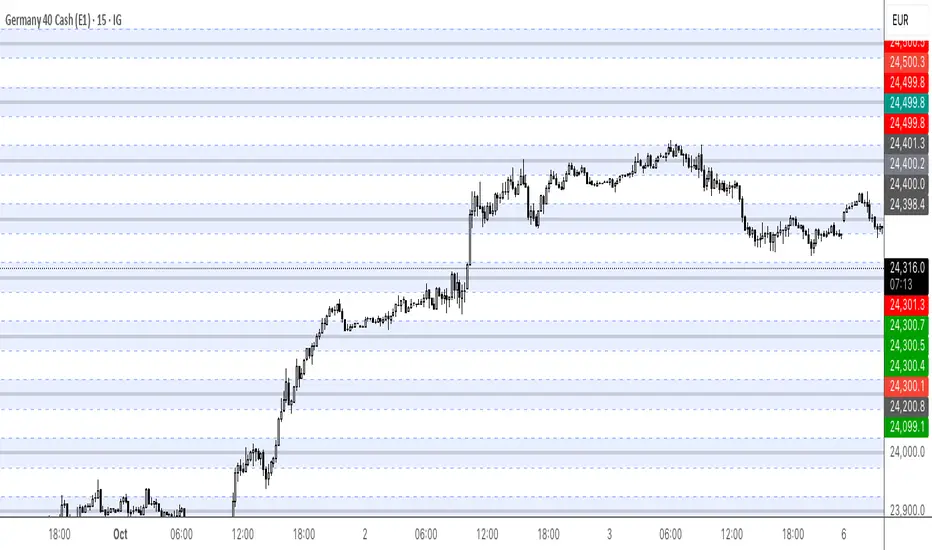
Round Numbers (Plotter) v2The *Round Numbers (Plotter) v2* indicator highlights key psychological price levels on the chart — the so-called *round numbers* (e.g. 1.1000 on EURUSD or23,000 on NASDAQ).
These levels often act as **natural support or resistance zones**, where price tends to react, consolidate, or reverse.
Version 2 introduces the concept of **gravitational zones**, which define a price range surrounding each round level — visualizing how price “gravitates” around these equilibrium areas.
---
### 🧩 **Main Features**
* 🔹 **Dynamic round levels:** plotted automatically based on user-defined *step size* (in points or pips).
* 🔹 **Custom step mode:** switch between “Points” (for indices, commodities, crypto) and “Pips” (for Forex pairs).
* 🔹 **Configurable appearance:** color, width, and line style (solid, dashed, dotted).
* 🔹 **Gravitation zones:** optional secondary lines plotted above and below each round level.
* Distance adjustable as a **percentage of the step size** (default = 25%).
* Help visualize “magnet areas” where price tends to slow down or oscillate before crossing a level.
* 🔹 **Optional fill:** softly shaded area between the upper and lower gravitation lines for clearer visualization of each zone.
* You can enable or disable this with the *“Show gravitation fill”* toggle.
* Fill color and transparency fully customizable.
---
### 📈 **Use Cases**
* Identify **psychological support/resistance** levels on any instrument or timeframe.
* Observe **market equilibrium zones** where price tends to cluster or hesitate before continuing.
* Combine with oscillators or volume indicators to confirm reaction strength near round numbers.
* Use the **gravitational zones** to refine stop-loss or take-profit placement near high-impact levels.
---
### 💡 **Notes**
* The indicator does **not repaint** and updates levels dynamically based on the latest price.
* Works on all asset classes: **Forex, Indices, Crypto, Commodities, Stocks.**
* Designed to be **lightweight** — no accumulation of historical objects.
* Combine this with *Round Number Analyzer* for complete analysis of round numbers level