CE - 42MACRO Fixed Income and Macro This is Part 2 of 2 from the 42MACRO Recreation Series
However, there will be a bonus Indicator coming soon!
The CE - 42MACRO Fixed Income and Macro Table is a next level Macroeconomic and market analysis indicator.
It aims to provide a probabilistic insight into the market realized GRID Macro regimes,
track a multiplex of important Assets, Indices, Bonds and ETF's to derive extra market insights by showing the most important aggregates and their performance over multiple timeframes... and what that might mean for the whole market direction.
For traders and especially investors, the unique functionalities will be of high value.
Quick guide on how to use it:
docs.google.com
WARNING
By the nature of the macro regimes, the outcomes are more accurate over longer Chart Timeframes (Week to Months).
However, it is also a valuable tool to form an advanced,
market realized, short to medium term bias.
NOTE
This Indicator is intended to be used alongside the 1nd part "CE - 42MACRO Equity Factor"
for a more wholistic approach and higher accuracy.
Methodology:
The Equity Factor Table tracks specifically chosen Assets to identify their performance and add the combined performances together to visualize 42MACRO's GRID Equity Model.
For this it uses the below Assets:
Convertibles ( AMEX:CWB )
Leveraged Loans ( AMEX:BKLN )
High Yield Credit ( AMEX:HYG )
Preferreds ( NASDAQ:PFF )
Emerging Market US$ Bonds ( NASDAQ:EMB )
Long Bond ( NASDAQ:TLT )
5-10yr Treasurys ( NASDAQ:IEF )
5-10yr TIPS ( AMEX:TIP )
0-5yr TIPS ( AMEX:STIP )
EM Local Currency Bonds ( AMEX:EMLC )
BDCs ( AMEX:BIZD )
Barclays Agg ( AMEX:AGG )
Investment Grade Credit ( AMEX:LQD )
MBS ( NASDAQ:MBB )
1-3yr Treasurys ( NASDAQ:SHY )
Bitcoin ( AMEX:BITO )
Industrial Metals ( AMEX:DBB )
Commodities ( AMEX:DBC )
Gold ( AMEX:GLD )
Equity Volatility ( AMEX:VIXM )
Interest Rate Volatility ( AMEX:PFIX )
Energy ( AMEX:USO )
Precious Metals ( AMEX:DBP )
Agriculture ( AMEX:DBA )
US Dollar ( AMEX:UUP )
Inverse US Dollar ( AMEX:UDN )
Functionalities:
Fixed Income and Macro Table
Shows relative market Asset performance
Comes with different Calculation options like RoC,
Sharpe ratio, Sortino ratio, Omega ratio and Normalization
Allows for advanced market (health) performance
Provides the calculated, realized GRID market regimes
Informs about "Risk ON" and "Risk OFF" market states
Visuals - for your best experience only use one (+ BarColoring) at a time:
You can visualize all important metrics:
- GRID regimes of the currently chosen calculation type
- Risk On/Risk Off with background colouring and additional +1/-1 values
- a smoother GRID model
- a smoother Risk On/ Risk Off metric
- Barcoloring for enabled metric of the above
If you have more suggestions, please write me
Fixed Income and Macro:
The visualisation of the relative performance of the different assets provides valuable information about the current market environment and the actual market performance.
It furthermore makes it possible to obtain a deeper understanding of how the interconnected market works and makes it simple to identify the actual market direction,
thus also providing all the information to derive overall market health, market strength or weakness.
Utility:
The Fixed Income and Macro Table is divided in 4 Columns which are the GRID regimes:
Economic Growth:
Goldilocks
Reflation
Economic Contraction:
Inflation
Deflation
Top 5 Fixed Income/ Macro Factors:
Are the values green for a specific Column?
If so then the market reflects the corresponding GRID behavior.
Bottom 5 Fixed Income/ Macro Factors:
Are the values red for a specific Column?
If so then the market reflects the corresponding GRID behavior.
So if we have Goldilocks as current regime we would see green values in the Top 5 Goldilocks Cells and red values in the Bottom 5 Goldilocks Cells.
You will find that Reflation will look similar, as it is also a sign of Economic Growth.
Same is the case for the two Contraction regimes.
******
This Indicator again is based to a majority on 42MACRO's models.
I only brought them into TV and added things on top of it.
If you have questions or need a more in-depth guide DM me.
GM
"马里AGG公司股价"に関するスクリプトを検索

Portfolio Performance - Effects of RebalancingFunction:
- Can be used to evaluate the performance of a portfolio containing 2 assets over a set time interval
- Shows the % return of the portfolio over the time interval defined by the user
- Includes a threshold rebalancing algorithm to show the effects that rebalancing has on the portfolio over the long term
- Created to evaluate of the performance of portfolios containing different weightings of stocks and bonds over time assuming that the user would rebalance the portfolio when asset weights crossed a threshold
Instructions:
- To be used with dividends adjustments turned on
- Add this script to a symbol. e.g. AMEX:SPY
- Click the chart to define the entry time and the exit time. i.e. the time interval
- Define the initial investment of the portfolio. Default setting is $100,000
- Define the second asset to be included in the portfolio. e.g. BATS:AGG
- The strategy comes pre-populated with a portfolio that has a weight of 80% asset 1 and 20% asset 2. i.e. 80% AMEX:SPY and 20% BATS:AGG if the symbols mentioned above were chosen
- The 7 lines show the weighted % return of each portfolio over the time period defined by the user
- Each line (except the blue) is the return based on a different rebalancing threshold. The default settings are 1%, 2.5%, 5%, 10%, 15%, 20%, 30%
- The blue line is the % return of a portfolio that was made up of 100% asset 1 over the time interval. i.e. 100% AMEX:SPY
- Asset weights and rebalancing thresholds are adjustable via the settings
- Each plot can be turned on and turned off via a tick box in the settings

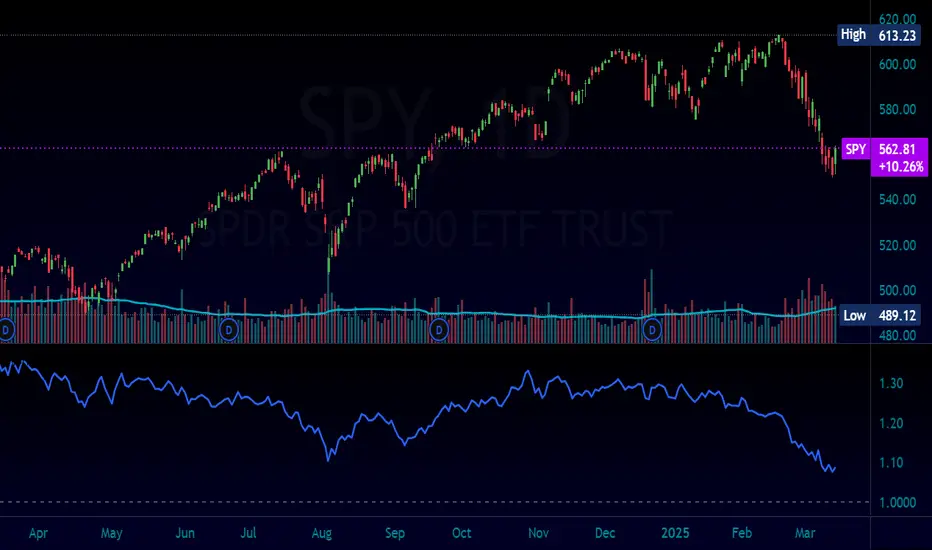
Normalized Equity/Bond RatioThis indicator calculates a normalized equity-to-bond ratio over a 252-day lookback (~1 trading year) to assess risk-on vs. risk-off sentiment. It addresses the issue of direct ratios (e.g., SPY/TLT) being visually dominated by high nominal stock prices, which can obscure bond price movements.
A rising ratio indicates equities are outperforming bonds, suggesting risk-on conditions, while a declining ratio signals a shift toward bonds, often associated with risk-off behavior. The normalization ensures better visibility and comparability of the trend over time.
A ratio > 1 means the equity (e.g., SPY) is outperforming the bond (e.g., AGG) since the lookback. A ratio < 1 means bonds are outperforming.
BTC Agg VolumeBTC Volumes for stablecoin trading pairs from multiple exchanges. Volume is grouped by exchanged and appears as stacked bars. Volume data can be filtered by exchange and stablecoin pair. Appearance can be resized over with an option to apply standard deviations.

.srb suite pin-upThe essential suite Indicator
that are well integrated to ensure visibility of essential items for trading.
it is very cumbersome to put symbol in the Tradingview chart and combine essential individual indicators one by one.
Moreover even with such a combination, the chart is messy and visibility is not good.
This is because each indicator is not designed with the others in mind.
This suite was developed as a composite-solution to that situation, and will make you happy.
--> This is steamlined pin-up version of .srb suite.
--> A minimal set of indicators for comparing different symbols.
--> This is well-balanced alternative next version of previous .b pin-up symbol
BTC-agg. Volume
4 BTC-spot & 4 BTC-PERP volume aggregated.
It might helps you don't miss out on important volume flows.
Weighted to spot trading volume when using PERP+spot volume .
If enabled, BTC-agg.Vol automatically applied when selecting BTC-pair.
--> This is used in calculations involving volumes, such as VWAP .
Moving Average
1 x JMA trend ribbon ; Accurately follow short-term trend changes.
2 x EMA ribbon ; zone , not the line.
MA extension line ; It provide high visibility to recognize the direction of the MA.
SPECIAL TOOLS
BB regular (Dev. 2.0, 2.5)
BB Extented (Dev. 2.5, 3.0, 3.5)
SPECIAL TOOLS - Ultra Volume Marking
x2 x4 greater than regular average volume, it will help you can take the reversal
It does not directly indicate volume, but ultra-volume marking is enough for compare.
---------------------------------------------------------------------------------------------------------------------------------------
if you have any questions freely contact to me by message on tradingview
but please understand that responses may be quite late.
Special thanks to all of contributors of community.
The script may be freely distributed under the MIT license.

13612WThis script is a 13612W momentum filter used in the Vigilant Asset Allocation (VAA) and Defensive Asset Allocation (DAA) created by Wouter J. Keller and Jan Willem Keuning.
This asset allocation strategy was uploaded to SSRN in 2017 and 2018.
13612W Calculation Method
(Profitability in Last 1 months * 12 +
Profitability in Last 3 months * 4 +
Profitability in Last 6 months * 2 +
Profitability in Last 12 months)/4
Let me briefly explain one of the VAAs, VAA-G4.
The VAA-G4 has an annualized return of 17.7%, a Sharpe ratio of 1.07% and Max Drawdown of 16.1%.
(It's too long and complicated to describe all VAA, DAA strategies. Above all, the translator performance is not good.)
VAA Global 4 Universe: SPY, EFA, EEM, AGG
Cash Universe: SHY , IEF, LQD
If 13612W of VAA Global 4 Universe is negative at least one
>> 100% of assets hold one of the highest 13612W of Cash Universe
If all 13612W of VAA Global 4 Universe are positive
>> 100% of assets hold one of the highest 13612W of VAA Global 4 Universe
Rebalancing is done every month according to this method.
