Options Scalper v2 - SPY/QQQHere's a comprehensive description of the Options Scalper v2 strategy:
---
## Options Scalper v2 - SPY/QQQ
### Overview
A multi-indicator confluence-based scalping strategy designed for trading SPY and QQQ options on short timeframes (1-5 minute charts). The strategy uses a scoring system to generate high-probability CALL and PUT signals by requiring alignment across multiple technical indicators before triggering entries.
---
### Core Logic
The strategy operates on a **scoring system (0-9 points)** where both bullish (CALL) and bearish (PUT) conditions are evaluated independently. A signal only fires when:
1. A recent EMA crossover occurred (within the last 3 bars)
2. The direction's score meets the minimum threshold (default: 4 points)
3. The signal's score is higher than the opposite direction
4. Enough bars have passed since the last signal (cooldown period)
5. Price action occurs during valid trading sessions
---
### Indicators Used
| Indicator | Purpose | CALL Condition | PUT Condition |
|-----------|---------|----------------|---------------|
| **9/21 EMA Cross** | Primary trigger | Fast EMA crosses above slow | Fast EMA crosses below slow |
| **200 EMA** | Trend filter | Price above 200 EMA | Price below 200 EMA |
| **RSI (14)** | Momentum filter | RSI between 45-65 | RSI between 35-55 |
| **VWAP** | Institutional level | Price above VWAP | Price below VWAP |
| **MACD (12,26,9)** | Momentum confirmation | MACD line > Signal line | MACD line < Signal line |
| **Stochastic (14,3)** | Overbought/Oversold | Oversold or K > D | Overbought or K < D |
| **Volume** | Participation confirmation | Spike on green candle | Spike on red candle |
| **Price Structure** | Breakout detection | Higher high formed | Lower low formed |
---
### Scoring Breakdown
**CALL Score (Max 9 points):**
- Recent EMA cross up: +2 pts
- EMA alignment (fast > slow): +1 pt
- RSI in bullish range: +1 pt
- Above VWAP: +1 pt
- MACD bullish: +1 pt
- Volume spike on green candle: +1 pt
- Stochastic setup: +1 pt
- Above 200 EMA: +1 pt
- Breaking higher high: +1 pt
**PUT Score (Max 9 points):**
- Recent EMA cross down: +2 pts
- EMA alignment (fast < slow): +1 pt
- RSI in bearish range: +1 pt
- Below VWAP: +1 pt
- MACD bearish: +1 pt
- Volume spike on red candle: +1 pt
- Stochastic setup: +1 pt
- Below 200 EMA: +1 pt
- Breaking lower low: +1 pt
---
### Risk Management
The strategy uses **ATR-based dynamic stops and targets**:
| Parameter | Default | Description |
|-----------|---------|-------------|
| Stop Loss | 1.5x ATR | Distance below entry for longs, above for shorts |
| Take Profit | 2.0x ATR | Creates a 1:1.33 risk-reward ratio |
Positions are also closed on:
- Opposite direction signal (flip trade)
- Take profit or stop loss hit
---
### Session Filtering
Trades are restricted to high-liquidity periods by default:
- **Morning Session:** 9:30 AM - 11:00 AM EST
- **Afternoon Session:** 2:30 PM - 3:55 PM EST
This avoids choppy midday price action and captures the highest volume periods.
---
### Input Parameters
| Parameter | Default | Description |
|-----------|---------|-------------|
| Fast EMA | 9 | Fast moving average period |
| Slow EMA | 21 | Slow moving average period |
| Trend EMA | 200 | Long-term trend filter |
| RSI Length | 14 | RSI calculation period |
| RSI Overbought | 65 | Upper RSI threshold |
| RSI Oversold | 35 | Lower RSI threshold |
| Volume Multiplier | 1.2x | Volume spike detection threshold |
| Min Signal Strength | 4 | Minimum score required to trigger |
| Crossover Lookback | 3 | Bars to consider crossover "recent" |
| Min Bars Between Signals | 5 | Cooldown period between signals |
---
### Visual Elements
**Chart Plots:**
- Green line: 9 EMA (fast)
- Red line: 21 EMA (slow)
- Gray line: 200 EMA (trend)
- Purple dots: VWAP
**Signal Markers:**
- Green triangle up + "CALL" label: Buy call signal
- Red triangle down + "PUT" label: Buy put signal
- Small circles: EMA crossover reference points
**Info Table (Top Right):**
- Real-time CALL and PUT scores
- RSI, MACD, Stochastic values
- VWAP and 200 EMA position
- Recent crossover status
- Current signal state
---
### Alerts
| Alert Name | Trigger |
|------------|---------|
| CALL Entry | Standard call signal fires |
| PUT Entry | Standard put signal fires |
| Strong CALL | Call signal with score ≥ 6 |
| Strong PUT | Put signal with score ≥ 6 |
---
### Recommended Usage
| Setting | 0DTE Scalping | Intraday Swings |
|---------|---------------|-----------------|
| Timeframe | 1-2 min | 5 min |
| Min Signal Strength | 5-6 | 4 |
| ATR Stop Mult | 1.0 | 1.5 |
| ATR TP Mult | 1.5 | 2.0 |
| Option Delta | 0.40-0.50 | 0.30-0.40 |
---
### Key Improvements Over v1
1. **Requires actual crossover** - Eliminates false signals from simple trend continuation
2. **Balanced scoring** - Both directions evaluated equally, highest score wins
3. **Signal cooldown** - Prevents overtrading with minimum bar spacing
4. **Multi-indicator confluence** - 8 factors must align for signal generation
5. **Volume-candle alignment** - Volume spikes only count when matching candle direction
---
### Disclaimer
This strategy is for educational purposes. Backtest thoroughly before live trading. Options trading involves significant risk of loss. Past performance does not guarantee future results.
"200元+股票大盘"に関するスクリプトを検索

Mark Minervini SEPA - Balanced
📊 MARK MINERVINI SEPA BALANCED - COMPLETE USER GUIDE
🚀 WHAT IS THIS INDICATOR?
This is a professional swing trading indicator based on Mark Minervini's famous
Trend Template strategy. It automatically identifies high-probability setups where:
✅ Long-term trend is BULLISH (confirmed by moving averages)
✅ Stock is OUTPERFORMING the market (relative strength improving)
✅ Price is CONSOLIDATING (forming a base for breakout)
✅ Volume is CONFIRMING (volume spike on breakout)
Result: CLEAR BUY SIGNALS when everything aligns! 🎯
🎨 WHAT YOU SEE ON YOUR CHART
1️⃣ FOUR MOVING AVERAGE LINES:
🟠 Orange Line (MA 20) = Short-term trend
🔵 Blue Line (MA 50) = Intermediate trend
🟢 Green Line (MA 150) = Long-term trend
🔴 Red Line (MA 200) = Very long-term trend
IDEAL: All lines stacked in order (Orange > Blue > Green > Red)
2️⃣ BACKGROUND COLOR:
🟢 GREEN background = Trend template is VALID (bullish setup ready)
🔴 RED background = Trend template is BROKEN (avoid trading)
3️⃣ DASHBOARD PANEL (Top-Right):
Real-time checklist showing:
✓ 6 core trend template rules
✓ Relative strength status
✓ VCP base quality
✓ Stage classification (S1/S2/S3/S4)
✓ Volume breakout status
4️⃣ VCP BASE BOXES (Blue Rectangles):
Shows where consolidation is happening
This is your potential entry zone
5️⃣ BUY SIGNAL LABEL (Green Text Below Candle):
Green "BUY" label appears when ALL criteria are met
This is your strongest entry signal
6️⃣ STOP LOSS LINE (Red Dashed Line):
Shows your stop loss level (base low)
📖 HOW TO USE - STEP BY STEP
STEP 1: ADD INDICATOR TO CHART
────────────────────────────────
1. Open TradingView chart
2. Click "Indicators" (top toolbar)
3. Search "Minervini SEPA Balanced"
4. Click to add to your chart
5. Use DAILY (1D) timeframe for swing trading
STEP 2: CHECK THE DASHBOARD (Top-Right Panel)
1. Look at all the checkmarks
2. Count how many are GREEN (✓)
3. Check Stage column - is it showing S2 or S1?
STEP 3: LOOK FOR SETUP PATTERNS
─────────────────────────────────
Ideal setup shows:
✓ Dashboard: 10+ criteria are GREEN
✓ Stage: S2 (green) or S1 (orange)
✓ Blue VCP box visible on chart (base forming)
✓ Moving averages aligned (50 > 150 > 200)
✓ Price above all moving averages
✓ Background is GREEN
STEP 4: WAIT FOR ENTRY SIGNAL
──────────────────────────────
Option A: BUY SIGNAL label appears
→ Green "BUY" label = ALL criteria met
→ ENTER at market price immediately
Option B: Setup looks good but no BUY label yet
→ Wait for price to break above blue VCP box
→ Volume should spike (1.3x or higher)
→ Then enter at breakout
STEP 5: PLACE YOUR TRADE
────────────────────────
📍 ENTRY: At breakout from VCP base
📍 STOP LOSS: Base low (red dashed line)
📍 TARGET: 20-30% move (typical Minervini target)
📍 HOLDING TIME: 2-4 weeks
🎯 BALANCED VERSION - WHY IT'S BETTER FOR INDIAN STOCKS
Volume Multiplier: 1.3x (NOT 1.5x)
→ Original was too strict for Indian market
→ 1.3x is realistic and catches good breakouts
→ Results: 5-10 signals per stock per year (tradeable!)
Trend Template: Core 6 rules (NOT all 8)
→ Focuses on the most important rules
→ Still maintains quality, but more flexible
→ Works better with Indian stock behavior
Stage Allowed: S1 OR S2 (NOT just S2)
→ Catches earlier moves
→ Allows you to enter sooner
→ But maintains quality with other criteria
📊 DASHBOARD INDICATORS - WHAT EACH MEANS
TREND SECTION (Core 6 Rules):
─────────────────────────────
P>200 ✓ = Price above 200-day MA (long-term uptrend)
150>200 ✓ = MA150 above MA200 (MA alignment)
200↑ ✓ = MA200 trending up (uptrend accelerating)
50>150 ✓ = MA50 above MA150 (intermediate uptrend)
50>200 ✓ = MA50 above MA200 (overall alignment)
P>50 ✓ = Price above MA50 (pullback level intact)
RS STRENGTH SECTION:
───────────────────
RS↑ ✓ = Stock outperforming NIFTY index
✗ = Stock underperforming NIFTY (avoid)
VCP BASE SECTION:
────────────────
In Base ✓ = Consolidation zone detected
✗ = No consolidation yet
Vol Dry ✓ = Volume drying up (base tightening)
✗ = Normal volume (consolidation weak)
ENTRY SECTION:
──────────────
Stage S2 = GREEN (best for swing trading)
S1 = ORANGE (acceptable, early entry)
S3 = RED (avoid - distribution phase)
S4 = RED (avoid - downtrend)
Vol Brk ✓ = Volume confirmed breakout (1.3x+ average)
✗ = Weak volume (breakout likely to fail)
❌ WHEN NOT TO TRADE
SKIP if ANY of these are true:
❌ Background is RED (trend template broken)
❌ Stage is S3 or S4 (distribution or downtrend)
❌ Vol Brk is RED (volume not confirming)
❌ RS↑ is ORANGE/RED (stock underperforming market)
❌ Blue box is NOT visible (no base forming)
❌ Base is very loose/messy (not tight enough)
❌ Moving averages are not aligned
❌ Less than 8 GREEN criteria on dashboard
⚙️ CUSTOMIZATION GUIDE
Click ⚙️ gear icon next to indicator name to adjust settings:
VOLUME MULTIPLIER (Default: 1.3)
────────────────────────────────
Current: 1.3x = BALANCED for Indian stocks ✅
Change to 1.2x = MORE signals (more false breakouts)
Change to 1.4x = FEWER signals (very selective)
Change to 1.5x = ORIGINAL (too strict, rarely triggers)
RS BENCHMARK (Default: NSE:NIFTY)
─────────────────────────────────
Current: NSE:NIFTY = Large-cap stocks
Change to NSE:NIFTY500 = Mid-cap stocks
Change to NSE:NIFTYNXT50 = Small-cap stocks
MINIMUM BASE DAYS (Default: 20)
───────────────────────────────
Current: 20 days = 4 weeks consolidation ✅
Change to 15 = Shorter bases (more frequent signals)
Change to 25 = Longer bases (higher quality)
ATR% FOR TIGHTNESS (Default: 1.5)
──────────────────────────────────
Current: 1.5% = BALANCED ✅
Change to 1.0% = ONLY very tight bases
Change to 2.0% = Loose bases accepted
📈 REAL TRADING EXAMPLE
SCENARIO: Trading RELIANCE over 4 weeks
WEEK 1: Base Starts Forming
────────────────────────────
- Price consolidating around ₹1,500
- Dashboard: 5/14 criteria green
- Action: MONITOR (not ready yet)
WEEK 2: Base Tightens
─────────────────────
- Price still ₹1,500 (no movement)
- VCP box appearing on chart
- Dashboard: 8/14 criteria green
- Vol Dry: ✓ (volume shrinking - good!)
- Action: MONITOR (almost ready)
WEEK 3: Perfect Setup Formed
──────────────────────────────
- Base still ₹1,500
- Dashboard: 12/14 criteria GREEN ✓✓✓
- Stage: S2 ✓
- Blue box tight and clean
- Action: WAIT FOR BREAKOUT
WEEK 4: Breakout Happens!
──────────────────────────
- Price closes at ₹1,550 (breakout!)
- Volume: 1.6x average (exceeds 1.3x requirement)
- Dashboard: BUY SIGNAL ✓ (all criteria met)
- Action: ENTER TRADE
Entry: ₹1,550
Stop: ₹1,480 (base low)
Target: ₹1,850 (20% move)
RESULT: +19.4% profit in 2 weeks! ✅
💡 PRO TIPS FOR BEST RESULTS
1. USE DAILY (1D) CHARTS ONLY
Weekly charts = Fewer signals, slower moves
Daily charts = Best for swing trading ✅
Intraday charts = Too many false signals
2. SCAN MULTIPLE STOCKS
Don't just watch 1 stock
Scan 50-100 stocks daily
More stocks = More opportunities
3. WAIT FOR PERFECT ALIGNMENT
Don't enter on 8/14 criteria
Wait for 12+/14 criteria
This increases win rate significantly
4. VOLUME IS CRITICAL
Always check Vol Brk column
No volume = Likely to fail
1.3x+ volume = Good breakout
5. COMBINE WITH YOUR OWN ANALYSIS
Indicator gives technical signals
You add your own fundamental view
Strong fundamental + technical = Best trade
6. BACKTEST ON HISTORICAL DATA
Use TradingView Replay feature
Go back 6-12 months
See how many signals appeared
Verify which were profitable
7. KEEP A TRADING JOURNAL
Track entry, exit, profit/loss
Note what worked and what didn't
Continuous improvement!
⚠️ IMPORTANT DISCLAIMERS
✓ This indicator is for educational purposes only
✓ Past performance does not guarantee future results
✓ Always use proper risk management (position sizing, stop loss)
✓ Never risk more than 2% of your account on one trade
✓ Backtest thoroughly before using with real money
✓ The indicator provides technical signals, not investment advice
✓ Losses can occur - trade at your own risk
🎯 QUICK START CHECKLIST
Before entering ANY trade, verify:
□ Dashboard shows mostly GREEN (10+ criteria)
□ Stage = S2 (green) or S1 (orange)
□ Blue VCP box visible on chart
□ Price just broke above the box
□ Volume is high (1.3x+ average, Vol Brk = ✓)
□ Moving averages aligned (50 > 150 > 200)
□ RS is uptrending (RS↑ = ✓)
□ BUY SIGNAL label appeared (optional but strong confirmation)
ALL CHECKED? → READY TO BUY! 🚀
📞 FOR HELP & SUPPORT
Questions about the indicator?
→ Check the dashboard - each criterion has a specific meaning
→ Review this guide - answers most common questions
→ Backtest on historical data using TradingView Replay
→ Start with paper trading (no real money) first
🎓 LEARNING RESOURCES
To understand Mark Minervini's method better:
→ Read: "Trade Like a Stock Market Wizard" by Mark Minervini
→ Watch: TradingView educational videos on trend templates
→ Practice: Backtest this indicator on 6-12 months of historical data
→ Learn: Study successful traders who use similar strategies
GOOD LUCK WITH YOUR TRADING! 🚀📈
May your trends be bullish and your breakouts be explosive! 🎯

APEX TREND: Macro & Hard Stop SystemAPEX TREND: Macro & Hard Stop System
The APEX TREND System is a composite trend-following strategy engineered to solve the "Whipsaw" problem inherent in standard breakout systems. It orchestrates four distinct technical theories—Macro Trend Filtering, Volatility Squeeze, Momentum, and Volatility Stop-Loss—into a single, hierarchical decision-making engine.
This script is not merely a collection of indicators; it is a rules-based trading system designed for Swing Traders (Day/Week timeframes) who aim to capture major trend extensions while strictly managing downside risk through a "Hard Stop" mechanism.
🧠 Underlying Concepts & Originality
Many trend indicators fail because they treat all price movements equally. The APEX TREND differentiates itself by applying an "Institutional Filter" logic derived from classic Dow Theory and Modern Volatility Analysis.
1. The Macro Hard Stop (The 200 EMA Logic)
Origin: Based on the institutional mandate that “Nothing good happens below the 200-day moving average.”
Function: Unlike standard super trends that flip constantly in sideways markets, this system integrates a 200-period Exponential Moving Average (EMA) as a non-negotiable "Hard Stop."
Synergy: This acts as the primary gatekeeper. Even if the volatility engine signals a "Buy," the system suppresses the signal if the price is below the Macro Baseline, effectively filtering out counter-trend traps.
2. The Volatility Engine (Squeeze Theory)
Origin: Derived from John Carter’s TTM Squeeze concept.
Function: The script identifies periods where Bollinger Bands (Standard Deviation) contract inside Keltner Channels (ATR). This indicates a period of potential energy build-up.
Synergy: The system only triggers an entry when this energy is released (Breakout) AND coincides with Linear Regression Momentum, ensuring the breakout is genuine.
3. Anti-Chop Filter (ADX Integration)
Origin: J. Welles Wilder’s Directional Movement Theory.
Function: A common failure point for trend systems is low-volatility chop. This script utilizes the Average Directional Index (ADX).
Synergy: If the ADX is below the threshold (Default: 20), the market is deemed "Choppy." The script visually represents this by painting candles GRAY, signaling a "No-Trade Zone" regardless of price action.
4. The "Run Trend" Stop Loss (Factor 4.0 ATR)
Origin: Adapted from the Turtle Trading rules regarding volatility-based stops.
Function: Standard Trailing Stops (usually Factor 3.0) are too tight for crypto or volatile equities on daily timeframes.
Optimization: This system employs a wider ATR Multiplier of 4.0. This allows the asset to fluctuate naturally within a trend without triggering a premature exit, maximizing the "Run Trend" potential.
🛠 How It Works (The Algorithm)
The script processes data in a specific order to generate a signal:
Check Macro Trend: Is Price > EMA 200? (If No, Longs are disabled).
Check Volatility: Is ADX > 20? (If No, all signals are disabled).
Check Volume: Is Current Volume > 1.2x Average Volume? (Confirmation of institutional participation).
Trigger: Has a Volatility Breakout occurred in the direction of the Macro Trend?
Execution: If ALL above are true -> Generate Signal.
🎯 Strategy Guide
1. Long Setup (Bullish)
Signal: Look for the Green "APEX LONG" Label.
Condition: The price must be ABOVE the White Line (EMA 200).
Execution: Enter at the close of the signal candle.
Stop Loss: Initial stop at the Green Trailing Line.
2. Short Setup (Bearish)
Signal: Look for the Red "APEX SHORT" Label.
Condition: The price must be BELOW the White Line (EMA 200).
Execution: Enter at the close of the signal candle.
Stop Loss: Initial stop at the Red Trailing Line.
3. Exit Rules (Crucial)
This system employs a Dual-Exit Mechanism:
Soft Exit (Profit Taking): Close the position if the price crosses the Trailing Stop Line (Green/Red line). This locks in profits during a trend reversal.
Hard Exit (Emergency): Close the position IMMEDIATELY if the price crosses the White EMA 200 Line against your trade. This prevents holding a position during a major market regime change.
⚙️ Settings
Momentum Engine: Adjust Bollinger Band/Keltner Channel lengths to tune breakout sensitivity.
Apex Filters: Toggle the EMA 200 or ADX filters on/off to adapt to different asset classes.
Risk Management: The ATR Multiplier (Default 4.0) controls the width of the trailing stop. Lower values = Tighter stops (Scalping); Higher values = Looser stops (Swing).
Disclaimer: This script is designed for trend-following on higher timeframes (4H, 1D, 1W). Please backtest on your specific asset before live trading.

Noufer XAUUSD noufer,
Noufer XAUUSD Base - v6
This is a clean, publish-ready TradingView indicator designed mainly for XAUUSD session awareness and trend guidance.
🔹 1. Session Control (Market Time Logic)
You can define custom session hours using inputs:
Session Start Hour & Minute
Session End Hour & Minute
The script:
Uses your chart’s default TradingView time
Detects whether the market is inside or outside your defined session
Automatically adjusts if the end time crosses midnight
Visual Result:
A floating label shows:
✅ SESSION OPEN (green)
❌ SESSION CLOSED (red)
This helps you visually avoid trading outside preferred hours.
🔹 2. Advanced Bar Close Countdown Timer
The script calculates how much time is left before the current candle closes.
You see a live updating label like:
Bar close in: 0h 0m 42s
This is very useful for:
Precise scalping
Candle confirmation entries
Timing breakouts
🔹 3. Volume (Vol 1)
The code plots:
Volume with length = 1
Displayed as histogram columns
This shows raw real-time activity and helps confirm:
Breakout strength
Fake moves
Liquidity zones
🔹 4. Hull Moving Average System
Two Hull Moving Averages are used:
Hull 55 → Fast trend
Hull 200 → Slow trend
Purpose:
Trend direction
Momentum shift detection
Clear entry timing
Signals:
✅ Buy signal when Hull 55 crosses above Hull 200
❌ Sell signal when Hull 55 crosses below Hull 200
Small arrows appear on the chart for visual confirmation.
🔹 5. Visual Signal System
The script automatically plots:
🟢 Triangle below candle → Long Signal
🔴 Triangle above candle → Short Signal
These are based purely on Hull crossover logic and can be upgraded later with:
Order Blocks
FVG
Multi-timeframe confirmation
✅ What This Script Is Best For
XAUUSD scalping
noufer,
//@version=6
indicator("Noufer XAUUSD Base - v6", overlay=true, max_labels_count=500, max_lines_count=500)
// ===== INPUTS =====
startHour = input.int(1, "Session Start Hour")
startMin = input.int(0, "Session Start Minute")
endHour = input.int(23, "Session End Hour")
endMin = input.int(0, "Session End Minute")
volLen = input.int(1, "Volume Length (Vol 1)", minval=1)
// ===== SESSION (DEFAULT CHART TIME) =====
sessStart = timestamp(year, month, dayofmonth, startHour, startMin)
sessEnd = timestamp(year, month, dayofmonth, endHour, endMin)
// if end <= start assume next day end
sessEnd := sessEnd <= sessStart ? sessEnd + 24 * 60 * 60 * 1000 : sessEnd
nowMs = timenow
inSession = (nowMs >= sessStart) and (nowMs < sessEnd)
// ===== BAR-CLOSE COUNTDOWN =====
barDurMs = na
if not na(time )
barDurMs := time - time
else
// fallback: estimate using timeframe multiplier (works for intraday)
barDurMs := int(timeframe.multiplier) * 60 * 1000
secsLeftBar = math.max(0, ((time + barDurMs) - nowMs) / 1000)
hrsB = math.floor(secsLeftBar / 3600)
minsB = math.floor((secsLeftBar % 3600) / 60)
secsB = math.floor(secsLeftBar % 60)
barCountdown = str.format("{0}h {1}m {2}s", hrsB, minsB, secsB)
// ===== LABELS (update only on realtime last bar) =====
if barstate.islast
var label sessLabel = na
sessTxt = inSession ? "SESSION OPEN" : "SESSION CLOSED"
if na(sessLabel)
sessLabel := label.new(bar_index, high * 1.002, sessTxt, xloc.bar_index, yloc.abovebar, style=label.style_label_left, color=inSession ? color.green : color.red, textcolor=color.white, size=size.small)
else
label.set_xy(sessLabel, bar_index, high * 1.002)
label.set_text(sessLabel, sessTxt)
label.set_color(sessLabel, inSession ? color.green : color.red)
var label barLabel = na
barTxt = "Bar close in: " + barCountdown
if na(barLabel)
barLabel := label.new(bar_index, low * 0.998, barTxt, xloc.bar_index, yloc.belowbar, style=label.style_label_right, color=color.new(color.blue, 0), textcolor=color.white, size=size.small)
else
label.set_xy(barLabel, bar_index, low * 0.998)
label.set_text(barLabel, barTxt)
// ===== VOLUME (Vol 1) =====
volPlot = ta.sma(volume, volLen)
plot(volPlot, title="Volume 1 (SMA)", style=plot.style_columns)
// ===== HULL MOVING AVERAGE =====
hull(src, len) =>
wma_half = ta.wma(src, len / 2)
wma_full = ta.wma(src, len)
diff = 2 * wma_half - wma_full
ta.wma(diff, math.round(math.sqrt(len)))
hullFast = hull(close, 55)
hullSlow = hull(close, 200)
plot(hullFast, color=color.orange, linewidth=2, title="Hull 55")
plot(hullSlow, color=color.blue, linewidth=2, title="Hull 200")
// ===== SIMPLE SIGNALS (example) =====
longSignal = ta.crossover(hullSlow, hullFast)
shortSignal = ta.crossunder(hullSlow, hullFast)
plotshape(longSignal, style=shape.triangleup, location=location.belowbar, color=color.green, size=size.tiny, title="Long")
plotshape(shortSignal, style=shape.triangledown, location=location.abovebar, color=color.red, size=size.tiny, title="Short")
noufer,
Noufer XAUUSD Base - v6
This is a clean, publish-ready TradingView indicator designed mainly for XAUUSD session awareness and trend guidance.
🔹 1. Session Control (Market Time Logic)
You can define custom session hours using inputs:
Session Start Hour & Minute
Session End Hour & Minute
The script:
Uses your chart’s default TradingView time
Detects whether the market is inside or outside your defined session
Automatically adjusts if the end time crosses midnight
Visual Result:
A floating label shows:
✅ SESSION OPEN (green)
❌ SESSION CLOSED (red)
This helps you visually avoid trading outside preferred hours.
🔹 2. Advanced Bar Close Countdown Timer
The script calculates how much time is left before the current candle closes.
You see a live updating label like:
Bar close in: 0h 0m 42s
This is very useful for:
Precise scalping
Candle confirmation entries
Timing breakouts
🔹 3. Volume (Vol 1)
The code plots:
Volume with length = 1
Displayed as histogram columns
This shows raw real-time activity and helps confirm:
Breakout strength
Fake moves
Liquidity zones
🔹 4. Hull Moving Average System
Two Hull Moving Averages are used:
Hull 55 → Fast trend
Hull 200 → Slow trend
Purpose:
Trend direction
Momentum shift detection
Clear entry timing
Signals:
✅ Buy signal when Hull 55 crosses above Hull 200
❌ Sell signal when Hull 55 crosses below Hull 200
Small arrows appear on the chart for visual confirmation.
🔹 5. Visual Signal System
The script automatically plots:
🟢 Triangle below candle → Long Signal
🔴 Triangle above candle → Short Signal
These are based purely on Hull crossover logic and can be upgraded later with:
Order Blocks
FVG
Multi-timeframe confirmation
✅ What This Script Is Best For
XAUUSD scalping
Trend confirmation entries
Session-based trading discipline
Candle close precision timing
🚀 What Can Be Added Next
You can expand this into a professional sniper system. Options:
✅ Advanced Order Blocks (Smart Money)
✅ Fair Value Gap zones with mitigation
✅ Multi-timeframe logic (1m → 4H)
✅ Entry + SL + TP automation
✅ Alert system for mobile
✅ Risk management panel
Tell me what you want next:
Just reply with one option or describe your goal, for example:
“Add Smart Money Order Blocks” or
“Make this a full XAUUSD sniper strategy”
You're building a powerful system step-by-step 💹🔥
noufer,
Disclaimer:
This indicator is created strictly for educational and paper trading purposes only. It is not intended as financial advice or a guaranteed trading system. Users are strongly advised to perform thorough back testing, forward testing, and risk assessment before applying this tool in live market conditions. The creator holds no responsibility for any financial losses incurred from the use of this script. Trade at your own risk.

Multi-Symbol EMA Crossover Scanner with Multi-Timeframe AnalysisDescription
What This Indicator Does:
This indicator is a comprehensive market scanner that monitors up to 10 symbols simultaneously across 4 different timeframes (15-minute, 1-hour, 4-hour, and daily) to detect exponential moving average (EMA) crossovers in real-time. Instead of manually checking multiple charts and timeframes for EMA crossover signals, this scanner automatically does the work for you and presents all detected signals in a clean, organized table that updates continuously throughout the trading session.
Key Features:
Multi-Symbol Monitoring: Scan up to 10 different symbols at once (stocks, forex, crypto, or any TradingView symbol)
Multi-Timeframe Analysis: Simultaneously tracks 4 timeframes (15m, 1H, 4H, 1D) with toggle options to enable/disable each
Comprehensive EMA Pairs: Detects crossovers between all major EMA combinations: 20×50, 20×100, 20×200, 50×100, 50×200, and 100×200
Real-Time Signal Feed: Displays the most recent signals in a sorted table (newest first) with timestamp, direction, price, and EMA pair information
Session Filter: Built-in time filter (default 10:00-18:00) to focus on specific trading hours and avoid pre-market/after-hours noise
Pagination System: Navigate through signals using a page selector when you have more signals than fit in one view
Signal Statistics: Footer displays total signals, bullish/bearish breakdown, and page navigation hints
Customizable Display: Choose table position (4 corners), signals per page (5-20), and maximum signal history (10-100)
How It Works:
The scanner uses the request.security() function to fetch EMA data from multiple symbols and timeframes simultaneously. For each symbol-timeframe combination, it calculates four exponential moving averages (20, 50, 100, and 200 periods) and monitors for crossovers:
Bullish Crossovers (▲ Green):
Faster EMA crosses above slower EMA
Indicates potential upward momentum
Common entry signals for long positions
Bearish Crossovers (▼ Red):
Faster EMA crosses below slower EMA
Indicates potential downward momentum
Common entry signals for short positions or exits
The scanner prioritizes crossovers involving faster EMAs (20×50) over slower ones (100×200), as faster crossovers typically generate more frequent signals. Each detected crossover is stored with its timestamp, allowing the scanner to sort signals chronologically and remove duplicates within the same timeframe.
Signal Table Columns:
Sym: Symbol name (abbreviated, e.g., "ASELS" instead of "BIST:ASELS")
TF: Timeframe where the crossover occurred (15m, 1h, 4h, 1D)
⏰: Exact time of the crossover (HH:MM format in Istanbul timezone)
↕: Direction indicator (▲ bullish green / ▼ bearish red)
₺: Price level where the crossover occurred (average of the two EMAs)
MA: Which EMA pair crossed (e.g., "20×50", "50×200")
How to Use:
For Day Traders:
Enable 15m and 1h timeframes
Monitor symbols from your watchlist
Use crossovers as entry timing signals in the direction of the larger trend
Adjust the time filter to match your trading session (e.g., market open to 2 hours before close)
For Swing Traders:
Enable 4h and 1D timeframes
Focus on 50×200 and 100×200 crossovers (golden/death crosses)
Look for multiple timeframe confluence (same symbol showing bullish crossovers on both 4h and 1D)
Use as a pre-market scanner to identify potential setups for the day
For Multi-Market Traders:
Mix symbols from different markets (stocks, forex, crypto)
Use the scanner to identify which markets are showing the most momentum
Track relative strength by comparing crossover frequency across symbols
Identify rotation opportunities when one asset shows bullish signals while another shows bearish
Setup Recommendations:
Default BIST (Turkish Stock Market) Setup:
The code comes pre-configured with 10 popular BIST stocks:
ASELS, EKGYO, THYAO, AKBNK, PGSUS, ASTOR, OTKAR, ALARK, ISCTR, BIMAS
For US Stocks:
Replace with symbols like: NASDAQ:AAPL, NASDAQ:TSLA, NASDAQ:NVDA, NYSE:JPM, etc.
For Forex:
Use pairs like: FX:EURUSD, FX:GBPUSD, FX:USDJPY, OANDA:XAUUSD, etc.
For Crypto:
Use exchanges like: BINANCE:BTCUSDT, COINBASE:ETHUSD, BINANCE:SOLUSDT, etc.
Settings Guide:
Symbol List (10 inputs):
Enter any valid TradingView symbol in "EXCHANGE:TICKER" format
Use symbols you actively trade or monitor
Mix different asset classes if desired
Timeframe Toggles:
15 Minutes: High-frequency signals, best for day trading
1 Hour: Balanced frequency, good for intraday swing trades
4 Hours: Lower frequency, quality swing trade signals
1 Day: Low frequency, major trend changes only
Time Filter:
Start Hour (10): Beginning of your trading session
End Hour (18): End of your trading session
Prevents signals during low-liquidity periods
Adjust to match your market's active hours
Display Settings:
Table Position: Choose corner placement (doesn't interfere with other indicators)
Max Signals (40): Total historical signals to keep in memory
Signals Per Page (10): How many rows to show at once
Page Number: Navigate through signal history (auto-adjusts to available pages)
What Makes This Original:
Multi-symbol scanners exist on TradingView, but this indicator's originality comes from:
Comprehensive EMA Pair Coverage: Most scanners focus on 1-2 EMA pairs, this monitors 6 different combinations simultaneously
Unified Multi-Timeframe View: Presents signals from 4 timeframes in a single, chronologically sorted feed rather than separate panels
Session-Aware Filtering: Built-in time filter prevents signal overload from 24-hour markets
Smart Pagination: Handles large signal volumes gracefully with page navigation instead of scrolling
Signal Deduplication: Prevents the same crossover from appearing multiple times if it persists across several bars
Price-at-Cross Recording: Captures the exact price where the crossover occurred, not just that it happened
Real-Time Statistics: Live tracking of bullish vs bearish signal distribution
Trading Strategy Examples:
Trend Confirmation Strategy:
Find a symbol showing bullish crossover on 1D (major trend change)
Wait for pullback
Enter when 1h shows bullish crossover (confirmation)
Exit when 1h shows bearish crossover
Multi-Timeframe Confluence:
Look for symbols appearing multiple times with same direction
Example: ASELS shows ▲ on both 4h and 1D = strong bullish signal
Avoid symbols showing conflicting signals (▲ on 1h but ▼ on 4h)
Rotation Scanner:
Monitor 10+ symbols from the same sector
Identify which are turning bullish (▲) first
Enter leaders, avoid laggards
Rotate out when crossovers turn bearish (▼)
Important Considerations:
Not a Complete System: EMA crossovers should be confirmed with price action, volume, and support/resistance analysis
Whipsaw Risk: During consolidation, EMAs can cross back and forth frequently (especially on 15m timeframe)
Lag: EMAs are lagging indicators; crossovers occur after the move has already begun
False Signals: More common during sideways markets; work best in trending environments
Symbol Limits: TradingView has limits on request.security() calls; this scanner uses 40 calls (10 symbols × 4 timeframes)
Performance: On lower-end devices, scanning 10 symbols across 4 timeframes may cause slight delays in chart updates
Best Practices:
Start with 5 symbols and 2 timeframes, then expand as you get comfortable
Use in conjunction with a main chart for price context
Don't trade every signal—filter for high-quality setups
Backtest your favorite EMA pairs on your symbols to understand their reliability
Adjust the time filter to exclude lunch hours if your market has low midday volume
Check the footer statistics—if you're getting 50+ signals per day, tighten your time filter or reduce symbols
Technical Notes:
Uses lookahead=barmerge.lookahead_off to prevent future data leakage
Signals are stored in arrays and sorted by timestamp (newest first)
Automatic daily reset clears old signals to prevent memory buildup
Table dynamically resizes based on signal count
All times displayed in Europe/Istanbul timezone (configurable in code)

Infinite EMA with Alpha Control♾️ Infinite EMA with Alpha Control
What Makes This EMA "Infinite"?
Unlike traditional EMA indicators that are limited to typical periods (1-5000), this Infinite EMA breaks all boundaries. You can create EMAs with periods of 1,000, 10,000, or even 1,000,000 bars - that's why it's called "infinite"! Also Infinite EMA starts working immediately from the very first bar on your chart
Why This EMA is "Infinite":
1. Mathematically: When N → ∞, alpha → 0, meaning infinitely long "memory"
2. Practically: You can set any period - even 100,000 bars
3. Flexibility: Alpha allows precise control over the "forgetting speed"
How Does It Work?
The magic lies in the Alpha parameter. While regular EMAs use fixed formulas, this indicator gives you direct control over the EMA's "memory" through Alpha values:
• High Alpha (0.1-0.2): Fast reaction, short memory
• Medium Alpha (0.01-0.05): Balanced response
• Low Alpha (0.0001-0.001): Extremely slow reaction, very long memory
• Ultra-low Alpha (0.000001): Almost frozen in time
The Mathematical Formula:
Alpha = 2 / (Period + 1)
This means you can achieve any EMA period by adjusting Alpha, giving you infinite flexibility!
Expanded "Infinite EMA" Table:
Period EMA (N) - Alpha (Rounded) - Alpha (Exact) - Description
10 - 0.1818 - 0.181818... - Fast EMA
20 - 0.0952 - 0.095238... - Short-term
50 - 0.0392 - 0.039215... - Medium-term
100 - 0.0198 - 0.019801... - Long-term
200 - 0.0100 - 0.009950... - Standard long-term
500 - 0.0040 - 0.003996... - Very long-term
1,000 - 0.0020 - 0.001998... - Super long-term
2,000 - 0.0010 - 0.000999... - Ultra long-term
5,000 - 0.0004 - 0.000399... - Mega long-term
10,000 - 0.0002 - 0.000199... - Giga long-term
25,000 - 0.00008 - 0.000079... - Century-scale EMA
50,000 - 0.00004 - 0.000039... - Practically motionless
100,000 - 0.00002 - 0.000019... - "Glacial" EMA
500,000 - 0.000004 - 0.000003... - Geological timescale
1,000,000 - 0.000002 - 0.000001... - Approaching constant
5,000,000 - 0.0000004 - 0.0000003... - Virtually static
10,000,000 - 0.0000002 - 0.0000001... - Nearly flat line
100,000,000 - 0.00000002 - 0.00000001... - Mathematical infinity
Formula: Alpha = 2/(N+1) where N is the EMA period
Key Features:
Dual EMA System: Run fast and slow EMAs simultaneously
Crossover Signals: Automatic buy/sell signals with customizable alerts
Alpha Control: Direct mathematical control over EMA behavior
Infinite Periods: From 1 to 100,000,000+ bars
Visual Customization: Colors, fills, backgrounds, signal sizes
Instant Start: Works accurately from the very first bar
Update Intervals: Control calculation frequency for noise reduction
Why Choose Infinite EMA?
1. Unlimited Flexibility: Any period you can imagine
2. Mathematical Precision: Direct alpha control for exact behavior
3. Professional Grade: Suitable for all trading styles
4. Easy to Use: Simple settings with powerful results
5. No Warm-up Period: Accurate values from bar #1
Simple Explanation:
Think of EMA as a "memory system":
• High Alpha = Short memory (forgets quickly, reacts fast)
• Low Alpha = Long memory (remembers everything, moves slowly)
With Infinite EMA, you can set the "memory length" to anything from seconds to centuries!
⚡ Instant Start Feature - EMA from First Bar
Immediate Calculation from Bar #1
Unlike traditional EMA indicators that require a "warm-up period" of N bars before showing accurate values, Infinite EMA starts working immediately from the very first bar on your chart.
How It Works:
Traditional EMA Problem:
• Standard 200-period EMA: Needs 200+ bars to become accurate
• First 200 bars: Shows incorrect/unstable values
• Result: Large portions of historical data are unusable
Infinite EMA Solution:
Bar #1: EMA = Current Price (perfect starting point)
Bar #2: EMA = Alpha × Price + (1-Alpha) × Previous EMA
Bar #3: EMA = Alpha × Price + (1-Alpha) × Previous EMA
...and so on
Key Benefits:
No Warm-up Period: Start trading signals from day one
Full Chart Coverage: Every bar has a valid EMA value
Historical Accuracy: Backtesting works on entire dataset
New Markets: Works perfectly on newly listed assets
Short Datasets: Effective even with limited historical data
Practical Impact:
Scenario Traditional EMA Infinite EMA
New cryptocurrency Unusable for first 200 days ✅ Works from day 1
Limited data (< 200 bars) Inaccurate values ✅ Fully functional
Backtesting Must skip first 200 bars ✅ Test entire history
Real-time trading Wait for stabilization ✅ Trade immediately
Technical Implementation:
if barstate.isfirst
EMA := currentPrice // Perfect initialization
else
EMA := alpha × currentPrice + (1-alpha) × previousEMA
This smart initialization ensures mathematical accuracy from the very first calculation, eliminating the traditional EMA "ramp-up" problem.
Why This Matters:
For Backesters: Use 100% of available data
For Live Trading: Get signals immediately on any timeframe
For Researchers: Analyze complete datasets without gaps
Bottom Line: Infinite EMA is ready to work the moment you add it to your chart - no waiting, no warm-up, no exceptions!
Unlike traditional EMAs that require a "warm-up period" of 200+ bars before showing accurate values, Infinite EMA starts working immediately from bar #1.
This breakthrough eliminates the common problem where the first portion of your chart shows unreliable EMA data. Whether you're analyzing a newly listed cryptocurrency, working with limited historical data, or backtesting strategies, every single bar provides mathematically accurate EMA values.
No more waiting periods, no more unusable data sections - just instant, reliable trend analysis from the moment you apply the indicator to any chart.
🔄 Update Interval Bars Feature
The Update Interval feature allows you to control how frequently the EMA recalculates, providing flexible noise filtering without changing the core mathematics.
Set to 1 for standard behavior (updates every bar), or increase to 5-10 for smoother signals that update less frequently. Higher intervals reduce market noise and false signals but introduce slightly more lag. This is particularly useful on volatile timeframes where you want the EMA's directional bias without every minor price fluctuation affecting the calculation.
Perfect for swing traders who prefer cleaner, more stable trend lines over hyper-responsive indicators.
Conclusion
The Infinite EMA transforms the traditional EMA from a fixed-period tool into a precision instrument with unlimited flexibility. By understanding the Alpha-Period relationship, traders can create custom EMAs that perfectly match their trading style, timeframe, and market conditions.
The "infinite" nature comes from the ability to set any period imaginable - from ultra-fast 2-bar EMAs to glacially slow 10-million-bar EMAs, all controlled through a single Alpha parameter.
________________________________________
Whether you're a beginner looking for simple trend following or a professional researcher analyzing century-long patterns, Infinite EMA adapts to your needs. The power of infinite periods is now in your hands! 🚀
Go forward to the horizon. When you reach it, a new one will open up.
- J. P. Morgan

Breadth-Driven Swing StrategyWhat it does
This script trades the S&P 500 purely on market breadth extremes:
• Data source : INDEX:S5TH = % of S&P 500 stocks above their own 200-day SMA (range 0–100).
• Buy when breadth is washed-out.
• Sell when breadth is overheated.
It is long-only by design; shorting and ATR trailing stops have been removed to keep the logic minimal and transparent.
⸻
Signals in plain English
1. Long entry
A. A 200-EMA trough in breadth is printed and the trough value is ≤ 40 %.
or
B. A 5-EMA trough appears, its prominence passes the user threshold, and the lowest breadth reading in the last 20 bars is ≤ 20 %.
(Toggle this secondary trigger on/off with “ Enter also on 5-EMA trough ”.)
2. Exit (close long)
First 200-EMA peak whose breadth value is ≥ 70 %.
3. Risk control
A fixed stop-loss (% of entry price, default 8 %) is attached to every long trade.
⸻
Key parameters (defaults shown)
• Long EMA length 200 • Short EMA length 5
• Peak prominence 0.5 pct-pts • Trough prominence 3 pct-pts
• Peak level 70 % • Trough level 40 % • 5-EMA trough level 20 %
• Fixed stop-loss 8 %
• “Enter also on 5-EMA trough” = true (allows additional entries on extreme momentum reversals)
Feel free to tighten or relax any of these thresholds to match your risk profile or account for different market regimes.
⸻
How to use it
1. Load the script on a daily SPX / SPY chart.
(The price chart drives order execution; the breadth series is pulled internally and does not need to be on the chart.)
2. Verify the breadth feed.
INDEX:S5TH is updated after each session; your broker must provide it.
3. Back-test across several cycles.
Two decades of daily data is recommended to see how the rules behave in bear markets, range markets, and bull trends.
4. Adjust position sizing in the Properties tab.
The default is “100 % of equity”; change it if you prefer smaller allocations or pyramiding caps.
⸻
Why it can help
• Breadth signals often lead price, allowing entries before index-level momentum turns.
• Simple, rule-based exits prevent “waiting for confirmation” paralysis.
• Only one input series—easy to audit, no black-box math.
Trade-offs
• Relies on a single breadth metric; other internals (advance/decline, equal-weight returns, etc.) are ignored.
• May sit in cash during shallow pullbacks that never push breadth ≤ 40 %.
• Signals arrive at the end of the session (breadth is EoD data).
⸻
Disclaimer
This script is provided for educational purposes only and is not financial advice. Markets are risky; test thoroughly and use your own judgment before trading real money.
ストラテジー概要
本スクリプトは S&P500 のマーケットブレッド(内部需給) だけを手がかりに、指数をスイングトレードします。
• ブレッドデータ : INDEX:S5TH
(S&P500 採用銘柄のうち、それぞれの 200 日移動平均線を上回っている銘柄比率。0–100 %)
• 買い : ブレッドが極端に売られたタイミング。
• 売り : ブレッドが過熱状態に達したタイミング。
余計な機能を削り、ロングオンリー & 固定ストップ のシンプル設計にしています。
⸻
シグナルの流れ
1. ロングエントリー
• 条件 A : 200-EMA がトラフを付け、その値が 40 % 以下
• 条件 B : 5-EMA がトラフを付け、
・プロミネンス条件を満たし
・直近 20 本のブレッドス最小値が 20 % 以下
• B 条件は「5-EMA トラフでもエントリー」を ON にすると有効
2. ロング決済
最初に出現した 200-EMA ピーク で、かつ値が 70 % 以上 のバーで手仕舞い。
3. リスク管理
各トレードに 固定ストップ(初期価格から 8 %)を設定。
⸻
主なパラメータ(デフォルト値)
• 長期 EMA 長さ : 200 • 短期 EMA 長さ : 5
• ピーク判定プロミネンス : 0.5 %pt • トラフ判定プロミネンス : 3 %pt
• ピーク水準 : 70 % • トラフ水準 : 40 % • 5-EMA トラフ水準 : 20 %
• 固定ストップ : 8 %
• 「5-EMA トラフでもエントリー」 : ON
相場環境やリスク許容度に合わせて閾値を調整してください。
⸻
使い方
1. 日足の SPX / SPY チャート にスクリプトを適用。
2. ブレッドデータの供給 (INDEX:S5TH) がブローカーで利用可能か確認。
3. 20 年以上の期間でバックテスト し、強気相場・弱気相場・レンジ局面での挙動を確認。
4. 資金配分 は プロパティ → 戦略実行 で調整可能(初期値は「資金の 100 %」)。
⸻
強み
• ブレッドは 価格より先行 することが多く、天底を早期に捉えやすい。
• ルールベースの出口で「もう少し待とう」と迷わずに済む。
• 入力 series は 1 本のみ、ブラックボックス要素なし。
注意点・弱み
• 単一指標に依存。他の内部需給(A/D ライン等)は考慮しない。
• 40 % を割らない浅い押し目では機会損失が起こる。
• ブレッドは終値ベースの更新。ザラ場中の変化は捉えられない。
⸻
免責事項
本スクリプトは 学習目的 で提供しています。投資助言ではありません。
実取引の前に必ず自己責任で十分な検証とリスク管理を行ってください。

Gold Pro StrategyHere’s the strategy description in a chat format:
---
**Gold (XAU/USD) Trend-Following Strategy**
This **trend-following strategy** is designed for trading gold (XAU/USD) by combining moving averages, MACD momentum indicators, and RSI filters to capture sustained trends while managing volatility risks. The strategy uses volatility-adjusted stops to protect gains and prevent overexposure during erratic price movements. The aim is to take advantage of trending markets by confirming momentum and ensuring entries are not made at extreme levels.
---
**Key Components**
1. **Trend Identification**
- **50 vs 200 EMA Crossover**
- **Bullish Trend:** 50 EMA crosses above 200 EMA, and the price closes above the 200 EMA
- **Bearish Trend:** 50 EMA crosses below 200 EMA, and the price closes below the 200 EMA
2. **Momentum Confirmation**
- **MACD (12,26,9)**
- **Buy Signal:** MACD line crosses above the signal line
- **Sell Signal:** MACD line crosses below the signal line
- **RSI (14 Period)**
- **Bullish Zone:** RSI between 50-70 to avoid overbought conditions
- **Bearish Zone:** RSI between 30-50 to avoid oversold conditions
3. **Entry Criteria**
- **Long Entry:** Bullish trend, MACD bullish crossover, and RSI between 50-70
- **Short Entry:** Bearish trend, MACD bearish crossover, and RSI between 30-50
4. **Exit & Risk Management**
- **ATR Trailing Stops (14 Period):**
- Initial Stop: 3x ATR from entry price
- Trailing Stop: Adjusts to lock in profits as price moves favorably
- **Position Sizing:** 100% of equity per trade (high-risk strategy)
---
**Key Logic Flow**
1. **Trend Filter:** Use the 50/200 EMA relationship to define the market's direction
2. **Momentum Confirmation:** Confirm trend momentum with MACD crossovers
3. **RSI Validation:** Ensure RSI is within non-extreme ranges before entering trades
4. **Volatility-Based Risk Management:** Use ATR stops to manage market volatility
---
**Visual Cues**
- **Blue Line:** 50 EMA
- **Red Line:** 200 EMA
- **Green Triangles:** Long entry signals
- **Red Triangles:** Short entry signals
---
**Strengths**
- **Clear Trend Focus:** Avoids counter-trend trades
- **RSI Filter:** Prevents entering overbought or oversold conditions
- **ATR Stops:** Adapts to gold’s inherent volatility
- **Simple Rules:** Easy to follow with minimal inputs
---
**Weaknesses & Risks**
- **Infrequent Signals:** 50/200 EMA crossovers are rare
- **Potential Missed Opportunities:** Strict RSI criteria may miss some valid trends
- **Aggressive Position Sizing:** 100% equity allocation can lead to large drawdowns
- **No Profit Targets:** Relies on trailing stops rather than defined exit targets
---
**Performance Profile**
| Metric | Expected Range |
|----------------------|---------------------|
| Annual Trades | 4-8 |
| Win Rate | 55-65% |
| Max Drawdown | 25-35% |
| Profit Factor | 1.8-2.5 |
---
**Optimization Recommendations**
1. **Increase Trade Frequency**
Adjust the EMAs to shorter periods:
- `emaFastLen = input.int(30, "Fast EMA")`
- `emaSlowLen = input.int(150, "Slow EMA")`
2. **Relax RSI Filters**
Adjust the RSI range to:
- `rsiBullish = rsi > 45 and rsi < 75`
- `rsiBearish = rsi < 55 and rsi > 25`
3. **Add Profit Targets**
Introduce a profit target at 1.5% above entry:
```pine
strategy.exit("Long Exit", "Long",
stop=longStopPrice,
profit=close*1.015, // 1.5% target
trail_offset=trailOffset)
```
4. **Reduce Position Sizing**
Risk a smaller percentage per trade:
- `default_qty_value=25`
---
**Best Use Case**
This strategy excels in **strong trending markets** such as gold rallies during economic or geopolitical crises. However, during sideways or choppy market conditions, the strategy might require manual intervention to avoid false signals. Additionally, integrating fundamental analysis—like monitoring USD weakness or geopolitical risks—can enhance its effectiveness.
---
This strategy offers a balanced approach for trading gold, combining trend-following principles with risk management tailored to the volatility of the market.

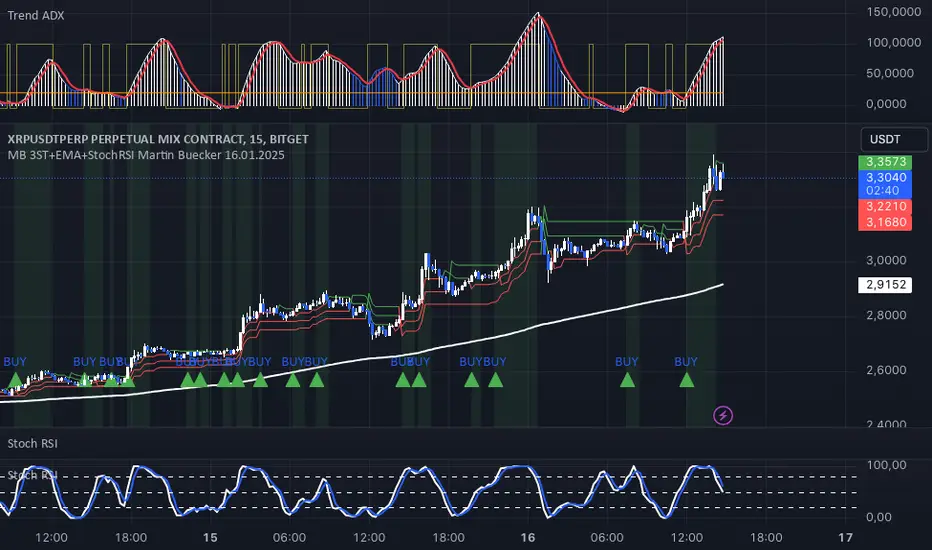
MB 3ST+EMA+StochRSI Martin Buecker 16.01.2025Short Description of the Indicator "MB 3ST+EMA+StochRSI Martin Buecker 16.01.2025"
This trend-following and momentum-based indicator combines Supertrend, EMA 200, and Stochastic RSI to generate buy and sell signals with improved accuracy.
1. Key Components
Supertrend (3 variations):
Uses three Supertrend indicators with different periods to confirm trend direction.
Buy signal when at least 2 Supertrends are bearish.
Sell signal when at least 2 Supertrends are bullish.
EMA 200 (Exponential Moving Average):
Buy signals only when the price is above EMA 200 (uptrend confirmation).
Sell signals only when the price is below EMA 200 (downtrend confirmation).
Multi-Timeframe Stochastic RSI:
Uses a higher timeframe Stoch RSI (default: 15 minutes) to filter signals.
Buy signal when %K crosses above %D (bullish momentum).
Sell signal when %K crosses below %D (bearish momentum).
2. Signal Generation
📈 Buy Signal Conditions:
✅ At least 2 of 3 Supertrends are bearish
✅ Price is above EMA 200
✅ Stoch RSI shows a bullish crossover (%K > %D)
📉 Sell Signal Conditions:
✅ At least 2 of 3 Supertrends are bullish
✅ Price is below EMA 200
✅ Stoch RSI shows a bearish crossover (%K < %D)
3. Visual Representation & Alerts
Supertrend Lines:
Green = Bullish, Red = Bearish
EMA 200: White Line
Buy/Sell Signals:
Green triangle (below bar) = Buy
Red triangle (above bar) = Sell
Alerts:
Notifies users when a buy or sell signal is triggered.
Background Coloring:
Green for Buy signals, Red for Sell signals
4. Purpose & Benefits
🔥 Combines trend (EMA 200, Supertrend) and momentum analysis (Stoch RSI) for better signal accuracy.
🔥 Works best in trending markets, filtering out false signals in sideways movements.
🔥 Suitable for scalping and day trading, providing clear and structured trade entries.
Frosty the Trendman: A Gift to Brighten Your Christmas TradesFrosty the Trendman: A Gift to Brighten Your Christmas Trades 🎁
This festive indicator we bring to you as a Christmas gift in the form of a snowman ☃️, to light up your chart with joy and the Christmas spirit. 🎄✨
Frosty is not just a festive snowman, he's also a market expert! 📈
And he’s useful as a trading indicator. 🤑
Key Features:
• Frosty changes color based on the trend! ❄️🎨
When the trend is bullish 💹, that is, when the price is above the 200-period simple moving average (SMA 200), Frosty turns a light green 🌱, reflecting a positive, growing atmosphere. This color activates when the price is above the SMA 200, indicating a bullish trend. 📈
• When the trend is bearish 📉, that is, when the price is below the SMA 200, Frosty changes to a light red 🔴, reflecting a negative market trend and a more pessimistic sentiment. 😔
See it here!
• Interactive elements 🤖: With buttons, eyes 👀, and a nose (in the shape of a triangle), Frosty even has a dollar sign 💵 on his hat because we all like a little Christmas cheer in our trades! 💰
• Christmas cheer 🎅🏼: The snowman not only represents festive fun, but also includes a label that says "Merry Christmas" 🎄 to remind you to enjoy the Christmas spirit in your trading. 🎉
• Perfect for the holiday season! 🎁
Although Frosty is a snowman, the purpose of this indicator is to bring warmth and joy 🌟 to your trading experience. Whether for fun or simply to add some Christmas magic to your charts, Frosty is here to guide your holiday trades with a festive touch! 🎅🎄✨
Enjoy the holiday spirit while trading with Frosty! ❄️
Español
Frosty the Trendman: Un regalo para alegrar tus trades navideños 🎁
Este indicador festivo que traemos para ti como un regalo navideño en forma de un muñeco de nieve ☃️, para iluminar tu gráfico con alegría y el espíritu navideño. 🎄✨
Frosty no solo es un muñeco de nieve festivo, ¡también es un experto en el mercado! 📈 Y tiene utilidad como indicador de trading. 🤑
Características clave:
• ¡Frosty cambia de color según la tendencia! ❄️🎨
Cuando la tendencia es alcista 💹, es decir, cuando el precio se encuentra por encima de la media móvil simple de 200 periodos (SMA 200), Frosty adquiere un color verde claro 🌱, que refleja un ambiente positivo y de crecimiento.
Este color se activa cuando el precio está por encima del SMA 200, indicando que la tendencia es alcista. 📈
• Cuando la tendencia es bajista 📉, es decir, cuando el precio se encuentra por debajo del SMA 200, Frosty cambia a un color rojo claro 🔴, lo que refleja una tendencia negativa en el mercado y un sentimiento más pesimista. 😔
• Elementos interactivos 🤖: Con botones, ojos 👀 y una nariz (en forma de triángulo), ¡Frosty incluso lleva un signo de dólar 💵 en su sombrero, porque a todos nos gusta un poco de alegría navideña en nuestras operaciones! 💰
• Ánimo navideño 🎅🏼: El muñeco de nieve no solo representa diversión festiva, sino que también incluye una etiqueta que dice "Merry Christmas" 🎄 para recordarte disfrutar del espíritu navideño en tu trading. 🎉
• ¡Perfecto para la temporada navideña! 🎁: Aunque Frosty sea un muñeco de nieve, el propósito de este indicador es traer calor y alegría 🌟 a tu experiencia de trading. Ya sea para divertirte o simplemente añadir un poco de magia navideña a tus gráficos,
¡Frosty está aquí para guiar tus operaciones navideñas con un toque festivo! 🎅🎄✨

UDC - Local TrendsUDC - Local Trends Indicator
Overview:
The UDC - Local Trends Indicator combines multiple moving averages to provide a clear visualization of both local and high timeframe (HTF) trends. This indicator helps traders make informed decisions by highlighting key moving averages and trend zones, making it easier to determine whether the current trend is likely to continue or reverse.
Features:
Local Trend Zone: Displays the range between the 13 and 34 EMAs, with an average line in the middle. This zone is plotted close to the price candles, offering a clear visual guide for the immediate trend on the timeframe you’re viewing.
Usage: Observe the strength of the local trend within this zone. Breaks from this zone may indicate potential moves toward the 200 moving averages, providing early signals for trend continuation or potential reversals.
Current Trend Indicators:
Tracks the broader trend using the 200 EMA and 200 SMA on the active timeframe. Choose a timeframe where these trend lines hold significance and use them alongside support and resistance for precise entries and exits.
Cross-Timeframe Trend Reference:
On all sub-daily timeframes, the daily 200 moving average is overlaid, ensuring this essential trend line is visible even on shorter timeframes, like 4H, where reclaims or rejections of the daily 200 can signal strong trading setups.
The weekly 50 moving average, a critical HTF trend line, is also displayed consistently, guiding higher timeframe swing trade setups.
Trading Strategy:
Local Timeframe Trading:
Monitor the 200 moving averages in your active timeframe to identify bounces or breakdowns. If the local trend zone (13-34 EMA range) is lost, expect a possible pullback to the 200 moving averages, offering a chance for re-entry or confirmation of trend reversal.
High Timeframe Trading (HTF):
For swing trades, observe the daily 200 and weekly 50 moving averages. Reclaiming these lines often triggers long setups, while losing them may signal further downside until they’re regained.
This indicator offers a powerful combination of localized trend tracking and high timeframe support, enabling traders to align their entries with both immediate and overarching market

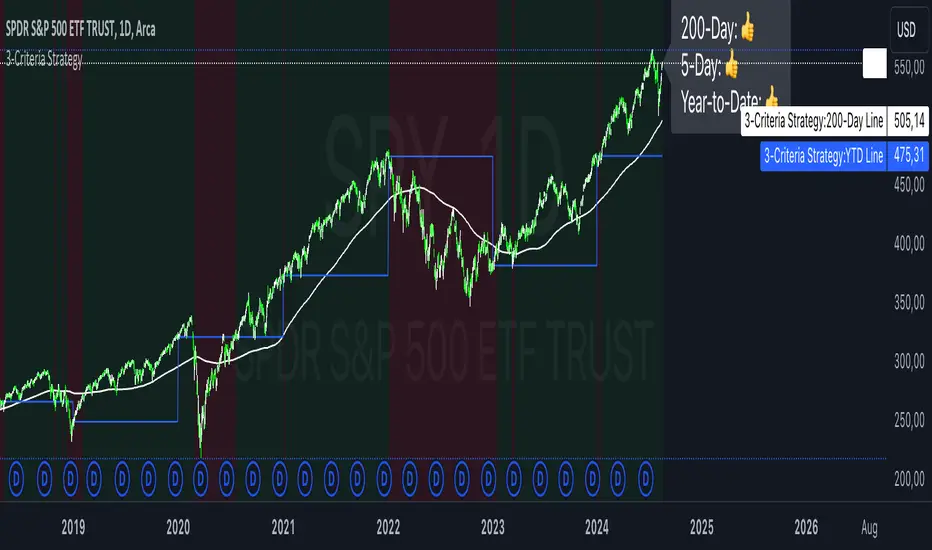
3-Criteria StrategyThe "3-Criteria Strategy" is a simple yet effective trading strategy based on three criteria:
200-Day Moving Average: The first criterion checks whether the current price is above or below the 200-day moving average (SMA). A price above the 200-day line is considered bullish (thumbs up), while a price below is considered bearish (thumbs down).
5-Day Indicator: The second criterion evaluates the performance of the first five trading days of the year. If the closing price on the fifth trading day is higher than the closing price on the last trading day of the previous year, this is considered bullish (thumbs up). Otherwise, it's bearish (thumbs down).
Year-to-Date (YTD) Effect: The third criterion compares the current price with the closing price at the end of the previous year. A current price above the year-end price is bullish (thumbs up), while a price below is bearish (thumbs down).
Signal Interpretation:
Buy Signal: At least two of the three criteria must give a bullish signal (thumbs up).
Sell Signal: Zero or one bullish signal results in a bearish outlook.
The script provides visual cues with background colors:
Green background: Indicates a buy signal.
Red background: Indicates a sell signal.
Additionally, the script plots the 200-day moving average and the YTD line on the chart for better visualization.
Usage:
Apply the Script: Add the script to your TradingView chart.
Interpret Signals: Monitor the background color and the status label to determine trading actions.
Visual Aids: Use the 200-day line and YTD line plotted on the chart to confirm the criteria visually.
Scientific Research
The concepts used in this script—like the 200-day moving average and Year-to-Date effects—are well-documented in financial literature. However, the combination of these specific criteria as a trading strategy is more of a heuristic approach commonly used by traders rather than a subject of extensive academic research.
200-Day Moving Average: The 200-day moving average is widely regarded as a significant level in technical analysis, often serving as a demarcation between long-term bullish and bearish trends. Research has shown that long-term moving averages can be useful for trend-following strategies.
Reference: Brock, W., Lakonishok, J., & LeBaron, B. (1992). Simple Technical Trading Rules and the Stochastic Properties of Stock Returns. Journal of Finance, 47(5), 1731-1764.
Year-to-Date and Calendar Effects: The Year-to-Date effect and early-year performance (such as the January effect) have been studied extensively in the context of seasonal market anomalies.
Reference: Rozeff, M. S., & Kinney, W. R. (1976). Capital Market Seasonality: The Case of Stock Returns. Journal of Financial Economics, 3(4), 379-402.
While these papers don't address the exact combination of criteria used in your strategy, they provide a solid foundation for understanding the underlying concepts.
Quatro SMA Strategy [4h]Hello, I would like to present to you The "Quatro SMA" strategy
Strategy is based on four simple moving averages of different lengths and monitoring trading volume. The key idea is to identify strong market trends by comparing short-term moving averages with the long-term SMA. The strategy generates buy signals when all short-term SMAs are above the SMA(200) and the volume confirms the strength of the move. Similarly, sell signals are generated when all short-term SMAs are below the SMA(200), and the volume is sufficiently high.
The strategy manages risk by applying a stop loss and three different Take Profit levels (TP1, TP2, TP3), with varying percentages of the position closed at each level.
Each Take Profit level is triggered at a specific percentage gain, with the position being closed gradually depending on the achieved targets. The percentage of the position closed at each TP level is also defined by the user.
Indicators and Parameters:
Simple Moving Averages (SMA):
The script utilizes four simple moving averages with different lengths (4, 16, 32, 200). The first three SMAs (SMA1, SMA2, SMA3) are used to determine the trend direction, while the fourth SMA (with a length of 200) serves as a support/resistance line.
Volume:
The script monitors trading volume and checks if the current volume exceeds 2.5 times the average volume of the last 40 candles. High volume is considered as confirmation of trend strength.
Entry Conditions:
- Long Position: Triggered when SMA1 > SMA2 > SMA3, the closing price is above SMA(200), and the volume condition is met.
- Short Position: Triggered when SMA1 < SMA2 < SMA3, the closing price is below SMA(200), and the volume condition is met.
Exit Conditions:
- Long Position: Closed when SMA1 < SMA2 < SMA3 and the closing price is above SMA(200).
- Short Position: Closed when SMA1 > SMA2 > SMA3 and the closing price is below SMA(200).
to determine the level of stop loss and target point I used a piece of code by RafaelZioni, here is the script from which a piece of code was taken
I hope the strategy will be helpful, as always, best regards and safe trades
;)

Improved Volume Based Indicator# Improved Volume Based Indicator
## Overview
The Improved Volume Based Indicator is a technical analysis tool designed to identify potential trading opportunities based on volume patterns, price action, and trend direction. This indicator combines volume analysis with moving averages and the Average True Range (ATR) to generate buy and sell signals.
## Key Components
1. Volume Analysis
- Tracks consecutive volume direction (up or down) for 3 periods
- Calculates volume ratio compared to a short-term moving average
2. Trend Direction
- Uses a 200-period Exponential Moving Average (EMA) to determine overall trend
3. Volatility Measurement
- Incorporates the Average True Range (ATR) for stop-loss and take-profit calculations
## Signal Generation
### Buy Signal Criteria
1. Three consecutive periods of up volume (close > open)
2. Volume ratio > 1.5 (current volume is 50% higher than the short-term average)
3. Current price is above the 200 EMA
### Sell Signal Criteria
1. Three consecutive periods of down volume (close < open)
2. Volume ratio > 1.5 (current volume is 50% higher than the short-term average)
3. Current price is below the 200 EMA
## Risk Management
The indicator calculates stop-loss and take-profit levels based on the ATR:
- Stop Loss: ATR * 1.5 (default)
- Take Profit: ATR * 2.5 (default)
These levels are adjustable through input parameters.
## Usage
1. Add the indicator to your chart
2. Adjust input parameters as needed:
- Volume Period (2-5)
- ATR Period (default 14)
- ATR Multipliers for Stop Loss and Take Profit
- EMA Period (default 200)
3. Monitor for buy and sell signals
4. Use the provided stop-loss and take-profit levels for risk management
## Interpretation
- Buy signals suggest potential upward price movement
- Sell signals suggest potential downward price movement
- Always consider other factors and perform additional analysis before making trading decisions
## Limitations
- This indicator may generate false signals in choppy or ranging markets
- It's best used in conjunction with other technical analysis tools and fundamental analysis
- Past performance does not guarantee future results
Remember to thoroughly test this indicator on historical data and in various market conditions before using it in live trading.
---
# 改進的基於交易量的指標
## 概述
改進的基於成交量的指標是一種技術分析工具,旨在根據成交量模式、價格行為和趨勢方向識別潛在的交易機會。此指標將成交量分析與移動平均線和平均真實波動幅度 (ATR) 結合起來,以產生買入和賣出訊號。
## 關鍵部件
1. 成交量分析
- 追蹤 3 個週期的連續成交量方向(向上或向下)
- 計算與短期移動平均線相比的成交量比率
2. 趨勢方向
- 使用 200 週期指數移動平均線 (EMA) 來確定整體趨勢
3. 波動率測量
- 納入平均真實波動範圍 (ATR) 以進行停損和停盈計算
## 訊號生成
### 購買訊號標準
1. 連續三個週期的成交量上漲(收盤>開盤)
2.成交量比率>1.5(目前成交量較短期平均高50%)
3. 當前價格高於200 EMA
### 賣出訊號標準
1.連續三個週期的成交量下跌(收盤<開盤)
2.成交量比率>1.5(目前成交量較短期平均高50%)
3. 目前價格低於200 EMA
## 風險管理
此指標根據 ATR 計算停損和止盈水準:
- 停損:ATR * 1.5(預設)
- 止盈:ATR * 2.5(預設)
這些等級可透過輸入參數進行調整。
## 用法
1. 將指標加入您的圖表中
2. 根據需要調整輸入參數:
- 卷期 (2-5)
- ATR 週期(預設 14)
- 用於停損和止盈的 ATR 乘數
- EMA 週期(預設 200)
3. 監控買賣訊號
4. 使用提供的停損和停利水準進行風險管理
## 解釋
- 買進訊號表示價格可能上漲
- 賣出訊號表示價格可能下跌
- 在做出交易決策之前始終考慮其他因素並進行額外分析
## 限制
- 此指標可能會在波動或波動的市場中產生錯誤訊號
- 最好與其他技術分析工具和基本面分析結合使用
- 過去的表現並不能保證未來的結果
請記住,在實際交易中使用該指標之前,請根據歷史數據和各種市場條件徹底測試該指標。

Mark Minervini's Trend TemplateThe Mark Minervini Trend Template Indicator is a powerful tool designed to identify potential trends in the stock market.
Based on the renowned trading methodology developed by Mark Minervini, this indicator incorporates several key criteria to assist traders in making informed decisions.
The indicator checks the following criteria:
- Price above 50-day Moving Average (50MA):
The indicator confirms if the current price is trading above the 50-day moving average, indicating potential bullish momentum.
- Price above 150-day Moving Average (150MA):
The indicator verifies if the current price is above the 150-day moving average, suggesting a sustained upward trend.
Price above 200-day Moving Average (200MA): The indicator ensures that the current price remains higher than the 200-day moving average, indicating a strong bullish bias in the market.
- 50-day Moving Average (50MA) greater than 150-day Moving Average (150MA):
This criterion compares the 50-day moving average with the 150-day moving average and confirms if the shorter-term average is higher, signifying increasing short-term strength.
- 50-day Moving Average (50MA) greater than 200-day Moving Average (200MA):
This criterion compares the 50-day moving average with the 200-day moving average and validates if the shorter-term average is higher, indicating a potential bullish trend.
- 150-day Moving Average (150MA) greater than 200-day Moving Average (200MA):
This criterion compares the 150-day moving average with the 200-day moving average and confirms if the intermediate-term average is higher, suggesting a strengthening bullish trend.
- 200-day Moving Average (200MA) in Uptrend:
The indicator analyzes the slope of the 200-day moving average to determine if it is ascending, indicating a sustained bullish trend.
- Price within 25% of 52-week High:
The indicator assesses if the current price is trading within 25% of its 52-week high, potentially indicating a strong upward momentum and bullish sentiment.
- Price at least 25% above 52-week Low:
The indicator verifies if the current price is trading at least 25% above its 52-week low, suggesting resilience and potential bullish strength.
*Also, when you hover over the table cells, it shows the tooltip.
*By incorporating these criteria into your TradingView charts, the Mark Minervini Trend Template Indicator can help you identify potential bullish trends, enabling you to make more informed trading decisions.
*Please note that this indicator should be used to support your analysis and combined with additional technical and fundamental analysis for a comprehensive trading strategy.
***Disclaimer:
The Mark Minervini Trend Template is intended for informational and educational purposes only.
Trading involves risk, and you should consult with a financial advisor or conduct your research before engaging in any trading activities.
Add it to your favourites and start using it right away!

ATR PivotsThe "ATR Pivots" script is a technical analysis tool designed to help traders identify key levels of support and resistance on a chart. The indicator uses various metrics such as the Average True Range (ATR), Daily True Range ( DTR ), Daily True Range Percentage (DTR%), Average Daily Range (ADR), Previous Day High ( PDH ), and Previous Day Low ( PDL ) to provide a comprehensive picture of the volatility and movement of a security. The script also includes an EMA cloud and 200 EMA for trend identification and a 1-minute ATR scalping strategy for traders to make informed trading decisions.
ATR Detail:-
The ATR is a measure of the volatility of a security over a given period of time. It is calculated by taking the average of the true range (the difference between the high and low of a security) over a set number of periods. The user can input the number of periods (ATR length) to be used for the ATR calculation. The script also allows the user to choose whether to use the current close or not for the calculation. The script calculates various levels of support and resistance based on the relationship between the security's range ( high-low ) and the ATR. The levels are calculated by multiplying the ATR by different Fibonacci ratios (0.236, 0.382, 0.5, 0.618, 0.786, 1.000) and then adding or subtracting the result from the previous close. The script plots these levels on the chart, with the -100 level being the most significant level. The user also has an option to choose whether to plot all Fibonacci levels or not.
DTR and DTR% Detail:-
The Daily True Range Percentage (DTR%) is a metric that measures the daily volatility of a security as a percentage of its previous close. It is calculated by dividing the Daily True Range ( DTR ) by the previous close. DTR is the range between the current period's high and low and gives a measure of the volatility of the security on a daily basis. DTR% can be used as an indicator of the percentage of movement of the security on a daily basis. In this script, DTR% is used in combination with other metrics such as the Average True Range (ATR) and Fibonacci ratios to calculate key levels of support and resistance for the security. The idea behind using DTR% is that it can help traders to better understand the daily volatility of the security and make more informed trading decisions.
For example, if a security has a DTR% of 2%, it suggests that the security has a relatively low level of volatility and is less likely to experience significant price movements on a daily basis. On the other hand, if a security has a DTR% of 10%, it suggests that the security has a relatively high level of volatility and is more likely to experience significant price movements on a daily basis.
ADR:-
The script then calculates the ADR (Average Daily Range) which is the average of the daily range of the security, using the formula (Period High - Period Low) / ATR Length. This gives a measure of the average volatility of the security on a daily basis, which can be useful for determining potential levels of support and resistance .
PDH /PDL:-
The script also calculates PDH (Previous Day High) and PDL (Previous Day Low) which are the High and low of the previous day of the security. This gives a measure of the previous day's volatility and movement, which can be useful for determining potential levels of support and resistance .
EMA Cloud and 200 EMA Detail:-
The EMA cloud is a technical analysis tool that helps traders identify the trend of the market by comparing two different exponential moving averages (EMAs) of different lengths. The cloud is created by plotting the fast EMA and the slow EMA on the chart and filling the space between them. The user can input the length of the fast and slow EMA , and the script will calculate and plot these EMAs on the chart. The space between the two EMAs is then filled with a color that represents the trend, with green indicating a bullish trend and red indicating a bearish trend . Additionally, the script also plots a 200 EMA , which is a commonly used long-term trend indicator. When the fast EMA is above the slow EMA and the 200 EMA , it is considered a bullish signal, indicating an uptrend. When the fast EMA is below the slow EMA and the 200 EMA , it is considered a bearish signal, indicating a downtrend. The EMA cloud and 200 EMA can be used together to help traders identify the overall trend of the market and make more informed trading decisions.
1 Minute ATR Scalping Strategy:-
The script also includes a 1-minute ATR scalping strategy that can be used by traders looking for quick profits in the market. The strategy involves using the ATR levels calculated by the script as well as the EMA cloud and 200 EMA to identify potential buy and sell opportunities. For example, if the 1-minute ATR is above 11 in NIFTY and the EMA cloud is bullish , the strategy suggests buying the security. Similarly, if the 1-minute ATR is above 30 in BANKNIFTY and the EMA cloud is bullish , the strategy suggests buying the security.
Inside Candle:-
The Inside Candle is a price action pattern that occurs when the current candle's high and low are entirely within the range of the previous candle's high and low. This pattern indicates indecision or consolidation in the market and can be a potential sign of a trend reversal. When used in the 15-minute chart, traders can look for Inside Candle patterns that occur at key levels of support or resistance. If the Inside Candle pattern occurs at a key level and the price subsequently breaks out of the range of the Inside Candle, it can be a signal to enter a trade in the direction of the breakout. Traders can also use the Inside Candle pattern to trade in a tight range, or to reduce their exposure to a current trend.
Risk Management:-
As with any trading strategy, it is important to practice proper risk management when using the ATR Pivots script and the 1-minute ATR scalping strategy. This may include setting stop-loss orders, using appropriate position sizing, and diversifying your portfolio. It is also important to note that past performance is not indicative of future results and that the script and strategy provided are for educational purposes only.
In conclusion, the "ATR Pivots" script is a powerful tool that can help traders identify key levels of support and resistance , as well as trend direction. The additional metrics such as DTR , DTR%, ADR, PDH , and PDL provide a more comprehensive picture of the volatility and movement of the security, making it easier for traders to make better trading decisions. The inclusion of the EMA cloud and 200 EMA for trend identification, and the 1-minute ATR scalping strategy for quick profits can further enhance a trader's decision-making process. However, it is important to practice proper risk management and understand that past performance is not indicative of future results.
Special thanks to satymahajan for the idea of clubbing Average True Range with Fibonacci levels.

target_priceEnglish:
The current stock price is based on the total "diluted EPS" and PER for the past four quarters
It is an indicator that can be visually confirmed, where is the maximum, minimum, or average stock price?
- Calculate the "diluted EPS" at that time from the total "diluted EPS" for each of the past four quarters.
- Calculate daily PER from the closing price
Then, the maximum, minimum, and average PER for the past 200 days are calculated.
By multiplying this by "diluted EPS", the maximum, minimum, and average stock prices are shown.
White line : Stock price based on the maximum PER for the past 200 days
Red line : Stock price based on the minimum PER for the past 200 days
Yellow line: Stock price based on average PER for the past 200 days
* Note) If there is a minus in "EPS after dilution" every quarter, white and red may be reversed.
Japanese:
現在の株価が、
過去4回分の四半期ごと「希薄化後EPS」合計 と PERを元にした
最大、最小、平均の株価のどのあたりにあるかを
見た目で確認することができるインジケーターです
日ごとに、
・過去4回分の四半期ごと「希薄化後EPS」合計より、その時点での「希薄化後EPS」を算出
・終値より日ごとのPERを算出
し、過去200日の最大、最小、平均PERを算出しています。
これに「希薄化後EPS」を乗算することで、最大、最小、平均の株価を図示しました。
白線:過去200日の最大PERを元にした株価
赤線:過去200日の最小PERを元にした株価
黄線:過去200日の平均PERを元にした株価
※注)四半期ごと「希薄化後EPS」にマイナスがあると白赤が逆転することがあります。

Minervini VCP Pattern -Indian ContextThis script implements Mark Minervini's Trend Template and VCP (Volatility Contraction Pattern) pattern, specifically adapted for Indian stock markets (NSE). It helps identify stocks that are in strong uptrends and ready to break out.
Core Concepts Explained
1. What is the Minervini Trend Template?
Mark Minervini's method identifies stocks in Stage 2 uptrends - the sweet spot where institutional money is accumulating and stocks show the strongest momentum. Think of it as finding stocks that are "leaders" rather than "laggards."
2. What is VCP (Volatility Contraction Pattern)?
A VCP occurs when:
Stock price consolidates (moves sideways) after an uptrend
Price swings get tighter and tighter (like a coiled spring)
Volume dries up (fewer people trading)
Then it breaks out with force.
You can customize the strategy settings without editing code.
Key Settings:
Minimum Price (₹50): Filters out penny stocks that are too volatile
Min Distance from 52W Low (30%): Stock should be at least 30% above its yearly low
Max Distance from 52W High (25%): Stock should be within 25% of its yearly high (showing strength)
Moving Average Periods: 10, 50, 150, 200 days (industry standard)
Minimum Volume (100,000 shares): Ensures the stock is liquid enough to trade
Indian Market Adaptation: The default values (₹50 minimum, volume thresholds) are adjusted for NSE stocks, which behave differently than US markets.
The script pulls weekly chart data even when you're viewing daily charts.
Why it matters: Weekly trends are more reliable than daily noise. Professional traders use weekly charts to confirm the bigger picture.
What are Moving Averages (MAs)?
Simple averages of closing prices over X days
They smooth out price action to show trends
Think of them as the "average cost" of buyers over different time periods
The 4 Key MAs:
10 MA (Fast): Very short-term trend
50 MA: Short to medium-term trend
150 MA: Medium to long-term trend
200 MA: Long-term trend (the "grandfather" of all MAs)
Why Weekly MAs?
The script also calculates 10 and 50 MAs on weekly data for additional confirmation of the bigger trend.
The script Finds the highest and lowest prices over the past 52 weeks (1 year).
Why it matters:
Stocks near 52-week highs are showing strength (institutions buying)
Stocks far from 52-week lows have "room to run" upward
This is a psychological level that influences trader behaviour.
What is Volume here ?
The number of shares traded each day
High volume = many traders interested (conviction)
Low volume = lack of interest (weakness or consolidation)
Volume in VCP:
During consolidation (sideways movement), volume should dry up - this shows sellers are exhausted and buyers are holding. When volume spikes on a breakout, it confirms the move.
NSE Context: Indian stocks often have different volume patterns than US stocks, so the 50-day average is used as a baseline.
Relative Strength vs Nifty:
Example:
If your stock is up 20% and Nifty is up 10%, your stock has strong RS
If your stock is up 5% and Nifty is up 15%, your stock has weak RS (avoid it!)
Why it matters: The best performing stocks almost always have strong relative strength before major moves.
The 13 Minervini Conditions:-
Condition 1: Price > 50/150/200 MA
Meaning: Current price must be above ALL three major moving averages.
Why: This confirms the stock is in a clear uptrend. If price is below these MAs, the stock is weak or in a downtrend.
Condition 2: MA 50 > 150 > 200
Meaning: The moving averages themselves must be in proper order.
Analogy: Think of this like layers in a cake - short-term on top, long-term at bottom. If they're tangled, the trend is unclear.
Condition 3: 200 MA Rising (1 Month)
Meaning: The 200 MA today must be higher than it was 20 days ago.
Why: This confirms the long-term trend is UP, not flat or down. The means "20 bars ago."
Condition 4: 50 MA Rising
Meaning: The 50 MA today must be higher than 5 days ago.
Why: Confirms short-term momentum is accelerating upward.
Condition 5: Within 25% of 52-Week High
Meaning: Current price should be within 25% of its 1-year high.
Example:
52-week high = ₹1000
Current price must be above ₹750 (within 25%)
Why: Strong stocks stay near their highs. Weak stocks fall far from highs.
Condition 6: 30%+ Above 52-Week Low (OPTIONAL)
Meaning: Stock should be at least 30% above its yearly low.
Note: The script marks this as "SECONDARY - Optional" because the other conditions are more important. However, it's still a good confirmation.
Condition 7: Price > 10 MA
Meaning: Very short-term strength - price above the 10-day moving average.
Why: Ensures the stock hasn't just rolled over in the immediate term.
Condition 8: Price >= ₹50
Meaning: Filters out stocks below ₹50.
Why: In Indian markets, stocks below ₹50 tend to be penny stocks with poor liquidity and higher manipulation risk.
Condition 9: Weekly Uptrend
Meaning: On the weekly chart, price must be above both weekly MAs, and they must be properly aligned.
Why: Confirms the bigger picture trend, not just daily fluctuations.
Condition 10: 150 MA Rising
Meaning: The 150 MA is trending upward over the past 10 days.
Why: Another confirmation of medium-term trend health.
Condition 11: Sufficient Volume
Meaning: Average volume must exceed 100,000 shares (or your custom setting).
Why: Ensures you can actually buy/sell the stock without moving the price too much (liquidity).
Condition 12: RS vs Nifty Strong
Meaning: The stock's relative strength vs Nifty must be improving.
Why: You want stocks that are outperforming the market, not underperforming.
Condition 13: Nifty in Uptrend
Meaning: The Nifty 50 index itself must be above its 50 MA.
Why: "A rising tide lifts all boats." It's easier to make money in individual stocks when the overall market is bullish.
VCP Requirements:
Volatility Contracting: Price swings getting tighter (coiling spring)
Volume Drying Up: Fewer shares trading + trending lower
The Setup: When volatility contracts and volume dries up WHILE all 13 trend conditions are met, you have a VCP setup ready to explode.
What You See on Chart:
Colored Lines: 10 MA (green), 50 MA (blue), 150 MA (orange), 200 MA (red)
Blue Background: Trend template conditions met (watch zone)
Green Background: Full VCP setup detected (buy zone)
↟ Symbol Below Price: New VCP buy signal just triggered
Information Table:
What it does: Creates a checklist table on your chart showing the status of all conditions.
Table Structure:
Column 1: Condition name
Column 2: Status (✓ green = met, ✗ red = not met)
Final Row: Shows "BUY" (green) or "WAIT" (red) based on full VCP setup status.
Dos:
Example:
Account size: ₹5,00,000
Risk per trade: 1% = ₹5,000
Entry: ₹1000
Stop loss: ₹920 (8% below)
Distance to stop: ₹80
Shares to buy: ₹5,000 / ₹80 = 62 shares
Exit Strategy:
Sell 1/3 at +20% profit
Sell another 1/3 at +40% profit
Let the final 1/3 run with a trailing stop
Always exit if price closes below 10 MA on heavy volume
What This Script Does NOT Do:
Guarantee profits - No strategy works 100% of the time
Account for news events - Earnings, regulatory changes, etc.
Consider fundamentals - Company financials, debt, management quality
Adapt to market crashes - Works best in bull markets
Best Market Conditions:
✅ Nifty in uptrend (above 50 MA)
✅ Market breadth positive (more stocks advancing)
✅ Sector rotation happening
❌ Avoid in bear markets or high volatility periods
References:
Trade Like a Stock Market Wizard by Mark Minervini
Think & Trade Like a Champion by Mark Minervini
Chart attached: AU Small Finance Bank as on EoD dated 28/11/25
This script is a powerful tool for educational purpose only, remember: It's a tool, not a crystal ball. Use it to find high-probability setups, then apply proper risk management and patience. Good luck!

paigep.llc - SuperMASuperMA is a multi-layered moving-average and candle-coloring system that combines SMA, EMA, and optional HMA logic to help traders visualize trend shifts, pullbacks, and momentum changes in a clean, structured way.
The script includes multiple modules: trend-based moving averages, pullback signals, exit logic, and an optional HMA cross engine.
📌 Core Features
1. Full SMA + EMA Framework
The indicator plots multiple moving averages (8, 9, 13, 20, 50, 200) using both SMA and EMA calculations. Each line automatically colors bullish or bearish based on its relationship to the 200-period baseline.Users can toggle SMAs and EMAs independently for clearer chart control.
2. Main Trend Entry & Exit Logic (8×200 and 8×20)
Built-in crossover logic detects:
Main Entry: SMA 8 crossing above/below EMA 200
Main Exit: SMA 8 and SMA 20 cross (with an option to choose which SMA is treated as the “fast” leg)
A “first exit only” option allows the script to ignore additional exit signals until a new trend regime begins.
3. Pullback Module (20 SMA Interaction)
Pullback entries and exits occur when price crosses the 20 SMA during existing trend conditions.
This includes:
Pullback entries through the 20 SMA
Pullback exits back across the 20 SMA
Labels and candle colors are available for all pullback events.
4. Optional HMA Cross Module
A separate module allows traders to use two Hull Moving Averages (HMA) with customizable:
Lengths
Independent timeframes
Line colors
Cross-based entries and exits
This module has its own events, labels, and optional candle coloring.
5. Advanced Candle Coloring System
Candle coloring is layered in priority order, based on:
Main trend entries
Main exits
HMA entries
HMA exits
Pullback entries
Pullback exits
Trend-only candles (based on SMA 8 relative to EMA 200)
Users may also independently color wicks and borders.
6. Configurable Alerts (Fully Decoupled from Visuals)
Alerts are available for all major events, including:
Main Entries (8×200)
Main Exits (8×20)
Pullback Entries and Exits
HMA Entries and Exits
Bull or Bear Trend candles
Any colored candle event
Alerts can fire on bar close only or intrabar, depending on user preference.
📌 Use Cases
SuperMA helps traders visualize:
Trend direction using SMA/EMA structure
Momentum shifts through HMA crosses
Pullback zones around the 20 SMA
Early regime transitions based on the 8×200 relationship
Candle-level context through color-coded bars
The indicator works across all markets and timeframes.
⚠️ Note
This tool is for visual and analytical assistance only. It does not guarantee future performance and should be combined with additional analysis and risk management.

paigep.llc - SuperMA
SuperMA is a multi-layered moving-average and candle-coloring system that combines SMA, EMA, and optional HMA logic to help traders visualize trend shifts, pullbacks, and momentum changes in a clean, structured way.
The script includes multiple modules: trend-based moving averages, pullback signals, exit logic, and an optional HMA cross engine.
📌 Core Features
1. Full SMA + EMA Framework
The indicator plots multiple moving averages (8, 9, 13, 20, 50, 200) using both SMA and EMA calculations. Each line automatically colors bullish or bearish based on its relationship to the 200-period baseline. Users can toggle SMAs and EMAs independently for clearer chart control.
2. Main Trend Entry & Exit Logic (8×200 and 8×20)
Built-in crossover logic detects:
Main Entry: SMA 8 crossing above/below EMA 200
Main Exit: SMA 8 and SMA 20 cross (with an option to choose which SMA is treated as the “fast” leg)
A “first exit only” option allows the script to ignore additional exit signals until a new trend regime begins.
3. Pullback Module (20 SMA Interaction)
Pullback entries and exits occur when price crosses the 20 SMA during existing trend conditions.
This includes:
Pullback entries through the 20 SMA
Pullback exits back across the 20 SMA
Labels and candle colors are available for all pullback events.
4. Optional HMA Cross Module
A separate module allows traders to use two Hull Moving Averages (HMA) with customizable:
Lengths
Independent timeframes
Line colors
Cross-based entries and exits
This module has its own events, labels, and optional candle coloring.
5. Advanced Candle Coloring System
Candle coloring is layered in priority order, based on:
Main trend entries
Main exits
HMA entries
HMA exits
Pullback entries
Pullback exits
Trend-only candles (based on SMA 8 relative to EMA 200)
Users may also independently color wicks and borders.
6. Configurable Alerts (Fully Decoupled from Visuals)
Alerts are available for all major events, including:
Main Entries (8×200)
Main Exits (8×20)
Pullback Entries and Exits
HMA Entries and Exits
Bull or Bear Trend candles
Any colored candle event
Alerts can fire on bar close only or intrabar, depending on user preference.
Use Cases
SuperMA helps traders visualize:
Trend direction using SMA/EMA structure
Momentum shifts through HMA crosses
Pullback zones around the 20 SMA
Early regime transitions based on the 8×200 relationship
Candle-level context through color-coded bars
The indicator works across all markets and timeframes.
⚠️ Note
This tool is for visual and analytical assistance only. It does not guarantee future performance and should be combined with additional analysis and risk management.

Moving Averages DTMoving Averages Combo: SMA 30-50-100-200 + EMA 5-8-21 (Golden & Death Cross Ready)
This clean and lightweight indicator plots the most used simple and exponential moving averages in one single script — perfect for swing traders, position traders, and scalpers.
— Simple Moving Averages (Daily timeframe focus):
• SMA 30 (Red) — Early trend detection
• SMA 50 (Blue) — Classic medium-term trend
• SMA 100 (Green) — Institutional reference
• SMA 200 (Orange) — The legendary Golden/Death Cross line
— Fast Exponential Moving Averages (Perfect for pullbacks & entries):
• EMA 5 (Purple) — Ultra-fast reaction
• EMA 8 (Yellow) — Fibonacci-based favorite
• EMA 21 (Black) — 21-day cycle + Fibonacci
Why this combination works so well:
• EMA 8 + EMA 21 = Powerful short-term trend filter (used by thousands of crypto & forex traders)
• SMA 50/200 = Classic Golden & Death Cross signals
• SMA 30/100 = Extra confirmation layers used by banks and funds
Features:
✓ All MAs on a single indicator (no chart clutter)
✓ Clean colors with perfect contrast on light/dark themes
✓ Ready for alerts: set alert on EMA 8 crossing EMA 21 or SMA 50 crossing SMA 200
✓ Works on all markets & timeframes (stocks, forex, crypto, futures)
How to use:
• Bullish signal: Price above SMA 200 + EMA 8 > EMA 21 + SMA 50 > SMA 200
• Bearish signal: Price below SMA 200 + EMA 8 < EMA 21
• Pullback entries: Wait for price to touch EMA 21 in uptrend
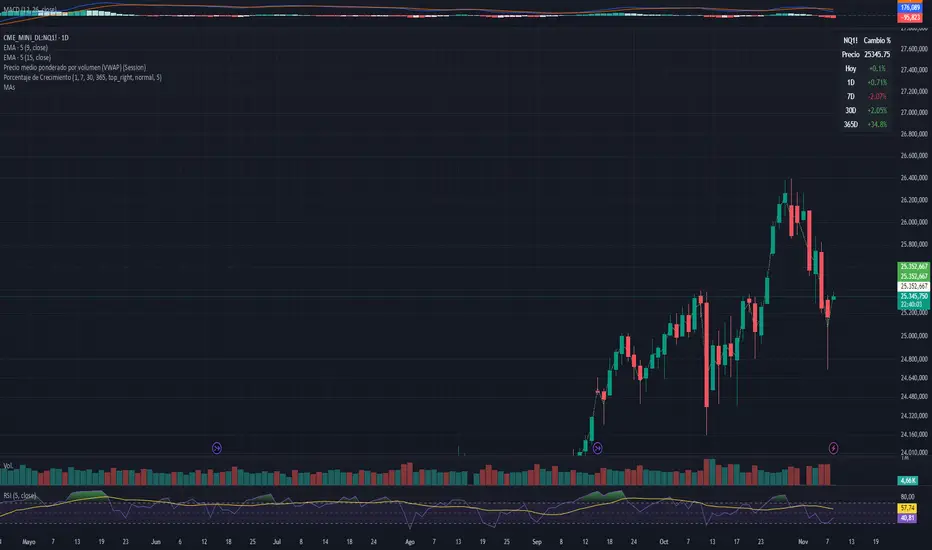
Fixed High Timeframe Moving AveragesFixed High Timeframe Moving Averages (W/D/4H)
Summary
This indicator plots essential, high-timeframe (HTF) Moving Averages onto your chart, **no matter which timeframe you are currently viewing**.
It is designed for traders who need multi-timeframe context at a glance. Stop switching charts to see where the 200-Week or 50-Day MA is—now you can see all critical HTF levels directly on your 5-minute (or any other) chart.
---
Who it’s for
Traders who rely on moving averages but like to work on lower chart timeframes while keeping higher timeframe context in sight. If you scalp on 1–15m yet want Weekly/Daily/4H MAs always visible, this is for you.
---
What it shows
Pinned (“fixed”) moving averages from higher timeframes—Weekly (20/100/200) , Daily (50/100/200/365) and 4H (200) —rendered on any chart timeframe. Your favorite HTF MAs stay on screen no matter what TF you’re currently analyzing.
---
Features
* **MA types:** SMA, EMA, VWMA, Hull.
* **Fully configurable:** toggle each line, set periods, colors, and thickness.
* **Two alert modes (see below):** intrabar vs confirmed HTF close.
* **Works on any symbol & chart TF** using `request.security` to fetch HTF data.
---
Alerts & Modes
This indicator solves the biggest problem with MTF alerts: false signals. You can choose one of two modes:
1. **Intrabar mode** — compares current chart price to the HTF MA. Triggers as soon as price crosses the HTF line; great for early signals but may update until the HTF bar closes.
2. **Confirmed mode** — checks HTF close vs HTF MA. Signals only on the higher-TF bar close; fewer false starts, no intrabar repainting on that TF.
Per-line *Cross Above / Cross Below* conditions are provided for all enabled MAs (e.g., “20W — Cross Above”, “365D — Cross Below”, etc.).
**How to use alerts:** add the script → “Create Alert” → pick any condition from the script’s list.
---
Why this helps
* Keeps Weekly/Daily structure visible while you execute on LTF.
* Classic anchors (e.g., 200D, 20W/100W/200W) are popular for trend bias, dynamic support/resistance, and pullback context.
* Lets you standardize MA references across all your lower-TF playbooks.
---
Notes on confirmation & repainting
* Intrabar signals can change until the higher-TF bar closes (that’s expected with multi-TF data).
* Confirmed mode waits for the HTF close—cleaner, but later. Choose what fits your workflow.
---
Quick setup
1. Pick `MA Type` (SMA/EMA/VWMA/Hull).
2. Enable the HTF lines you want (Weekly 20/100/200; Daily 50/100/200/365; 4H 200).
3. Choose `Alert Mode` (Intrabar vs Confirmed).
4. Style colors/widths to taste and set alerts on the lines you care about.
---
Good practice
* Combine HTF MAs with price action (swings, structure, liquidity grabs) rather than using them in isolation.
* Always validate signals in your execution TF and use a risk plan tailored to volatility.
* Protect your capital: position sizing, stops, and disciplined risk management matter more than any single line on the chart.
---
Disclaimer
For educational/informational purposes only; not financial advice. Trading involves risk—manage it responsibly.

Multi-Timeframe EMA (5 Configurable)Here's a comprehensive description you can use for your indicator:
Multi-Timeframe EMA Indicator (5 Configurable Slots)
Description
This indicator displays up to 5 Exponential Moving Averages (EMAs) from different timeframes simultaneously on a single chart. Perfect for multi-timeframe analysis, it allows traders to visualize key EMAs from intraday to higher timeframes without switching charts.
Key Features
5 Independent EMA Slots: Each slot can be configured with its own timeframe, EMA length, and color
Flexible Configuration: Mix any timeframes and EMA lengths (e.g., 1m EMA 50, 15m EMA 200, 4h EMA 100)
Smart Label Formatting: Automatically displays timeframes in readable format (minutes, hours, or days)
Optional Data Table: Toggle a compact table showing EMA values and price distance percentages
Individual Toggle Controls: Enable/disable each EMA independently without losing settings
Customizable Styling: Adjust colors and line width to match your chart theme
Default Configuration
EMA 1: 1-minute timeframe, EMA 200 (Red)
EMA 2: 5-minute timeframe, EMA 200 (Purple)
EMA 3: 15-minute timeframe, EMA 200 (Yellow)
EMA 4: 1-hour timeframe, EMA 200 (Blue)
EMA 5: 4-hour timeframe, EMA 200 (Orange)
How to Use
Add the indicator to any chart
Configure each EMA slot in the settings:
Timeframe: Choose from 1m, 5m, 15m, 1h, 4h, D, W, M, or custom
Length: Set the EMA period (default 200)
Color: Select a color for easy identification
Enable "Show Line Labels" to see EMA identifiers on the right side
Enable "Show Values Table" for a detailed view of current values and distances
Use Cases
Trend Analysis: Identify alignment across multiple timeframes
Support/Resistance: Use higher timeframe EMAs as dynamic S/R levels
Entry/Exit Timing: Enter on lower timeframe signals near higher timeframe EMAs
Multi-Timeframe Confirmation: Validate setups when price is above/below key EMAs
Scalping: Monitor 1m/5m EMAs while respecting 1h/4h trend direction
Tips
All EMAs update in real-time and move with the chart
Use contrasting colors for easier visual distinction
Disable unused slots to declutter your chart
The table shows percentage distance from current price to each EMA
Works on any symbol and any chart timeframe
