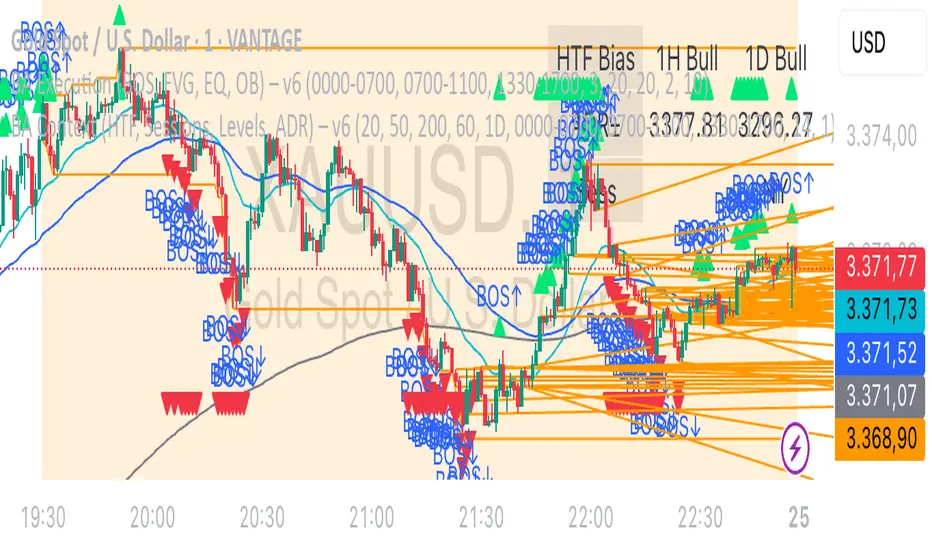
Alerts v6The strategy includes:
✅ EMA-based trend direction (fast vs slow)
✅ RSI filtering for overbought/oversold control
✅ ADX confirmation for strong trend validation
✅ Pullback & BOS detection for precision entries
✅ Per-bar change logic for adaptive entry timing
✅ Session/day gating to control trading hours
✅ JSON alert integration for AI trading bots or webhooks
This script is Pine Script v6 compatible and optimized for automated alert-based trading setups such as AI trading bots, webhook systems, and VPS-linked executions.
Recommended Timeframes: 5m, 15m, 30m
Markets: XAUUSD, FX pairs, indices, and metals
"BOS"に関するスクリプトを検索

Curved Radius Supertrend [BOSWaves]Curved Radius Supertrend — Adaptive Parabolic Trend Framework with Dynamic Acceleration Geometry
Overview
The Curved Radius Supertrend introduces an evolution of the classic Supertrend indicator - engineered with a dynamic curvature engine that replaces rigid ATR bands with parabolic, radius-based motion. Traditional Supertrend systems rely on static band displacement, reacting linearly to volatility and often lagging behind emerging price acceleration. The Curved Radius Supertend model redefines this by integrating controlled acceleration and curvature geometry, allowing the trend bands to adapt fluidly to both velocity and duration of price movement.
The result is a smoother, more organic trend flow that visually captures the momentum curve of price action - not just its direction. Instead of sharp pivots or whipsaws, traders experience a structurally curved trajectory that mirrors real market inertia. This makes it particularly effective for identifying sustained directional phases, detecting early trend rotations, and filtering out noise that plagues standard Supertrend methodologies.
Unlike conventional band-following systems, the Curved Radius framework is time-reactive and velocity-aware, providing a nuanced signal structure that blends geometric precision with volatility sensitivity.
Theoretical Foundation
The Curved Radius Supertrend draws from the intersection of mathematical curvature dynamics and adaptive volatility processing. Standard Supertrend algorithms extend from Average True Range (ATR) envelopes - a linear measure of volatility that moves proportionally with price deviation. However, markets do not expand or contract linearly. Trend velocity typically accelerates and decelerates in nonlinear arcs, forming natural parabolas across price phases.
By embedding a radius-based acceleration function, the indicator models this natural behavior. The core variable, radiusStrength, controls how aggressively curvature accelerates over time. Instead of simply following price distance, the band now evolves according to temporal acceleration - each bar contributes incremental velocity, bending the trend line into a radius-like curve.
This structural design allows the indicator to anticipate rather than just respond to price action, capturing momentum transitions as curved accelerations rather than binary flips. In practice, this eliminates the stutter effect typical of standard Supertrends and replaces it with fluid directional motion that better reflects actual trend geometry.
How It Works
The Curved Radius Supertrend is constructed through a multi-stage process designed to balance price responsiveness with geometric stability:
1. Baseline Supertrend Core
The framework begins with a standard ATR-derived upper and lower band calculation. These define the volatility envelope that constrains potential price zones. Directional bias is determined through crossover logic - prices above the lower band confirm an uptrend, while prices below the upper band confirm a downtrend.
2. Curvature Acceleration Engine
Once a trend direction is established, a curvature engine is activated. This system uses radiusStrength as a coefficient to simulate acceleration per bar, incrementally increasing velocity over time. The result is a parabolic displacement from the anchor price (the price level at trend change), creating a curved motion path that dynamically widens or tightens as the trend matures.
Mathematically, this acceleration behaves quadratically - each new bar compounds the previous velocity, forming an exponential rate of displacement that resembles curved inertia.
3. Adaptive Smoothing Layer
After the radius curve is applied, a smoothing stage (defined by the smoothness parameter) uses a simple moving average to regulate curve noise. This ensures visual coherence without sacrificing responsiveness, producing flowing arcs rather than jagged band steps.
4. Directional Visualization and Outer Envelope
Directional state (bullish or bearish) dictates both the color gradient and band displacement. An outer envelope is plotted one ATR beyond the curved band, creating a layered trend visualization that shows the extent of volatility expansion.
5. Signal Events and Alerts
Each directional transition triggers a 'BUY' or 'SELL' signal, clearly labeling phase shifts in market structure. Alerts are built in for automation and backtesting.
Interpretation
The Curved Radius Supertrend reframes how traders visualize and confirm trends. Instead of simply plotting a trailing stop, it maps the dynamic curvature of trend development.
Uptrend Phases : The band curves upward with increasing acceleration, reflecting the market’s growing directional velocity. As curvature steepens, conviction strengthens.
Downtrend Phases : The band bends downward in a mirrored acceleration pattern, indicating sustained bearish momentum.
Trend Change Points : When the direction flips and a new anchor point forms, the curve resets - providing a clean, early visual confirmation of structural reversal.
Smoothing and Radius Interplay : A lower radius strength produces a tighter, more reactive curve ideal for scalping or short timeframes. Higher values generate broad, sweeping arcs optimized for swing or positional analysis.
Visually, this curvature system translates market inertia into shape - revealing how trends bend, accelerate, and ultimately exhaust.
Strategy Integration
The Curved Radius Supertrend is versatile enough to integrate seamlessly into multiple trading frameworks:
Trend Following : Use BUY/SELL flips to identify emerging directional bias. Strong curvature continuation confirms sustained momentum.
Momentum Entry Filtering : Combine with oscillators or volume tools to filter entries only when the curve slope accelerates (high momentum conditions).
Pullback and Re-entry Timing : The smooth curvature of the radius band allows traders to identify shallow retracements without premature exits. The band acts as a dynamic, self-adjusting support/resistance arc.
Volatility Compression and Expansion : Flattening curvature indicates volatility compression - a potential pre-breakout zone. Rapid re-steepening signals expansion and directional conviction.
Stop Placement Framework : The curved band can serve as a volatility-adjusted trailing stop. Because the curve reflects acceleration, it adapts naturally to market rhythm - widening during momentum surges and tightening during stagnation.
Technical Implementation Details
Curved Radius Engine : Parabolic acceleration algorithm that applies quadratic velocity based on bar count and radiusStrength.
Anchor Logic : Resets curvature at each trend change, establishing a new reference base for directional acceleration.
Smoothing Layer : SMA-based curve smoothing for noise reduction.
Outer Envelope : ATR-derived band offset visualizing volatility extension.
Directional Coloring : Candle and band coloration tied to current trend state.
Signal Engine : Built-in BUY/SELL markers and alert conditions for automation or script integration.
Optimal Application Parameters
Timeframe Guidance :
1-5 min (Scalping) : 0.08–0.12 radius strength, minimal smoothing for rapid responsiveness.
15 min : 0.12–0.15 radius strength for intraday trends.
1H : 0.15–0.18 radius strength for structured short-term swing setups.
4H : 0.18–0.22 radius strength for macro-trend shaping.
Daily : 0.20–0.25 radius strength for broad directional curves.
Weekly : 0.25–0.30 radius strength for smooth macro-level cycles.
The suggested radius strength ranges provide general structural guidance. Optimal values may vary across assets and volatility regimes, and should be refined through empirical testing to account for instrument-specific behavior and prevailing market conditions.
Asset Guidance :
Cryptocurrency : Higher radius and multiplier values to stabilize high-volatility environments.
Forex : Midrange settings (0.12-0.18) for clean curvature transitions.
Equities : Balanced curvature for trending sectors or momentum rotation setups.
Indices/Futures : Moderate radius values (0.15-0.22) to capture cyclical macro swings.
Performance Characteristics
High Effectiveness :
Trending environments with directional expansion.
Markets exhibiting clean momentum arcs and low structural noise.
Reduced Effectiveness :
Range-bound or low-volatility conditions with repeated false flips.
Ultra-short-term timeframes (<1m) where curvature acceleration overshoots.
Integration Guidelines
Confluence Framework : Combine with structure tools (order blocks, BOS, liquidity zones) for entry validation.
Risk Management : Trail stops along the curved band rather than fixed points to align with adaptive market geometry.
Multi-Timeframe Confirmation : Use higher timeframe curvature as a trend filter and lower timeframe curvature for execution timing.
Curve Compression Awareness : Treat flattening arcs as potential exhaustion zones - ideal for scaling out or reducing exposure.
Disclaimer
The Curved Radius Supertrend is a geometric trend model designed for professional traders and analysts. It is not a predictive system or a guaranteed profit method. Its performance depends on correct parameter calibration and sound risk management. BOSWaves recommends using it as part of a comprehensive analytical framework, incorporating volume, liquidity, and structural context to validate directional signals.

ETH Smart Money Order Blocks Detector derek
This script helps identify potential Order Blocks (institutional price zones) on the chart based on Breaks of Structure (BOS).
It automatically highlights demand zones (green blocks) and supply zones (red blocks), making it easier to read institutional market flow.
Ideal for traders using Smart Money Concepts (SMC) or market structure analysis.
Compatible with any asset and timeframe.
🔹 Bullish OB = potential buy entry zone
🔹 Bearish OB = potential sell or resistance zone
Author: Derek 🧠💹

MTF Market Bias+ (Smart Multi-Timeframe Trend Dashboard)The MTF Market Bias+ indicator provides a clear, data-driven view of market direction across multiple timeframes — from scalper to swing trader level.
It automatically calculates the bullish / bearish / neutral bias for each selected timeframe using various configurable methods such as EMA slope, price vs EMA, or EMA50 vs EMA200.
This tool gives you an instant overview of market alignment and helps you identify when lower and higher timeframes are in sync — the most powerful condition for high-probability trades.
🔍 Core Features
✅ Multi-Timeframe Bias Dashboard: Visual table showing bullish/bearish sentiment across your chosen timeframes (from 3m to 1W).
⚙️ Customizable Methods: Choose between
EMA Slope (default) → detects trend direction by EMA momentum
Price vs EMA → shows short-term strength or weakness
EMA50 vs EMA200 → classic golden cross vs death cross structure
🎨 Configurable Colors, Size & Layout: Adjust background, text, and label sizes for any chart style.
📊 Summary Row: Displays the majority trend (bullish, bearish, or neutral) with real-time score.
🧩 Adaptive Background Mode (optional): Automatically colors your chart background according to overall bias.
💡 Method Info Panel: Clearly shows which method and parameters are active (e.g. “EMA Slope | EMA=50”).
📈 How to Use
Add the indicator to your chart.
Select the timeframes you want to monitor (e.g. 3m, 5m, 15m, 1h, 4h, D, W).
Watch for alignment between lower and higher timeframes:
When all turn green → strong bullish alignment → consider longs.
When all turn red → strong bearish alignment → consider shorts.
Mixed colors indicate consolidation or correction phases.
Combine it with your favorite Fair Value Gap, CHOCH/BOS, or Liquidity Sweep strategy to significantly improve trade timing and confidence.
🧩 Author’s Note
This indicator is designed for traders who want fast, visual confirmation of multi-timeframe structure without cluttering their charts.
It’s simple, lightweight, and highly adaptable — whether you’re scalping on 3-minute charts or swing trading daily candles.

Smart Money Concept v1Smart Money Concept Indicator – Visual Interpretation Guide
What Happens When Liquidity Lines Are Broken
🟩 Green Line Broken (Buy-Side Liquidity Pool Swept)
- Indicates price has dipped below a previous swing low where sell stops are likely placed.
- Market Makers may be triggering these stops to accumulate long positions.
- Often followed by a bullish reversal.
- Trader Actions:
• Look for a bullish candle close after the sweep.
• Confirm with nearby Bullish Order Block or Fair Value Gap.
• Consider entering a Buy trade (SLH entry).
- If price continues falling: Indicates trend continuation and invalidation of the buy-side liquidity zone.
🟥 Red Line Broken (Sell-Side Liquidity Pool Swept)
- Indicates price has moved above a previous swing high where buy stops are likely placed.
- Market Makers may be triggering these stops to accumulate short positions.
- Often followed by a bearish reversal.
- Trader Actions:
• Look for a bearish candle close after the sweep.
• Confirm with nearby Bearish Order Block or Fair Value Gap.
• Consider entering a Sell trade (SLH entry).
- If price continues rising: Indicates trend continuation and invalidation of the sell-side liquidity zone.
Chart-Based Interpretation of Green Line Breaks
In the provided DOGE/USD 15-minute chart image:
- Green lines represent buy-side liquidity zones.
- If these lines are broken:
• It may be a stop hunt before a bullish continuation.
• Or a false Break of Structure (BOS) leading to deeper retracement.
- Confirmation is needed from candle structure and nearby OB/FVG zones.
Is the Pink Zone a Valid Bullish Order Block?
To validate the pink zone as a Bullish OB:
- It should be formed by a strong down-close candle followed by a bullish move.
- Price should have rallied from this zone previously.
- If price is now retesting it and showing bullish reaction, it confirms validity.
- If formed during low volume or price never rallied from it, it may not be valid.
Smart Money Concept - Liquidity Line Breaks Explained
This document explains how traders should interpret the breaking of green (buy-side) and red (sell-side) liquidity lines when using the Smart Money Concept indicator. These lines represent key liquidity pools where stop orders are likely placed.
🟩 Green Line Broken (Buy-Side Liquidity Pool Swept)
When the green line is broken, it indicates:
• - Price has dipped below a previous swing low where sell stops were likely placed.
• - Market Makers have triggered those stops to accumulate long positions.
• - This is often followed by a bullish reversal.
Trader Actions:
• - Look for a bullish candle close after the sweep.
• - Confirm with a nearby Bullish Order Block or Fair Value Gap.
• - Consider entering a Buy trade (SLH entry).
🟥 Red Line Broken (Sell-Side Liquidity Pool Swept)
When the red line is broken, it indicates:
• - Price has moved above a previous swing high where buy stops were likely placed.
• - Market Makers have triggered those stops to accumulate short positions.
• - This is often followed by a bearish reversal.
Trader Actions:
• - Look for a bearish candle close after the sweep.
• - Confirm with a nearby Bearish Order Block or Fair Value Gap.
• - Consider entering a Sell trade (SLH entry).
📌 Additional Notes
• - If price continues beyond the liquidity line without reversal, it may indicate a trend continuation rather than a stop hunt.
• - Always confirm with Higher Time Frame bias, Institutional Order Flow, and price reaction at the zone.

Validated Order Blocks with Fib LevelsThis indicator automatically identifies and displays Smart Money Concepts (SMC) order blocks based on market structure breaks:
How it works:
Bearish Order Blocks (Red): Marks the last bullish candle before a swing high. The OB becomes valid when price breaks below the previous swing low, indicating institutional selling zones. Drawn from the candle's close (body top) to its low (bottom wick).
Bullish Order Blocks (Green): Marks the last bearish candle before a swing low. The OB becomes valid when price breaks above the previous swing high, indicating institutional buying zones. Drawn from the candle's high (top wick) to its close (body bottom).
Features:
Three Fibonacci retracement levels (50%, 75%, 100%) for each order block
Fib 100% faces downward on bearish OBs and upward on bullish OBs
Auto-validation: OBs are removed when price closes through them
Customizable: Adjustable swing detection, timeframe selection, and OB display limits
Optional Break of Structure (BOS) markers to show when OBs activate
Works on any timeframe with HTF analysis support
Perfect for identifying key institutional support/resistance zones and potential reversal areas.

Combined Cluster & Market StructureI barrowed code from the Mxwll Price Action Suite script as appreciated the structure in which the script defined structure, however I renamed variables and reduced the original script to define only the outer structure. I added volume and CVD clustering to define ranges and initiation market structures and add the ADX to assist with determining trend strength prior to labeling market structure breaks.
Combined Cluster & Market Structure indicator, a powerful and comprehensive tool for technical analysis. This script integrates two core concepts to provide a holistic view of market dynamics:
Z-Score Clustering & Volume Analysis: The indicator calculates Z-scores for both volume and Cumulative Volume Delta (CVD) to categorize market activity into six distinct clusters:
High-Conviction Bullish/Bearish: Signals of strong directional momentum based on high volume and corresponding CVD.
Effort vs. Result: High volume with moderate CVD, suggesting potential indecision or absorption.
Quiet Accumulation/Distribution: Low-volume periods with strong CVD, often preceding major moves.
Low Conviction/Noise: Represents periods of low market participation and weak signals.
These clusters are visually marked on the chart to provide real-time insight into market sentiment.
Market Structure Mapping: The indicator automatically detects and labels significant structural points to help you navigate price action. It identifies:
Higher Highs (HH) and Lower Lows (LL) to show the primary trend direction.
Breaks of Structure (BoS), indicating trend continuation.
Changes of Character (CHoCH), signaling a potential trend reversal.
Additionally, the script features consolidation box detection, which automatically highlights periods of low-conviction market activity, helping you avoid choppy, sideways markets. An integrated ADX filter ensures that structural breaks are only labeled during periods of strong trend strength, reducing false signals.
I want to thank Mxwll Capital for their contribution to the Combined Cluster & Market Structure indicator.

VWAP + Range Breakout (Pre-Signal for Manual Entry)WHAT IT DOES
This tool highlights potential breakout opportunities when price sweeps the previous day’s high or low and aligns with VWAP and short-term range levels. It provides both pre-signals (early warnings) and confirmed signals (breakout closed) so traders can prepare before momentum accelerates.
Works on all timeframes and across markets (indices, forex, crypto). Especially useful during active London and New York sessions.
---
KEY FEATURES
Daily sweep logic: previous day high/low as liquidity reference
VWAP with cumulative calculation
Adjustable range breakout levels
Optional SMA trend filter
Session filter (London / NY trading hours)
Pre-Signal markers (early alert before breakout)
Confirmed LONG/SHORT signals after breakout close
Alerts for Pre-Long, Pre-Short, and Confirmed entries
---
HOW TO USE
1. Wait for price to sweep the previous day high/low.
2. Look for alignment with VWAP and the defined range breakout levels.
3. Use trend/session filters for higher accuracy.
4. Combine with your own risk management rules.
---
SETTINGS TIPS
Adjust range lookback for different timeframes (shorter for fast intraday, longer for higher timeframes).
Enable/disable session filters depending on your market.
Use SMA trend filter to stay aligned with higher-timeframe bias.
---
WHO IT’S FOR
Scalpers, intraday, and swing traders who want early signals when liquidity is taken and price is preparing for a breakout.
---
NOTES
For educational purposes only. No financial advice.
This script is open-source; redistribution follows TradingView rules.

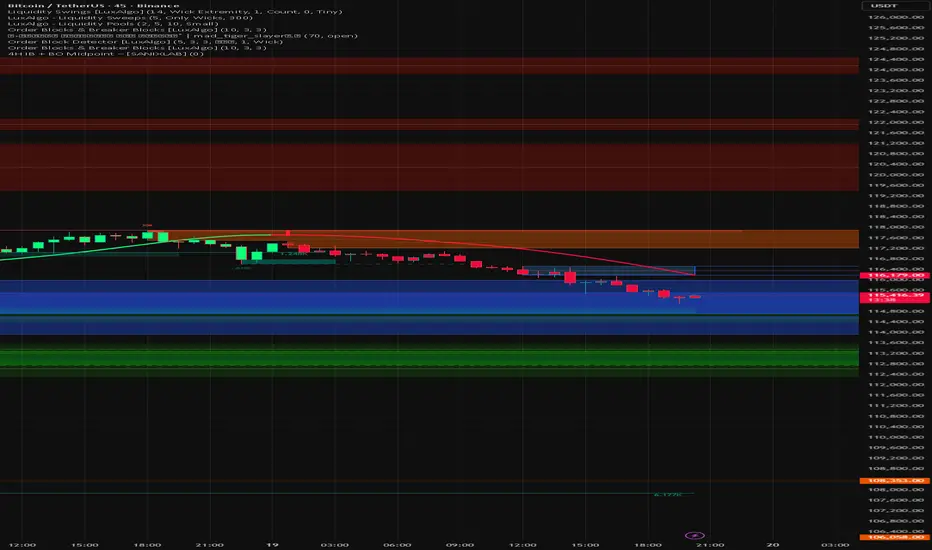
4H IB + BO Midpoint – [SANIXLAB]This indicator plots the Initial Balance (IB) high and low for each 4-hour period and automatically calculates potential breakout levels and midpoints.
At the start of every new 4-hour block the script:
Captures that block’s high and low (Initial Balance),
Draws horizontal lines at the IB high, low and midpoint,
Calculates breakout targets above and below the IB using (optional) extension factor,
Creates horizontal lines at those breakout levels and their midpoint,
Breakout areas extend as new bars arrive.
MR.L
Weis Wave Candle█Overview
The Weis Wave Candle indicator is a technical tool designed for the TradingView platform, enabling traders to analyze market dynamics by identifying price waves. The indicator relies solely on candlestick data, making it functional on markets where volume data is unavailable. It employs two trend detection methods, dynamic color gradients, trend change alerts, and clear visualization to assist in identifying trend strength and potential reversal points.
█Concept
The Weis Wave Candle indicator was developed to overcome limitations associated with the lack of volume data in certain markets, offering an alternative to traditional volume-based indicators like Weis Wave. Instead of volume, it measures candle size (body or body plus half the candle range) and accumulates it within a price wave. The indicator includes two trend calculation methods:
-LazyBear Style: Based on the popular Weis Wave adaptation by LazyBear, likely the most recognized version of this tool, it uses closing price comparisons and trend confirmation via trend functions. Results may differ from the original Weis Wave, as candle size does not always align with volume.
-Impulse Trend: A method that evaluates trend strength by summing price movements over a specified period, where each candle with a higher close than the previous adds +1, a lower close subtracts -1, and no change adds 0. The trend strength is determined by the sum: positive indicates an uptrend, negative a downtrend, and zero a continuation of the prior trend.
Results are visualized using dynamic color gradients, and alerts notify users of trend direction changes, facilitating quick decision-making.
█Why Use It?
-Volume-Free Operation: Ideal for markets without volume data.
-Flexibility: Two trend detection methods allow adaptation to various trading strategies.
-Dynamic Visualization: Color gradients and semi-transparent backgrounds simplify quick interpretation of trend strength.
-Alerts: Notifications for trend changes (from uptrend to downtrend and vice versa) support active trading.
-Customization: Options to adjust colors, analysis periods, and candle shadow inclusion.
█How It Works?
-Candle Size Calculation: Depending on the setting, candle size includes only the body (difference between close and open) or the body plus half the candle range (calculated as 0.5 * (high - low)) (setting Include candle shadows).
-Trend Detection:
LazyBear Style: Compares closing prices of adjacent candles to determine direction (uptrend, downtrend, or neutral) and confirms the trend using ta.rising or ta.falling functions over the specified period.
Impulse Trend: Sums price movements over the analysis period (+1 for a candle with a higher close than the previous, -1 for a lower close, 0 for no change). A positive sum indicates an uptrend, a negative sum a downtrend, and zero a continuation of the prior trend.
-Wave Accumulation: Candle sizes are accumulated within a single wave until the trend changes.
-Normalization and Gradients: Wave values are normalized to a 0-100 scale solely for color gradient purposes, enabling dynamic color changes from base to intense, reflecting wave strength relative to historical values. The height of columns (representing waves) is not normalized and corresponds to the accumulated candle size.
-Alerts: The indicator generates notifications when the wave direction changes (from uptrend to downtrend or vice versa), enabling quick responses to trend shifts.
-Visualization: Upward and downward waves are plotted as columns with dynamic colors, and the chart background changes color for better visibility.
█Settings and Customization
-Trend Detection Method: Choose between LazyBear Style (default) and Impulse Trend.
-Trend Analysis Period: Number of candles for trend analysis (default: 4).
-Include Candle Shadows: Determines whether to include half the candle range (high - low) in addition to the body (default: enabled).
-Lookback Period for Dynamic Thresholds: Number of candles to calculate the maximum and minimum wave values for color gradient normalization (default: 70).
-Gradient Minimum/Maximum Value: Threshold values defining the normalization range for color gradients (default: 0/100). A lower minimum value reduces the threshold for lighter colors, while a higher maximum value increases the threshold for more intense colors.
-Wave Colors: Options to select base and intense colors for upward and downward waves.
-Alerts: Enable alerts in TradingView settings (Upward Trend Change and Downward Trend Change) for trend change notifications.
█Usage Examples
-Trend Analysis: Upward waves (green columns) indicate buying pressure, while downward waves (red columns) indicate selling pressure. The more intense the color, the stronger the wave relative to historical values.
-Comparing Timeframes: Analyze trends across multiple timeframes (e.g., 1H, 4H, 1D) for broader context. For example, enter a position on the 4H timeframe after confirming trend alignment on 1H, 4H, and 1D, along with validation from a key level, such as a Fibonacci level or a Break of Structure (BOS).
-Using Alerts: Configure alerts in TradingView to receive notifications of trend changes, useful for active trading.
█Notes for Users
-Experiment with the Trend Analysis Period and Include Candle Shadows settings to tailor the indicator to your market and timeframe.
-Combine the indicator with other tools, such as support/resistance levels or RSI, to enhance signal accuracy.
-The Impulse Trend method may be more sensitive to short-term price changes, while LazyBear Style performs better in clear trends. Results from LazyBear Style may differ from the original Weis Wave, as candle size does not always align with volume.

Bias + VWAP Pullback — v4 (PA + BOS/CHOCH)Simple idea: I identify the trend (bias) from the larger timeframe, and only trade pullbacks to the VWAP/EMA during liquidity (London/New York). When the trend is clear, gold moves strongly, and its pullbacks to the balance lines provide clear opportunities.
Timeframe and Sessions (Cairo Time)
Analysis: H1 to determine the trend.
Implementation: 5m (or 1m if professional).
Trading window:
London Opening: 10:00–12:30
New York Opening: 16:30–19:00
(avoid the rest of the day unless there is exceptional traffic).
Direction determination (BIAS)
On H1:
If the price is above the 200 EMA and the daily VWAP is bullish and the price is above it → uptrend (long-only).
If the price is below the 200 EMA and the daily VWAP is bearish and the price is below it → bearish trend (short-only).
Determine your levels: yesterday's high/low (PDH/PDL) + approximate Asia range (03:00–09:30).
Entry Rules (Setup A: Trend Continuation)
Asia range breakout towards Bias during liquidity window.
Wait for a withdrawal to:
Daily VWAP, or
EMA50 on 5m frame (best if both cross).
Confirmation: Confirmation low/high on 5m (HL buy/LH sell) + clear impulse candle (Body is greater than average of last 10 candles).
Entry:
Buy: When the price returns above VWAP/EMA50 with a confirmation candle close.
Sell: The exact opposite.
Stop Loss (SL): Below/above the last confirmation low/high or ATR(14, 5m) x 1.5 (largest).
Objectives:
TP1 = 1R (Close 50% and move the rest Break-even).
TP2 = 2.5R to 3R or at an important HTF level (PDH/PDL/Bid/Demand Zone).
Entry Rules (Setup B: Reversion to VWAP – “Mean Reversion”)
Use with extreme caution, once daily maximum:
Price deviation from VWAP by more than ~1.5 x ATR(14, 5m) with rejection candles appearing near PDH/PDL.
Reverse entry towards the return of VWAP.
SL small behind rejection top/bottom.
Main target: VWAP. (Don't get greedy — this scenario is for extended periods only.)
News Filtering and Risk Management
Avoid trading 15–30 minutes before/after strong US news (CPI, NFP, FOMC).
Maximum daily loss: 1.5–2% of account balance.
Risk per trade: 0.25–0.5% (if you are learning) or 0.5–1% (if you are experienced).
Do not exceed two consecutive losing trades per day.
Don't chase the market after the opportunity has passed — wait for the next pullback.
Smart Deal Management
After TP1: Move stop to entry point + trail the rest with EMA20 on 5m or ATR Trailing = ATR(14)×1.0.
If the price touches a strong daily level (PDH/PDL) and fails to break, consider taking additional profit.
If VWAP starts to flatten and breaks against the trend on H1, stop trading for the day.
Quick Checklist (Before Entry)
H1 trend is clear and consistent with 200EMA + VWAP.
Penetrating the Asia range towards Bias.
Clean pull to VWAP/EMA50 on 5m.
Confirmation candle and real push.
SL is logical (behind swing/ATR×1.5) and R :R ≥ 1:2.
No red news coming soon.
Example of "ready-made" settings
EMA: 20, 50, 200 on 5m, 200 only on H1.
VWAP: Daily (reset daily).
ATR: 14 on 5m.
Levels: PDH/PDL + Asia Band (03:00–09:30 Cairo).
Gold Notes
Gold is fast and sharp at the open; don't get in early — wait for the draw.
Fakeouts are common before news: it is best to call with the trend after the price returns above/below VWAP.
Don't expect 80% consistent wins every day — the advantage comes from discipline, filtering out bad days, and only withdrawing when you're on the right track.
تعتبر شركة الماسة الألمانية أحد المؤسسات العاملة بالمملكة العربية السعودية ولها تاريخ طويل من الخدمات الكثيرة والمتنوعة التى مازالت تقدمها للكثير من العملاء داخل جميع مدن وأحياء المملكة حيث نقدم أفضل ما لدينا من خلال مجموعة الشركات التالية والتي من خلالها ستتلقي كل ما تحتاج إلية في كل المجال المختلفة فنحن نعمل منذ عام 2015 ولنا سابقات اعمال فى مختلف المجالات الحيوية التى نخدم من خلالها عملائنا ونوفر لهم أرخص الأسعار وبأعلى جودة من الممكن توفرها فى المجالات التالية :-
خدمات تنظيف المنازل والفلل والشقق
خدمات عزل الخزانات تنظيف غسيل صيانة اصلاح
خدمات جلي البلاط والرخام والسيراميك
خدمات نقل العفش عمالة فلبينية مدربة
خدمات مكافحة الحشرات بجدة
كل هذة الخدمات وأكثر نوفرها لكل المتعاقدين بأفضل الطرق مع توفير خطط وبرامج متنوعة لأتمام العمل المسنود إلينا بأفضل وأحدث الطرق الحديثة والعصرية سواء فى شركات النظافة بجدة ومكة المكرمة أو شركات نقل العفش بجدة عمالة فلبينية وباقى الخدمات مثل جلي وتلميع الرخام بمكة وجدة ولا ننسي شركة مكافحة حشرات بجدة التى ساعدت آلاف المواطنين على تنظيف منازلهم من الحشرات بأفضل مبيدات حشرية.

LP Sweep / Reclaim & Breakout Grading: Long-onlySignals
1) LP Sweep & Reclaim (mean-reversion entry)
Compute LP bounds from prior-bar window extremes:
lpLL_prev = lowest low of the last N bars (offset 1).
lpHH_prev = highest high of the last N bars (offset 1).
Sweep long trigger: current low dips below lpLL_prev and closes back above it.
Real-time quality grading (A/B/C) for sweep:
Trend filter & slope via EMA(88).
BOS bonus: close > last confirmed swing high.
Body size vs ATR, location above a long EMA, headroom to swing high (penalty if too close), and multi-sweep count bonus.
Sum → score → grade A/B/C; A or B required for sweep entry.
2) Trend Breakout (momentum entry)
Core trigger: close > previous Donchian high (length boLen) + ATR buffer.
Optional filter: close must be above the default EMA.
Breakout grading (A/B/C) in real time combining:
Trend up (price > EMA and EMA rising),
Body/ATR, Gap above breakout level (in ATR),
Volume vs MA,
Upper-wick penalty,
Position-in-Score: headroom to last swing high (penalty if too near) + EMA slope bonus.
Sum → score → A or B required if grading enabled.

SMC Pro (Wellington) v1.4.2This SMC indicator combines BOS/CHoCH, OBs, FVGs, liquidity, and Premium/Discount with confirmation on the 1H (EMA200).
Entries only appear when 3+ confluences align, filtering noise and delivering clear signals.
✅ Ready-to-use alerts (LONG, SHORT, or unified)
✅ Real-time HUD
✅ Strategy tailored for XAUUSD

STOCK SCHOOL | FVGThe Stock School FVG Indicator is designed to help traders identify and trade Fair Value Gaps (FVGs) and Inverse FVGs (IFVGs) with precision.
Built for both intraday and swing traders, this tool highlights high-probability trading zones where institutions leave imbalances in the market.
✨ Key Features:
Auto-detects FVGs & IFVGs in real-time
Works on all timeframes and instruments (Nifty, BankNifty, Stocks, Forex, Crypto)
Non-repainting logic for reliable signals
Clean and easy-to-use interface with Stock School styling
Perfect for Smart Money Concept (SMC) traders
🚀 With this indicator, you can:
Spot institutional footprints quickly
Combine with BOS, CHoCH, Order Blocks for high accuracy
Trade liquidity sweeps + FVG collisions with confidence
💡 Disclaimer:
This indicator is for educational purposes only. Trading involves risk. Always use proper risk management.

B A N K $ - Breaks & SweepsThis indicator automatically maps on Breaks of Structure & Liquidity Sweeps. It works by calculating pivot points based on how many candles are above/below either side of a pivot.
The user can manually set how many candles need to be above/below either side of a pivot if they would prefer to change it.
The indicator will dynamically adjust the lines as the user changes timeframe to allow for seamless analysis.
Features
Break of Structure lines
Liquidity Sweep lines
Dealing Range - this allows the user to visualise the current dealing range
Explanation
A sweep is determined by whether a candle closes through a pivot point with a body closure or not. If the candle wicks this level but fails to close through it, the line will turn red to indicate a liquidity sweep.
If the following 3 candles go on to close through the break line, this will then update it from a red sweep line to the normal break line again. (sometimes the initial candle that touches a level will not close through it but price will continue to break that level in the next few candles).

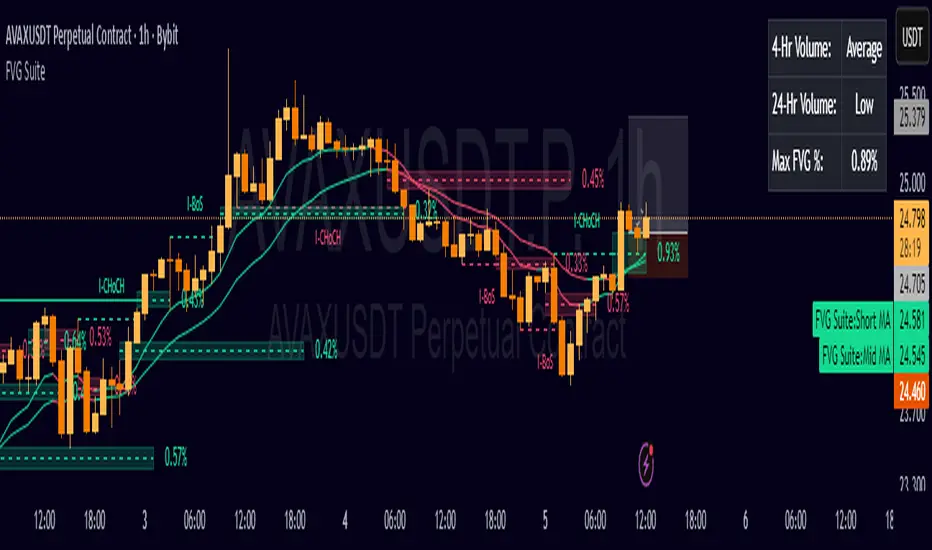
FVG SuiteSupercharge your charts with FVG Suite! Detect Smart Money structures, Fair Value Gaps, and key Multi-Timeframe levels—all in one powerful indicator. Perfect for both intraday and swing traders.
⚡ Highlights:
📈 Smart Money Structure: BoS & CHoCH signals with customizable colors and sensitivity.
💎 Fair Value Gaps: Bullish & Bearish FVGs with filters, max extension, and automatic cleanup.
🕒 Multi-Timeframe Levels: Daily, Weekly, and Monthly Highs & Lows with solid/dashed/dotted lines.
📊 Volume Activity: Real-time 4H & 24H volume analysis in a neat table.
🎨 Fully Customizable: Colors, transparency, and labels for a clean, easy-to-read chart.
Make smarter trade decisions with clear market structure insights and gap detection! 🚀
Third Eye ORB Pro (0915-0930 IST, no-plot)Third Eye ORB Pro (Opening Range Breakout + Range Mode)
This indicator is designed specifically for Indian stocks and indices (NIFTY, BANKNIFTY, FINNIFTY, MIDCAP, etc.) to track the Opening Range (09:15–09:30 IST) and generate actionable intraday trade signals. It combines two key modes — Range Mode (mean reversion inside the opening range) and Breakout Mode (momentum trading beyond the range).
1. Opening Range Framework (09:15–09:30 IST)
The indicator automatically plots the Opening Range High (ORH) and Opening Range Low (ORL) after the first 15 minutes of market open.
The area between ORH and ORL acts as the intraday battlefield where most price action occurs (historically ~70–80% of the day is spent inside this zone).
A shaded box and horizontal lines mark this range, serving as a visual reference for support and resistance throughout the day.
2. Range Mode (Mean Reversion Inside OR)
When price trades inside the Opening Range, the indicator looks for edge rejections to capture range-bound trades.
Range BUY (RB): Triggered near ORL when a bullish rejection candle forms (strong body + long lower wick).
Range SELL (RS): Triggered near ORH when a bearish rejection candle forms (strong body + long upper wick).
Optional filters (toggleable in settings):
RSI Filter: Only allow range buys if RSI is oversold (≤45) and range sells if RSI is overbought (≥55).
VWAP Filter: Only allow range trades if price is not too far from VWAP (distance ≤ X% of OR size).
Labels show suggested Stop Loss (just outside the OR band) and Target (midline/VWAP).
Cooldown logic prevents consecutive whipsaw signals.
3. Breakout Mode (Directional Moves Beyond OR)
When price closes strongly outside the ORH/ORL with momentum, the indicator confirms a breakout/breakdown trade.
Buffers are applied to avoid false breakouts:
ATR Buffer: Price must extend at least ATR × multiplier beyond the range edge.
% Buffer: Price must extend at least a percentage of OR size (default 10%).
Confirmation Filters:
Candle must have a strong body (≥60% of total bar range).
Optional “two closes” rule: price must close outside the range for 2 consecutive candles.
BUY BO: Trigger when price closes above ORH + buffer with momentum.
SELL BD: Trigger when price closes below ORL – buffer with momentum.
Labels and alerts are plotted for quick action.
4. Practical Usage
Works best on 5-minute charts for intraday trading.
Designed to help traders capture both:
Range-bound moves during the day (mean reversion plays).
Strong directional breakouts when institutions push price beyond the opening range.
Particularly effective on expiry days, trending sessions, and major news days when breakouts are more likely.
On sideways days, Range Mode provides reliable scalp opportunities at the OR edges.
5. Features
Auto-plots Opening Range High, Low, Midline.
Box + line visuals (no repainting).
Buy/Sell labels for both Range Mode and Breakout Mode.
Customizable buffers (ATR, % of range) to suit volatility.
Alerts for all signals (breakouts and range plays).
Built with risk management in mind (suggested SL and TP shown on chart).

Vietnamese: Swing Low Detection with SMA Bands & BackgroundThis script detects **swing lows** using a dynamic SMA-based logic and visually highlights them on the chart.
Features
Customizable Moving Averages: Supports multiple MA types (SMA, EMA, WMA, RMA, HMA, DEMA, TEMA, VWMA).
Swing Low Visualization: Identifies swing lows when price closes below the SMA of lows and exits once price trades above the SMA of highs.
Smart Rectangles: Marks detected swing lows with labeled boxes for clear visual reference.
Background Highlights**: Dynamically shades the chart background when price breaks below recent swing lows, helping traders spot potential breakdown zones.
Configurable Parameters: Period length, rectangle length, and MA source can all be tuned.
Use Cases
Spot breakdown/bearish continuation signals when price closes under recent lows.
Combine with higher timeframe trend analysis for confluence.
Notes
* This tool is designed for **visual analysis** and is not a standalone buy/sell signal.
* Works best when combined with broader trend analysis, support/resistance levels, and volume.

Essa - Market Structure Crystal Ball SystemEssa - Market Structure Crystal Ball V2.0
Ever wished you had a glimpse into the market's next move? Stop guessing and start anticipating with the Market Structure Crystal Ball!
This isn't just another indicator that tells you what has happened. This is a comprehensive analysis tool that learns from historical price action to forecast the most probable future structure. It combines advanced pattern recognition with essential trading concepts to give you a unique analytical edge.
Key Features
The Predictive Engine (The Crystal Ball)
This is the core of the indicator. It doesn't just identify market structure; it predicts it.
Know the Odds: Get a real-time probability score (%) for the next structural point: Higher High (HH), Higher Low (HL), Lower Low (LL), or Lower High (LH).
Advanced Analysis: The engine considers the pattern sequence, the speed (velocity) of the move, and its size to find the most accurate historical matches.
Dynamic Learning: The indicator constantly updates its analysis as new price data comes in.
The All-in-One Dashboard
Your command center for at-a-glance information. No need to clutter your screen!
Market Phase: Instantly know if the market is in a "🚀 Strong Uptrend," "📉 Steady Downtrend," or "↔️ Consolidation."
Live Probabilities: See the updated forecasts for HH, HL, LL, and LH in a clean, easy-to-read format.
Confidence Level: The dashboard tells you how confident the algorithm is in its current prediction (Low, Medium, or High).
🎯 Dynamic Prediction Zones
Turn probabilities into actionable price areas.
Visual Targets: Based on the highest probability outcome, the indicator draws a target zone on your chart where the next structure point is likely to form.
Context-Aware: These zones are calculated using recent volatility and average swing sizes, making them adaptive to the current market conditions.
🔍 Fair Value Gap (FVG) Detector
Automatically identify and track key price imbalances.
Price Magnets: FVGs are automatically detected and drawn, acting as potential targets for price.
Smart Tracking: The indicator tracks the status of each FVG (Fresh, Partially Filled, or Filled) and uses this data to refine its predictions.
🌍 Trading Session Analysis
Never lose track of key session levels again.
Visualize Sessions: See the Asia, London, and New York sessions highlighted with colored backgrounds.
Key Levels: Automatically plots the high and low of each session, which are often critical support and resistance levels.
Breakout Alerts: Get notified when price breaks a session high or low.
📈 Multi-Timeframe (MTF) Context
Understand the bigger picture by integrating higher timeframe analysis directly onto your chart.
BOS & MSS: Automatically identifies Breaks of Structure (trend continuation) and Market Structure Shifts (potential reversals) from up to two higher timeframes.
Trade with the Trend: Align your intraday trades with the dominant trend for higher probability setups.
⚙️ How It Works in Simple Terms
1️⃣ It Learns: The indicator first identifies all the past swing points (HH, HL, LL, LH) and analyzes their characteristics (speed, size, etc.).
2️⃣ It Finds a Match: It looks at the most recent price action and searches through hundreds of historical bars to find moments that were almost identical.
3️⃣ It Analyzes the Outcome: It checks what happened next in those similar historical scenarios.
4️⃣ It Predicts: Based on that historical data, it calculates the probability of each potential outcome and presents it to you.
🚀 How to Use This Indicator in Your Trading
Confirmation Tool: Use a high probability score (e.g., >60% for a HH) to confirm your own bullish analysis before entering a trade.
Finding High-Probability Zones: Use the Prediction Zones as potential areas to take profit, or as reversal zones to watch for entries in the opposite direction.
Gauging Market Sentiment: Check the "Market Phase" on the dashboard. Avoid forcing trades when the indicator shows "😴 Low Volatility."
Confluence is Key: This indicator is incredibly powerful when combined with your existing strategy. Use it alongside supply/demand zones, moving averages, or RSI for ultimate confirmation.
We hope this tool gives you a powerful new perspective on the market. Dive into the settings to customize it to your liking!
If you find this indicator helpful, please give it a Boost 👍 and leave a comment with your feedback below! Happy trading!
Disclaimer: All predictions are probabilistic and based on historical data. Past performance is not indicative of future results. Always use proper risk management.

ICT Structure Levels (ST/IT/LT) - v7 (by Jonas E)ICT Structure Levels (ST/IT/LT) – Neighbor-Wick Pivots
This indicator is designed for traders following ICT-style market structure analysis. It identifies Short-Term (ST), Intermediary (IT), and Long-Term (LT) swing highs and lows, but with a stricter filter that reduces false signals.
Unlike standard pivot indicators, this script requires not only that a bar makes a structural high/low, but also that the neighboring bars’ extremes are formed by wicks rather than flat-bodied candles. This wick condition helps confirm that the level is a true liquidity sweep and not just random price action.
How it works (conceptual):
Detects pivots based on user-defined left/right bars.
Validates that extremes on both sides of the pivot are wick-driven (high > body for highs, low < body for lows).
Marks valid STH/STL, ITH/ITL, and LTH/LTL directly on the chart with optional price labels.
Uses ATR offset for better label readability.
Alerts can be enabled to notify when a new structural level is confirmed.
How to use it:
Map market structure across multiple layers (ST/IT/LT).
Identify true liquidity grabs and avoid false highs/lows.
Integrate with Break of Structure (BOS) and Change of Character (CHoCH) strategies.
Combine with other ICT concepts (Order Blocks, Fair Value Gaps, Liquidity Pools).
What makes it unique:
Most pivot indicators mark every high/low indiscriminately. This script filters pivots using wick validation, which significantly reduces noise and focuses only on the levels most relevant to liquidity-based trading strategies.

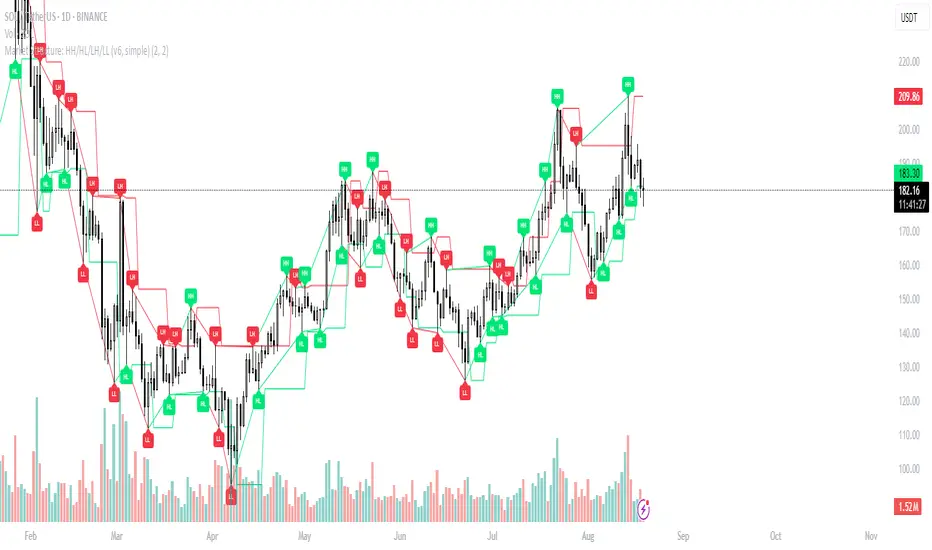
Market Structure: HH/HL/LH/LL (v6, simple)What it does
Labels swing High/Low and classifies structure as HH / HL / LH / LL after confirmation.
Uses confirmed fractals (pivothigh/pivotlow) → no repaint after confirmation (there is a right-bar confirmation delay).
Optional swing connectors (lines), optional plain H/L when structure label is not applicable.
Plots last confirmed High/Low levels as reference.
Alerts when a new HH/HL/LH/LL is formed.
How it works
Swings are detected with ta.pivothigh() / ta.pivotlow() using user-defined left and right.
A pivot is confirmed only after right bars on the right—this is the only delay. Once confirmed, the label does not repaint.
Inputs
Left bars & Right bars – fractal sensitivity.
Connect swings with lines – draw lines between consecutive swings.
Show bullish (HH/HL) / Show bearish (LH/LL) – filter what to display.
Show plain H/L – draw H/L when classification is not HH/HL/LH/LL yet.
Recommended settings
1H–4H: left=2, right=2 (responsive).
1D+: left=3, right=3 (cleaner swing map).
Alerts provided
HH formed – new Higher High confirmed.
HL formed – new Higher Low confirmed.
LH formed – new Lower High confirmed.
LL formed – new Lower Low confirmed.
Use them to automate structure tracking or feed your strategy rules.
Tips
Trend up: a sequence of HH + HL; Trend down: LH + LL.
Combine with VWAP/EMA, liquidity zones, or volume/CVD to avoid chasing late signals.
The script is intentionally simple and lightweight; BOS/CHoCH can be added in a future update.
Limitations / Notes
Because the tool relies on confirmed pivots, signals are delayed by right bars.
This is not financial advice and not a buy/sell system on its own.
Changelog
v1.0 – Initial public release (Pine v6). Structure labels, swing connectors, last levels, and alert set.
Keywords
market structure, hh hl lh ll, swing, fractal, pivothigh, pivotlow, trend, structure labels, price action
MACROFLOW 200 — Bias & Triggersstephtradez model
MACROFLOW 200 — at a glance (the elevator pitch)
Trade direction = Macro Bias + 1H 200 EMA filter + DXY confirm.
Locations = 1H supply/demand zones.
Triggers (15m): (T1) Retest rejection, (T2) Liquidity sweep + BOS/CHOCH, (T3) Momentum break + shallow pullback.
Stops: structure‑based beyond zone with ATR buffer.
Targets: 2R base, scale at 1.5R, trail to next HTF zone.
Sessions: 7–10 pm ET and 9:30–10:30 am ET.
Risk: tight, prop‑friendly max 1% per session
