"Candlestick"に関するスクリプトを検索

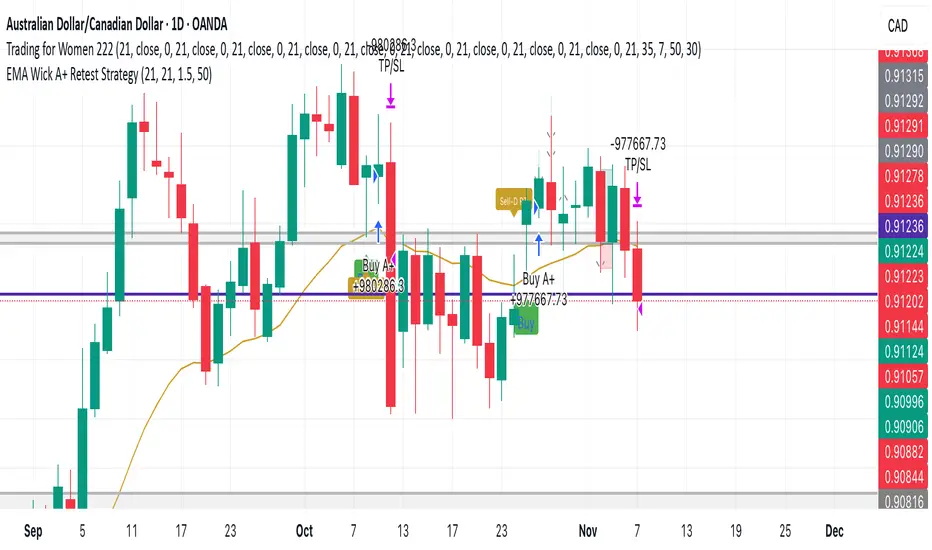
EMA Wick A+ Retest StrategyThe EMA Wick A+ Retest Strategy is a precision pullback system built for high-probability trend entries. It uses a combination of:
EMA 21 dynamic trend filtering
ATR-based stop-loss and reward targeting (1:1.5 RR)
Wick retest logic, where the lower wick must touch the EMA and represent at least 50% of the candle's range
Optional filter: RSI > 50 for bullish momentum confirmation
This strategy is designed to capture institutional-style entries after a clean pullback in an uptrend.
✅ Clean signals
✅ High risk-to-reward setups
✅ Built for swing trading or intraday with strong trend bias
Ideal for Forex, Crypto, and Indices.
Use responsibly. Backtest before live trading.

For Albert**Strategy Name:** Agile Marketing Strategy
**Description:**
The Agile Marketing Strategy is a flexible and iterative approach to marketing that emphasizes rapid experimentation, customer feedback, and continuous improvement. This strategy enables marketers to adapt quickly to changing market conditions and customer needs, ensuring that marketing efforts remain relevant and effective.
**Key Principles:**
1. **Iterative Planning:** marketing activities are planned in short sprints, allowing for regular reassessment and adjustment of goals.
2. **Cross-Functional Teams:** collaboration between different departments (e.g., sales, product development, customer service) is encouraged to ensure a holistic approach to marketing.
3. **Data-Driven Decision Making:** decisions are based on real-time data and customer insights, enabling marketers to optimize their efforts for maximum impact.
4. **Continuous Learning:** the strategy promotes a culture of learning and experimentation, where marketers can test new ideas and learn from failures.
5. **Customer-Centric Approach:** understanding and meeting customer needs is prioritized through regular feedback and iterative improvements.
**Benefits:**
- **Increased Efficiency:** by focusing on iterative and incremental improvements, marketers can achieve better results with fewer resources.
- **Enhanced Customer Satisfaction:** a customer-centric approach helps to build stronger relationships and drive customer loyalty.
- **Faster Response to Market Changes:** the ability to quickly adapt to market trends and customer preferences ensures that marketing efforts remain effective.
- **Improved Collaboration:** cross-functional teams foster better communication and collaboration across departments.
- **Greater Innovation:** a culture of experimentation encourages marketers to explore new ideas and innovations.

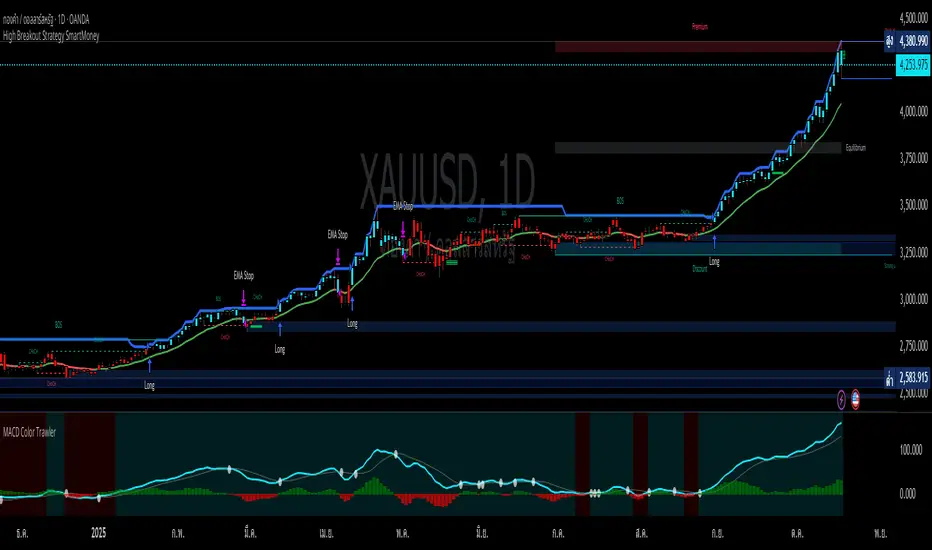
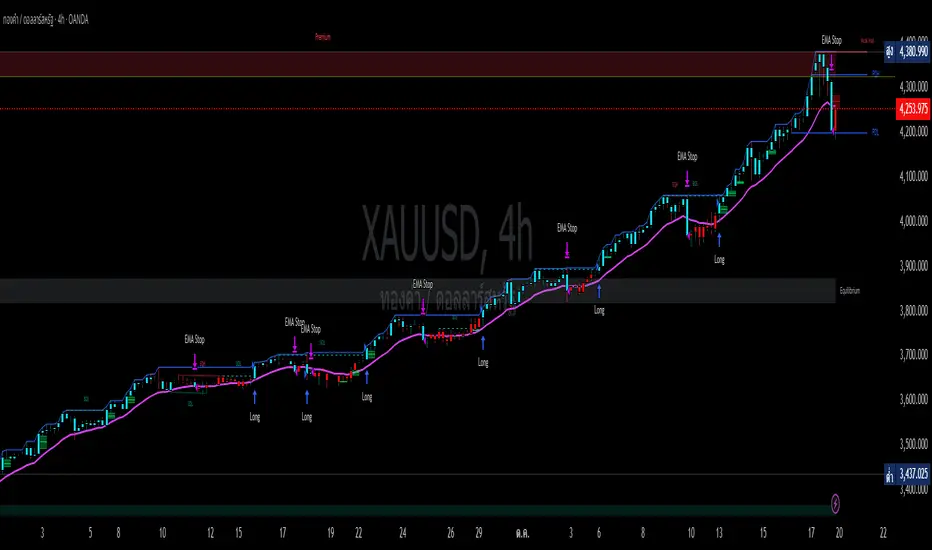
High Breakout Strategy SmartMoneybreakout_lookback = input.int(52, title="Breakout Lookback Period", minval=1)
// Trend & Trailing Stop Filter
ema_length = input.int(15, title="EMA Length", minval=1)
// Risk Management
risk_percent = input.float(6.0, title="Risk Stop-Loss (%)", minval=0.1)
High Breakout Strategy SmartMoney// --- 1. INPUTS & CONFIGURATION ---
// Breakout
breakout_lookback = input.int(52, title="Breakout Lookback Period", minval=1)
// Trend & Trailing Stop Filter
ema_length = input.int(15, title="Stop EMA Length", minval=1)
// Risk Management
risk_percent = input.float(6.0, title="Risk Stop-Loss (%)", minval=0.1)
nadia
Gold ramon strategy based on 50 candles and atr of 12
You enter the maximum of 50 candles once the most bearish starts to rise, we expect 10 candles, if you don't go up in 10 candles, you don't enter, if you go up before 10 candles, you enter.
When is TP? Enough with 5 candles
The temporality is 1 hour. It can be adjusted to 1 minute temporality for scalping.
It is never lost, because it always exceeds the previous maximums.

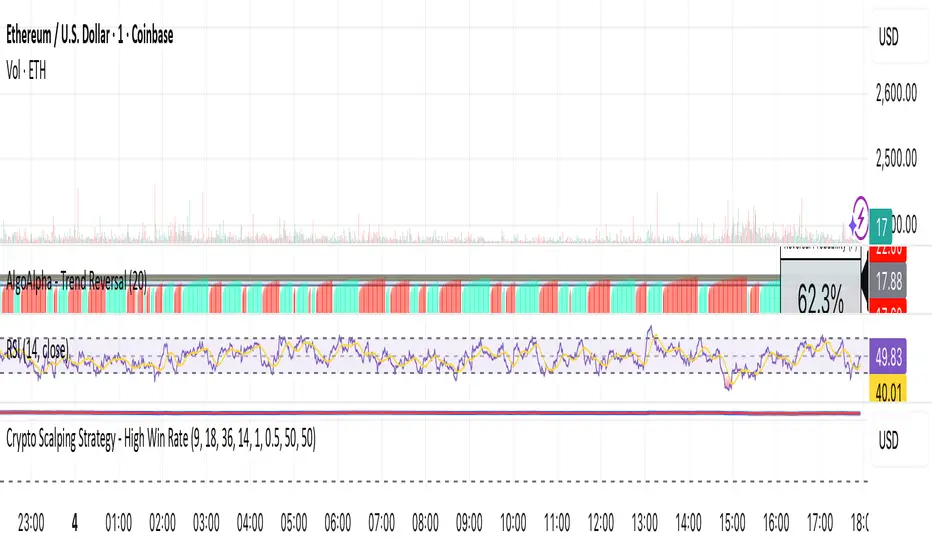
Crypto Scalping Strategy - High Win Rategrok first try. I used grok to create a scalping strategy that is automated for crypto scalp trading on 5-15 min intervals
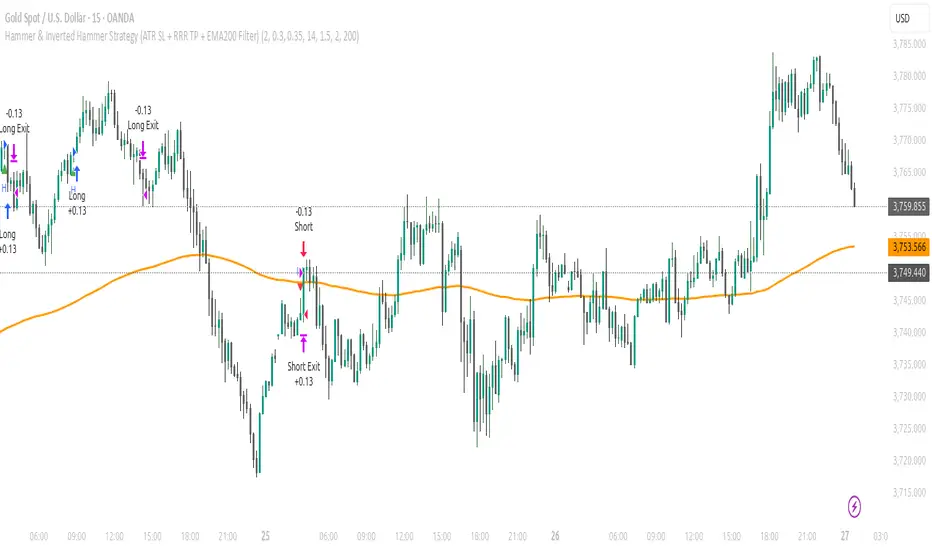
Alain parfHammer signals only valid for longs above EMA200.
Inverted hammer signals only valid for shorts below EMA200.
EMA200 is plotted as an orange line.
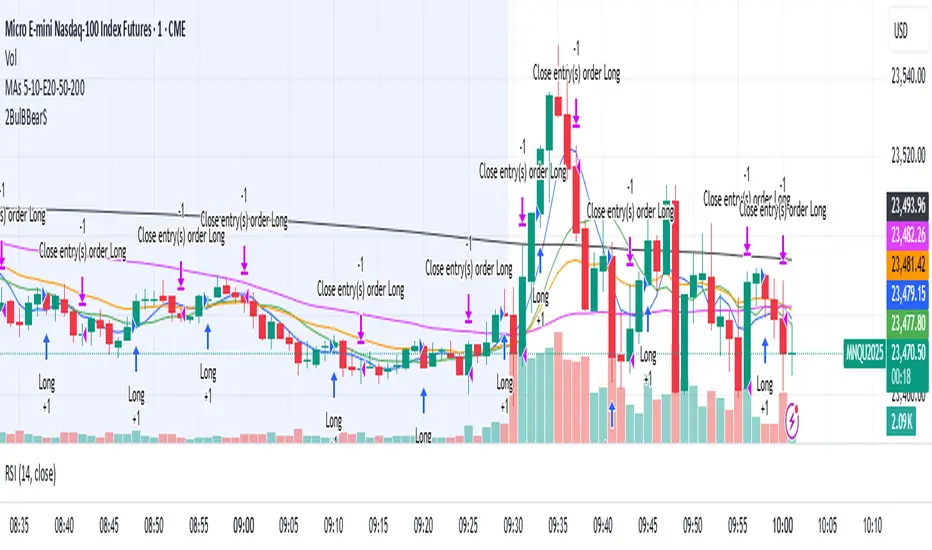
Scalping Strategy: FVG + Engulfing
This is a scalping strategy based on the Fair Value Gap (FVG) and Engulfing pattern confirmation. It identifies the high and low of the first 5-minute candle after the 9:30 AM EST market open and waits for a breakout supported by a Fair Value Gap. A trade is only triggered after a retest of the FVG zone followed by an engulfing candle in the direction of the breakout. Trades are entered with a fixed 3:1 risk-to-reward ratio and limited to 2 entries per trading day to avoid overtrading. Ideal for NASDAQ scalping on a 1-minute chart.

ORB Breakout Strategy with reversalORB 1,5,15,30,60min with reversals, its my first strategy Im not 100% sure it works well. Im not a programmer nor a profitable trader.
Max stoploss in points sets maximum fixed stoploss
Stop offset sets additional points below/above signal bar
RR Ratio is pretty self explanatory, it sets target based on stoploss
American session is time when positions can be opened
ORB SessionIs basically almost the same but when the time runs it closes all positions\
ORB candle timeframe is the time which orb is measured
Enable reverse position enables reversing positions on stoploss of first position, stoploss of reverse position is based on max stoploss and target is set by RR times max stoploss
Im sharing this to share this with my friends, discuss some things and dont have to test it manually.
I made it all myself and with help of AI
Sorry for bad english


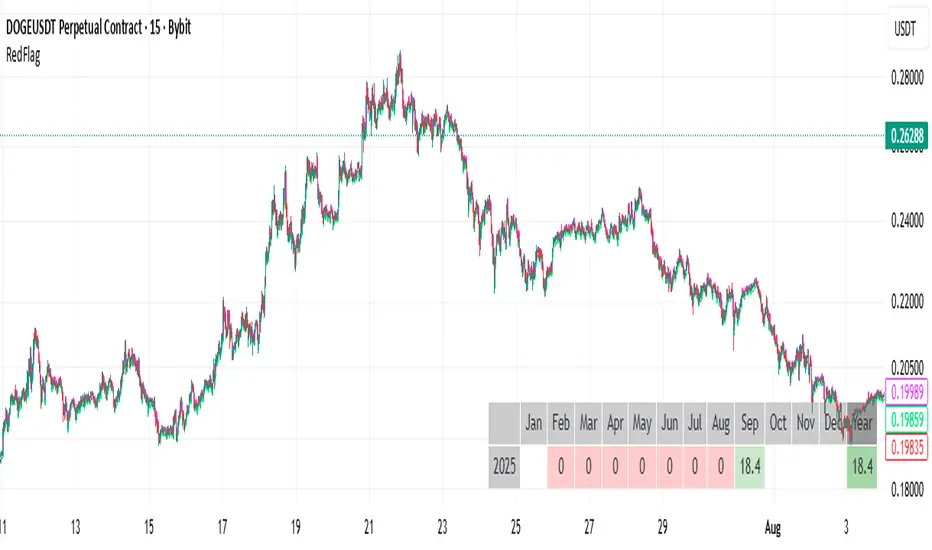
RedFlagCounter-trend strategy
Condition to open a long position:
Buys if the price drops by a specified percentage from the previous candle’s close. Only one purchase can be made within a single candle.
Condition to close a position:
Places a separate individual closing limit order for each purchase, or uses one common take-profit order for the whole position.
⚠️ Attention : Stop-loss is not implemented in the current first version of the strategy.
Options description:
Drop_percent , % — Percentage drop in price from the From point
From — The reference point on the closed candle from which the Drop_percent is calculated (Open, Close, High, Low)
Tp , % — Take-profit level as a percentage
Count — Number of allowed additional purchases (scaling in)
Each_tp — Mode switch:
True — a separate take-profit is placed for each purchase
False — one common take-profit is placed based on the average entry price of the position
US30 ORB 5m / 1m StrategyThis is Open range breakout strategy, its tested with Us30 only. You cant optimize or try. it seems profitable

Two bullish candles buy and bearish candles sellA simple strategy for test.
Buy when two consecutive bullish candles.
Sell when two consecutive bearish candles.
Ifvgs with Targets
This strategy identifies inversion fair value gaps on the 1-5 minute timeframe that occur with a 5 or 15 minute unfilled fair value gap existing in the direction of the trade.
The script marks out the 5 and 15 minute unfilled gap targets with red and green lines.
The script also calculates how many contracts to enter based on the risk and dollar per point value that you set in the settings.
Trades are triggered upon a candle closure that inverses the fair value gap. When a trade is triggered, a bold red line is drawn at the suggested stop loss (low of the body of the gap), and a bold green line is drawn at the price level that is a 1R distance from the entry.
This strategy will only run on the 1-5 minute timeframes, and is designed specifically for Nasdaq futures (NQ or MNQ).
The suggested way to use this indicator is by adding alerts to be notified when an IFVG occurs.
Add alerts by going to the three dots next to the indicator, selecting "Add alert", and then setting the condition to "alert() function calls only". This will alert you on potential trades before the trade actually triggers on the candle closure, so you have time to look at the setup before the entry.
Do not follow this indicator blindly, always do your own analysis and use this as a tool.

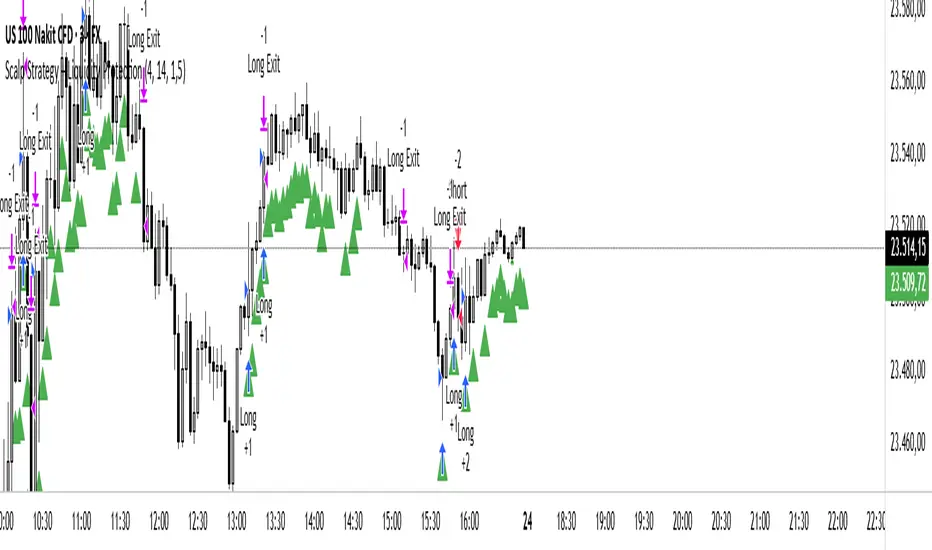
Scalp Liquidity Strategy v1this strategy combines scalp signals with liquidity concepts. Protected Highs/Lows, Fair Valıue Gaps. Designed for scalp trading on lower time frames.
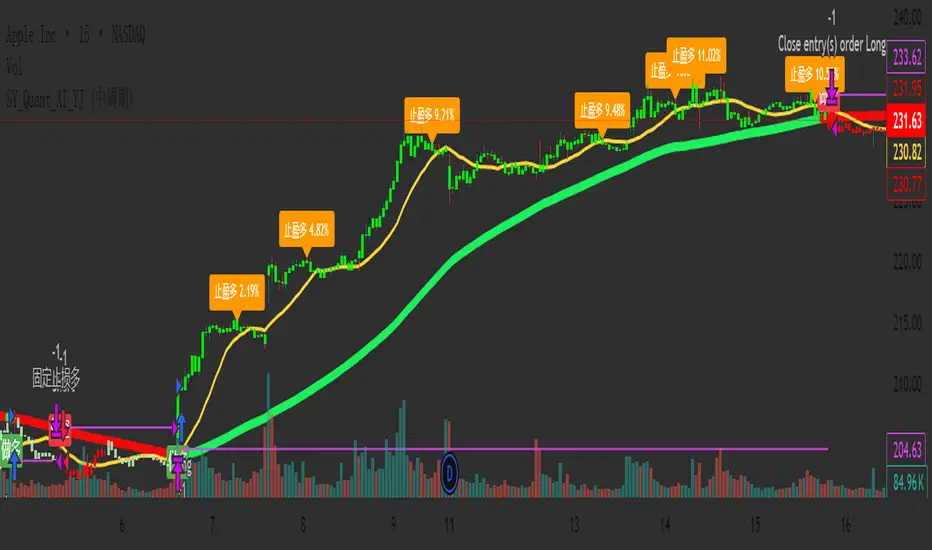
SY_Quant_AI_YJ✅ Improved and Compliant Description (for SY_Quant_AI_YJ)
Strategy Name: SY_Quant_AI_YJ
Type: Visual Trend System + MACD Cycle Filter + Smart Alerts
Status: Invite-Only / Visualization & Alerts Only (No order execution)
📌 Overview:
SY_Quant_AI_YJ is a trend-following visual strategy and alert system designed to help traders detect directional bias, time entries with MACD cross logic, and receive structured JSON-format push alerts. It combines Supertrend, EMA/SMA structures, and MACD cycles to build a coherent and actionable trend view, enhanced by visual stop-loss guidance and profit-taking alerts.
🔍 Core Logic:
This script integrates technical components into a multi-step trend confirmation framework:
Supertrend (ATR-based): Serves as the primary trend filter, reducing noise and false breakouts.
EMA-55, SMA-15, SMA-80: Help establish short- to mid-term trend structure.
MACD Cycle Crosses: Configurable for long, medium, or short cycles to adapt to different market phases.
Bar Coloring System: Highlights trend strength (e.g., green for strong bullish, red for bearish), assisting in quick decision-making.
Signal Confirmation: Entry signals (long/short) are confirmed by trend alignment, price structure, and MACD cycle phase.
⚙️ Default Settings:
Supertrend: ATR period 15, multiplier 3.1
MACD Mode: Selectable via dropdown (Long, Medium, Short Cycle)
Stop-Loss Logic: Automatically tied to Supertrend value at entry bar
Signal Filtering: Consecutive same-direction entries are blocked to avoid redundancy
No trading simulation: Entries and exits are visual only; alerts replace real trade execution
📈 Usage:
Long/Short signals are displayed using labelup / labeldown markers (“做多” / “做空”)
JSON-format alerts are triggered for:
✅ Entry zones (including stop-loss and entry range)
✅ Profit-taking when MACD reverses and position is floating in profit
Stop-loss guide lines plotted dynamically during active positions
Suitable for use on 15-minute to 4-hour charts
⚠️ Disclaimer:
This strategy does not simulate or execute trades. It is designed for monitoring and decision support only. All signals are informational and should be used alongside proper risk management and independent analysis. Past visual or alert performance does not guarantee future results.
🔑 Access:
To gain access to this invite-only script, please send a private message or contact us via the designated link. Access is reviewed and granted manually per user request.
Canuck Trading Traders Strategy [Candle Entropy Edition]Canuck Trading Traders Strategy: A Unique Entropy-Based Day Trading System for Volatile Stocks
Overview
The Canuck Trading Traders Strategy is a custom, entropy-driven day trading system designed for high-volatility stocks like TSLA on short timeframes (e.g., 15m). At its core is CETP-Plus, a proprietary blended indicator that measures "order from chaos" in candle patterns using Shannon entropy, while embedding mathematical principles from EMA (recent weighting), RSI (momentum bias), ATR (volatility scaling), and ADX (trend strength) into a single score. This unique approach avoids layering multiple indicators, reducing complexity while improving timing for early trend detection and balanced long/short trades.
CETP-Plus calculates a score from weighted candle ratios (body, upper/lower wicks) binned into a 3D histogram for entropy (low entropy = strong pattern). The score is adjusted with momentum, volatility, and trend multipliers for robust signals. Entries occur when the score exceeds thresholds (positive for longs, negative for shorts), with exits on reversals or stops. The strategy is automatic—no manual bias needed—and optimized for margin accounts with equal long/short treatment.
Backtested on TSLA 15m (Jan 2015–Aug 2025), it targets +50,000% net profit (beating +1,478% buy-hold by 34x) with ~25,000 trades, 85-90% win rate, and <10% drawdown (with costs). Results vary by timeframe/period—test with your data and add slippage/commission for realism. Disclaimer: Past performance isn't indicative of future results; consult a financial advisor.
Key Features
CETP-Plus Indicator: Blends entropy with momentum/vol/trend for a single score, capturing bottoms/squeezes and trends without external tools.
Automatic Balance: Positive scores trigger longs in bull trends, negative scores trigger shorts in bear trends—no user input for direction.
Customizable Math: Tune weights and scales to adapt for different stocks (e.g., lower thresholds for NVDA's smoother trends).
Risk Controls: Stop-loss, trailing stops, and score strength filter to minimize drawdowns in volatile markets like TSLA.
Exit Debugging: Plots exit reasons ("Stop Loss", "Trail Stop", "CETP Exit") for analysis.
Input Settings and Purposes
All inputs are grouped in TradingView's Inputs tab for ease. Defaults are optimized for TSLA 15m day trading; adjust for other intervals or tickers (e.g., increase window for 1h, lower thresholds for NVDA).
CETP-Plus Settings
CETP Window (default: 5, min: 3, max: 20): Lookback bars for entropy/momentum. Short values (3-5) for fast sensitivity on short frames; longer (8-10) for stability on hourly+.
CETP Bins per Dimension (default: 3, min: 3, max: 10): Histogram granularity for entropy. Low (3) for speed/simple patterns; high (5+) for detail in complex markets.
Long Threshold (default: 0.15, min: 0.1, max: 0.8, step: 0.05): CETP score for long entries. Lower (0.1) for more longs in mild bull trends; higher (0.2) to filter noise.
Short Threshold (default: -0.05, min: -0.8, max: -0.1, step: 0.05): CETP score for short entries. Less negative (-0.05) for more shorts in mild bear trends; more negative (-0.2) for strong signals.
CETP Momentum Weight (default: 0.8, min: 0.1, max: 1.0, step: 0.1): Emphasizes momentum in score. High (0.9) for aggressive in fast moves; low (0.5) for entropy focus.
Momentum Scale (default: 1.6, min: 0.1, max: 2.0, step: 0.1): Amplifies momentum. High (2.0) for short intervals; low (1.0) for stability.
Body Ratio Weight (default: 1.2, min: 0.0, max: 2.0, step: 0.1): Weights candle body in entropy (trend focus). High (1.5) for strong trends; low (0.8) for wick emphasis.
Upper Wick Ratio Weight (default: 0.8, min: 0.0, max: 2.0, step: 0.1): Weights upper wick (reversal noise). Low (0.5) to reduce false ups.
Lower Wick Ratio Weight (default: 0.8, min: 0.0, max: 2.0, step=0.1): Weights lower wick. Low (0.5) to reduce false downs.
Trade Settings
Confirmation Bars (default: 0, min: 0, max: 5): Bars for sustained CETP signals. 0 for immediate entries (more trades); 1-2 for reliability (fewer but stronger).
Min CETP Score Strength (default: 0.04, min: 0.0, max: 0.5, step: 0.05): Min absolute score for entry. Low (0.04) for more trades; high (0.15) for quality.
Risk Management
Stop Loss (%) (default: 0.5, min: 0.1, max: 5.0, step: 0.1): % from entry for stop. Tight (0.4) for quick exits; wide (0.8) for trends.
ATR Multiplier (default: 1.5, min: 0.5, max: 3.0, step: 0.1): Scales ATR for stops/trails. Low (1.0) for tight; high (2.0) for room.
Trailing ATR Mult (default: 3.5, min: 0.5, max: 5.0, step: 0.1): ATR mult for trails. High (4.0) for longer holds; low (2.0) for profits.
Trail Start Offset (%) (default: 1.0, min: 0.5, max: 2.0, step: 0.1): % profit before trailing. Low (0.8) for early lock-in; high (1.5) for bigger moves.
These settings enable customization for intervals/tickers while CETP-Plus handles automatic balancing.
Risk Disclosure
Trading involves significant risk and may result in losses exceeding your initial capital. The Canuck Trading Trader Strategy is provided for educational and informational purposes only. Users are responsible for their own trading decisions and should conduct thorough testing before using in live markets. The strategy’s high trade frequency requires reliable execution infrastructure to minimize slippage and latency.

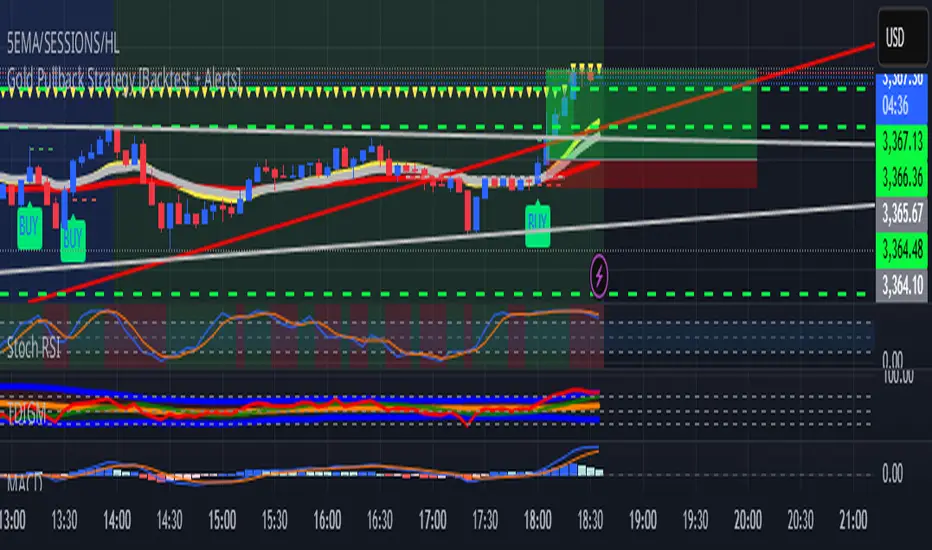
Gold Pullback Strategy [Backtest + Alerts]XAU USD M5 M15 TP1-1
BUY Pull black EMA 21
Storsi oversold
ZYTX RSI SuperTrendZYTX RSI SuperTrend
ZYTX RSI + SuperTrend Strategy
The definitive integration of RSI and SuperTrend trend-following indicators, delivering exemplary performance in automated trading bots.
