Kaufman Adaptive Moving Average (fixed TF)**Kaufman Adaptive Moving Average – fixed Timeframe version (Pine v5)**
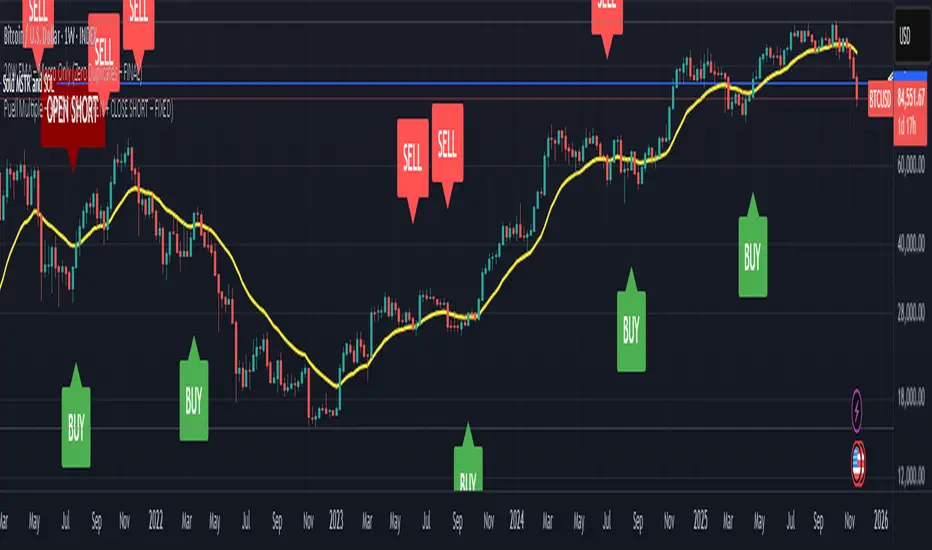
This script is a Pine Script v5 adaptation of the original *Kaufman Adaptive Moving Average* by Alex Orekhov (everget), extended with the ability to calculate KAMA on a **fixed timeframe**. You can keep the calculation on your current chart timeframe or lock it to any higher timeframe (for example 1D on a 1H chart) and still display the line on your active chart.
KAMA automatically adjusts its smoothing based on price efficiency: it becomes faster in trending markets and slower in choppy ones. This version colors the line green/red depending on the direction of the KAMA on the **selected timeframe**, and includes an optional “await bar confirmation” setting to avoid reacting to still-forming bars.
**Main features**
* Original Kaufman Adaptive Moving Average logic (length, fast/slow EMA lengths, source input)
* Optional **fixed timeframe** input for the KAMA calculation (leave empty to use chart timeframe)
* Non-repainting higher-timeframe calculation using `request.security()`
* Dynamic color change (green/red) based on KAMA trend on the chosen timeframe
* Optional bar-confirmation filter for more conservative color changes
* Built-in alert on color change (trend shift)
**How to use**
1. Add the indicator to your chart.
2. Leave “KAMA Timeframe” empty to use the chart’s timeframe (standard KAMA).
3. Or set “KAMA Timeframe” to a higher TF (e.g. `60`, `240`, `D`, `W`) to overlay a higher-timeframe KAMA on a lower-timeframe chart.
4. Use the color changes or the alert to identify potential trend shifts in the selected timeframe while watching price action on your working timeframe.
Pine Script® インジケーター