Hull MA with Alerts and LabelsThis script is designed to help traders visually track market trends using various types of moving averages (MAs) and to receive alerts when certain conditions are met. Here’s a detailed breakdown of how the script works:
1. User Inputs and Customization:
MA Length: Traders can define the length of the moving average (default is 100).
Confirmation Candles: The trader can specify how many candles must confirm a trend before the script triggers a signal (default is 1).
MA Variation: The trader can choose between different moving average types: Simple Moving Average (SMA), Exponential Moving Average (EMA), Weighted Moving Average (WMA), or Hull Moving Average (HMA).
Source: Traders select the price source for the moving average calculation (e.g., close price).
Ribbon Transparency: Allows control over the transparency level of the ribbon plotted between the moving averages.
Bullish/Bearish Ribbon Colors: The user can choose the colors for bullish and bearish trends.
2. Moving Average Calculations:
The script provides multiple options for calculating moving averages:
SMA (Simple Moving Average)
EMA (Exponential Moving Average)
WMA (Weighted Moving Average)
HMA (Hull Moving Average)
For the Hull Moving Average (HMA), it uses a specific formula that smoothens the movement and reduces lag, which is helpful for more reactive trend detection.
3. Plotting Moving Averages and Trend Ribbon:
The script calculates two key moving averages:
MHULL: The main moving average, selected based on the user’s chosen MA variation and source.
SHULL: A shifted version of the MHULL to help compare trends (shifted by 2 bars).
These two moving averages are plotted on the chart for visualization. MHULL is plotted in green (or another color if changed), while SHULL is plotted in red. A ribbon is drawn between MHULL and SHULL to indicate trends visually. The ribbon changes color depending on whether the trend is bullish (MHULL > SHULL) or bearish (MHULL < SHULL). The ribbon’s transparency can be adjusted for visual clarity.
4. Trend Detection:
Bullish Trend: The script checks if the price has closed above MHULL for the defined number of confirmation candles. If confirmed, a bullish trend is detected.
Bearish Trend: Similarly, the script checks if the price has closed below SHULL for the confirmation period, indicating a bearish trend.
The script tracks whether the market is in a bullish or bearish trend and prevents repeated signals by remembering the current trend state.
5. Alerts and Labels:
Bullish Alerts and Labels: When a confirmed bullish trend is detected (i.e., price closes above MHULL for the entire confirmation period and MHULL > SHULL), the script triggers an alert notifying the trader of the bullish condition. A "BULLISH" label is placed on the chart near the low of the candle where the trend was confirmed.
Bearish Alerts and Labels: If a confirmed bearish trend is detected (i.e., price closes below SHULL for the confirmation period and MHULL < SHULL), the script triggers an alert for the bearish condition. A "BEARISH" label is placed on the chart near the high of the candle where the trend was confirmed.
These alerts and labels help traders act quickly on trend changes and align their trading strategy with market conditions.
6. Practical Use for Traders:
For traders, this script offers:
Customizability : It allows traders to define the length and type of moving averages, choose price sources, and control how signals are confirmed.
Visual Trend Representation : The plotted MA lines and colored ribbons help traders easily see market direction.
Early Warnings : With alerts and labels, the script gives traders early signals when trends are shifting, allowing them to adjust positions accordingly.
Trend Confirmation : The script waits for a user-defined number of confirmation candles before signaling a new trend, reducing false signals.
Overall, the script helps traders automate their strategy by tracking moving averages and alerting them when key trend conditions are met.
"Exponential Moving Average"に関するスクリプトを検索

Averaged Moving Average Ribbon with Bollinger BandsThis indicator provides a visual representation of an averaged weighted moving average (WMA) ribbon (default setting) along with Bollinger Bands on a price chart. Pay attention to how the moving average and band expand and contract, as well as where price crosses the Bollinger bands (Green and red) or the basis line (blue). Look for patterns, and exploit them to your advantage to give you another edge in trading.
>> Feel free to suggest changes or other additions in the comments :)
Here's a brief explanation of how this indicator works:
1. **Moving Average Type:** You can select the type of moving average (MA) to use from the dropdown menu. The available options are Weighted Moving Average (WMA), Simple Moving Average (SMA), and Exponential Moving Average (EMA).
2. **Bollinger Bands Deviation:** This input allows you to adjust the deviation for the Bollinger Bands. Higher values increase the width of the bands, while lower values decrease it.
3. **Moving Average Lengths:** The script calculates various moving averages (WMA, SMA, or EMA) with different lengths, ranging from 5 to 100, in increments of 5. These moving averages are used to create the ribbon.
4. **Ribbon Calculation:** The indicator calculates the selected moving average (WMA, SMA, or EMA) for each of the specified lengths. It then averages these moving averages to create a ribbon of MAs. This ribbon represents a smoother and more encompassing view of the underlying price action.
5. **Bollinger Bands:** The script also calculates and plots Bollinger Bands based on the ribbon's average. The upper Bollinger Band (green) and lower Bollinger Band (red) are plotted around the ribbon average. These bands provide insights into potential overbought and oversold conditions.
In summary, this indicator allows traders and analysts to visualize a weighted moving average ribbon with Bollinger Bands to gain a better understanding of price trends, volatility, and potential reversal points in the market. The combination of different moving average lengths and Bollinger Bands can help in making informed trading decisions.

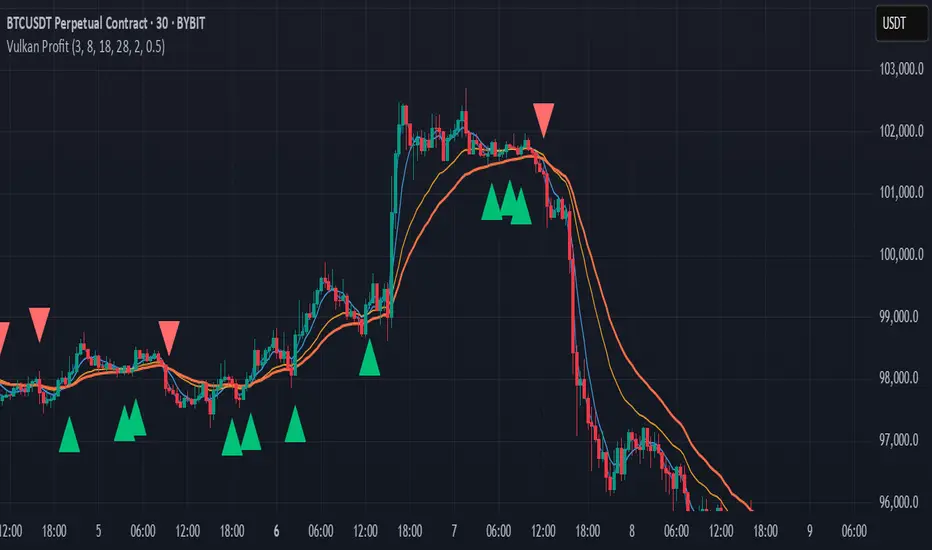
Vulkan Profit
Overview
The Vulkan Profit indicator is a trend-following tool that identifies potential entry and exit points by monitoring the relationship between short-term and long-term moving averages. It generates clear buy and sell signals when specific moving average conditions align, making it useful for traders looking to confirm trend changes across multiple timeframes.
How It Works
The indicator utilizes four different moving averages:
Fast WMA (period 3) - A highly responsive weighted moving average
Medium WMA (period 8) - A less sensitive weighted moving average
Fast EMA (period 18) - A responsive exponential moving average
Slow EMA (period 28) - A slower exponential moving average
These moving averages are grouped into two categories:
Short-term MAs: Fast WMA and Medium WMA
Long-term MAs: Fast EMA and Slow EMA
Signal Generation Logic
The Vulkan Profit indicator generates signals based on the relative positions of these moving averages:
Buy Signal (Green Triangle)
A buy signal appears when the minimum value of the short-term MAs becomes greater than the maximum value of the long-term MAs. In other words, when both short-term MAs cross above both long-term MAs.
Sell Signal (Red Triangle)
A sell signal appears when the maximum value of the short-term MAs becomes less than the minimum value of the long-term MAs. In other words, when both short-term MAs cross below both long-term MAs.
Visual Components
Moving Averages - All four moving averages can be displayed or hidden
Signal Arrows - Green triangles for buy signals, red triangles for sell signals
Colored Line - A line that changes color based on the current market stance (green for bullish, red for bearish)
Customization Options
The indicator offers several customization settings:
Toggle the visibility of moving averages
Toggle the visibility of buy/sell signals
Adjust the color, width, and position of the signal line
Choose between different line styles (Line, Stepline, Histogram)
Practical Trading Applications
Trend Identification: The relative positioning of all moving averages helps identify the current market trend
Entry/Exit Points: The buy and sell signals can be used as potential entry and exit points
Trend Confirmation: The colored line provides ongoing confirmation of the trend direction
Filter: Can be used in conjunction with other indicators as a trend filter
Trading Strategy Suggestions
Trend Following: Enter long positions on buy signals and exit on sell signals during trending markets
Confirmation Tool: Use the signals to confirm trades identified by other indicators
Timeframe Analysis: Apply the indicator across multiple timeframes for stronger confirmation
Risk Management: Place stop-loss orders below recent swing lows for long positions and above recent swing highs for short positions
Tips for Best Results
The indicator performs best in trending markets and may generate false signals in ranging or highly volatile markets
Consider the broader market context before taking trades based solely on these signals
Use appropriate position sizing and risk management regardless of the indicator's signals
The longer timeframes generally produce more reliable signals with fewer false positives
The Vulkan Profit indicator combines the responsiveness of short-term averages with the stability of long-term averages to capture significant trend changes while filtering out minor price fluctuations.
[blackcat] L3 Counter Peacock Spread█ OVERVIEW
The script titled " L3 Counter Peacock Spread" is an indicator designed for use in TradingView. It calculates and plots various moving averages, K lines derived from these moving averages, additional simple moving averages (SMAs), weighted moving averages (WMAs), and other technical indicators like slope calculations. The primary function of the script is to provide a comprehensive set of visual tools that traders can use to identify trends, potential support/resistance levels, and crossover signals.
█ LOGICAL FRAMEWORK
Input Parameters:
There are no explicit input parameters defined; all variables are hardcoded or calculated within the script.
Calculations:
• Moving Averages: Calculates Simple Moving Averages (SMA) using ta.sma.
• Slope Calculation: Computes the slope of a given series over a specified period using linear regression (ta.linreg).
• K Lines: Defines multiple exponentially adjusted SMAs based on a 30-period MA and a 1-period MA.
• Weighted Moving Average (WMA): Custom function to compute WMAs by iterating through price data points.
• Other Indicators: Includes Exponential Moving Average (EMA) for momentum calculation.
Plotting:
Various elements such as MAs, K lines, conditional bands, additional SMAs, and WMAs are plotted on the chart overlaying the main price action.
No loops control the behavior beyond those used in custom functions for calculating WMAs. Conditional statements determine the coloring of certain plot lines based on specific criteria.
█ CUSTOM FUNCTIONS
calculate_slope(src, length) :
• Purpose: To calculate the slope of a time-series data point over a specified number of periods.
• Functionality: Uses linear regression to find the current and previous slopes and computes their difference scaled by the timeframe multiplier.
• Parameters:
– src: Source of the input data (e.g., closing prices).
– length: Periodicity of the linreg calculation.
• Return Value: Computed slope value.
calculate_ma(source, length) :
• Purpose: To calculate the Simple Moving Average (SMA) of a given source over a specified period.
• Functionality: Utilizes TradingView’s built-in ta.sma function.
• Parameters:
– source: Input data series (e.g., closing prices).
– length: Number of bars considered for the SMA calculation.
• Return Value: Calculated SMA value.
calculate_k_lines(ma30, ma1) :
• Purpose: Generates multiple exponentially adjusted versions of a 30-period MA relative to a 1-period MA.
• Functionality: Multiplies the 30-period MA by coefficients ranging from 1.1 to 3 and subtracts multiples of the 1-period MA accordingly.
• Parameters:
– ma30: 30-period Simple Moving Average.
– ma1: 1-period Simple Moving Average.
• Return Value: Returns an array containing ten different \u2003\u2022 "K line" values.
calculate_wma(source, length) :
• Purpose: Computes the Weighted Moving Average (WMA) of a provided series over a defined period.
• Functionality: Iterates backward through the last 'n' bars, weights each bar according to its position, sums them up, and divides by the total weight.
• Parameters:
– source: Price series to average.
– length: Length of the lookback window.
• Return Value: Calculated WMA value.
█ KEY POINTS AND TECHNIQUES
• Advanced Pine Script Features: Utilization of custom functions for encapsulating complex logic, leveraging TradingView’s library functions (ta.sma, ta.linreg, ta.ema) for efficient computations.
• Optimization Techniques: Efficient computation of K lines via pre-calculated components (multiples of MA30 and MA1). Use of arrays to store intermediate results which simplifies plotting.
• Best Practices: Clear separation between calculation and visualization sections enhances readability and maintainability. Usage of color.new() allows dynamic adjustments without hardcoding colors directly into plot commands.
• Unique Approaches: Introduction of K lines provides an alternative representation of trend strength compared to traditional MAs. Implementation of conditional band coloring adds real-time context to existing visual cues.
█ EXTENDED KNOWLEDGE AND APPLICATIONS
Potential Modifications/Extensions:
• Adding more user-defined inputs for lengths of MAs, K lines, etc., would make the script more flexible.
• Incorporating alert conditions based on crossovers between key lines could enhance automated trading strategies.
Application Scenarios:
• Useful for both intraday and swing trading due to the combination of short-term and long-term MAs along with trend analysis via slopes and K lines.
• Can be integrated into larger systems combining this indicator with others like oscillators or volume-based metrics.
Related Concepts:
• Understanding how linear regression works internally aids in grasping the slope calculation.
• Familiarity with WMA versus SMA helps appreciate why different types of averaging might be necessary depending on market dynamics.
• Knowledge of candlestick patterns can complement insights gained from this indicator.

Heiken Ashi MTF Monitor - Better Formula - EMA, AMA, KAFA, T3Heiken Ashi MTF Monitor - Better Formula - EMA, AMA, KAFA, T3
This indicator is based on the works of Loxx & Smart_Money-Trader, without their initial codes, none of this will be possible.
This Pine Script indicator provides a multi-timeframe (MTF) analysis of Heiken Ashi trends, designed to enhance the traditional Heiken Ashi method with advanced smoothing techniques such as the Exponential Moving Average (EMA), Adaptive Moving Average (AMA), Kaufman’s Adaptive Moving Average (KAMA), and the Triple Exponential Moving Average (T3). The indicator offers a flexible approach to identify bullish, bearish, and neutral trends across six customizable timeframes and various Heiken Ashi calculation methods.
Key Features:
Multi-Timeframe (MTF) Support: The indicator allows you to monitor trends across six timeframes (e.g., 2-hour, 4-hour, daily, weekly, monthly), giving a holistic view of market conditions at different scales.
Heiken Ashi Calculation Methods: Choose between traditional Heiken Ashi or an enhanced "Better HA" method for more refined trend analysis.
Smoothing Options: Apply different smoothing techniques, including EMA, T3, KAMA, or AMA, to the Heiken Ashi values for smoother, more reliable trend signals.
Non-Repaint Option: This feature ensures that the values do not repaint after the bar closes, providing a more reliable historical view.
Customizable Plotting: The indicator offers full customization of which timeframes to display and whether to show labels for each timeframe.
Inputs and Settings:
Timeframe Inputs:
Users can set up to six different timeframes, ranging from intraday (2-hour, 4-hour) to higher timeframes (daily, weekly, monthly).
Timeframes can be enabled or disabled individually for each analysis.
Label Visibility:
Labels indicating the trend direction (bullish, bearish, neutral) can be shown for each timeframe. This helps with clarity when monitoring multiple timeframes simultaneously.
Smoothing Options:
EMA: Exponential Moving Average for standard smoothing.
AMA: Adaptive Moving Average, which adapts its smoothing based on market volatility.
KAMA: Kaufman’s Adaptive Moving Average, which adjusts its sensitivity to price fluctuations.
T3: Triple Exponential Moving Average, providing a smoother and more responsive moving average.
None: No smoothing applied (for raw Heiken Ashi calculations).
Non-Repaint Setting:
Enabling this ensures the trend values do not change after the bar closes, offering a stable historical view of trends.
Core Functions:
Heiken Ashi Calculations:
Traditional HA: The classic Heiken Ashi calculation is used here, where each bar's open, close, high, and low are computed based on the average price of the previous bar.
Better HA: A refined calculation method, where the raw Heiken Ashi close is adjusted by considering the price range. This smoother value is then optionally processed through a moving average function for further smoothing.
Heiken Ashi Trend Calculation:
Based on the selected Heiken Ashi method (Traditional or Better HA), the indicator checks whether the trend is bullish (upward movement), bearish (downward movement), or neutral (sideways movement).
For the "Better HA" method, the trend determination uses the difference between the smoothed Heiken Ashi close and open.
Moving Averages:
The moving averages applied to the Heiken Ashi values are configurable:
EMA: Standard smoothing with an exponential weighting.
T3: A triple exponential smoothing technique that provides a smoother moving average.
KAMA: An adaptive smoothing technique that adjusts to market noise.
AMA: An adaptive moving average that reacts to market volatility, making it more flexible.
None: For raw, unsmoothed Heiken Ashi data.
Trend Detection:
The indicator evaluates the direction of the trend for each timeframe and assigns a color-coded value (bearish, bullish, or neutral).
The trend values are plotted as circles, and their color reflects the detected trend: red for bearish, green for bullish, and white for neutral.
Multi-Timeframe (MTF) Support:
The indicator can be used to analyze up to six different timeframes simultaneously.
The trend for each timeframe is calculated and displayed as circles on the chart.
Users can enable or disable individual timeframes, allowing for a customizable view based on which timeframes they are interested in monitoring.
Plotting:
The indicator plots circles at specific levels based on the detected trend (Level 1 for the 2-hour timeframe, Level 2 for the 4-hour timeframe, etc.). The size and color of these circles represent the trend direction.
These plotted values provide a quick visual reference for trend direction across multiple timeframes.
Usage:
Trend Confirmation: By monitoring trends across multiple timeframes, traders can use this indicator to confirm trends and avoid false signals.
Customizable Timeframe Analysis: Traders can focus on shorter timeframes for intraday trades or look at longer timeframes for a broader market perspective.
Smoothing for Clarity: By applying various moving average techniques, traders can reduce noise and get a clearer view of the trend.
Non-Repainting: The non-repaint option ensures the indicator values remain consistent even after the bar closes, providing more reliable signals for backtesting or live trading.
This Heiken Ashi MTF Monitor indicator with better formulas and smoothing options is designed for traders who want to analyze trends across multiple timeframes while benefiting from advanced moving averages and more refined Heiken Ashi calculations. The customizable settings for smoothing, timeframe selection, and label visibility allow users to tailor the indicator to their specific needs and trading style.

Hyper Insight MA Strategy [Universal]Hyper Insight MA Strategy ** is a comprehensive trend-following engine designed for traders who require precision and flexibility. Unlike standard indicators that lock you into a single calculation method, this strategy serves as a "Universal Adapter," allowing you to **Mix & Match 13 different Moving Average types** for both the Fast and Slow trend lines independently.
Whether you need the smoothness of T3, the responsiveness of HMA, or the classic reliability of SMA, this script enables you to backtest thousands of combinations to find the perfect edge for your specific asset class.
---
🔬 Deep Dive: Calculation Logic of Included MAs
This strategy includes 13 distinct calculation methods. Understanding the math behind them will help you choose the right tool for your specific market conditions.
#### 1. Standard Averages
* **SMA (Simple Moving Average):** The unweighted mean of the previous $n$ data points.
* *Logic:* Treats every price point in the period with equal importance. Good for identifying long-term macro trends but reacts slowly to recent volatility.
* **WMA (Weighted Moving Average):** A linear weighted average.
* *Logic:* Assigns heavier weight to current data linearly (e.g., $1, 2, 3... n$). It reacts faster than SMA but is still relatively smooth.
* **SWMA (Symmetrically Weighted Moving Average):**
* *Logic:* Uses a fixed-length window (usually 4 bars) with symmetrical weights $ $. It prioritizes the center of the recent data window.
#### 2. Exponential & Lag-Reducing Averages
* **EMA (Exponential Moving Average):**
* *Logic:* Applies an exponential decay weighting factor. Recent prices have significantly more impact on the average than older prices, reducing lag compared to SMA.
* **RMA (Running Moving Average):** Also known as Wilder's Smoothing (used in RSI).
* *Logic:* It is essentially an EMA but with a slower alpha weight of $1/length$. It provides a very smooth, stable line that filters out noise effectively.
* **DEMA (Double Exponential Moving Average):**
* *Logic:* Calculated as $2 \times EMA - EMA(EMA)$. By subtracting the "lag" (the smoothed EMA) from the original EMA, DEMA provides a much faster reaction to price changes with less noise than a standard EMA.
* **TEMA (Triple Exponential Moving Average):**
* *Logic:* Calculated as $3 \times EMA - 3 \times EMA(EMA) + EMA(EMA(EMA))$. This effectively eliminates the lag inherent in single and double EMAs, making it an extremely fast-tracking indicator for scalping.
#### 3. Advanced & Adaptive Averages
* **HMA (Hull Moving Average):**
* *Logic:* A composite formula involving Weighted Moving Averages: ASX:WMA (2 \times Integer(n/2)) - WMA(n)$. The result is then smoothed by a $\sqrt{n}$ WMA.
* *Effect:* It eliminates lag almost entirely while managing to improve curve smoothness, solving the traditional trade-off between speed and noise.
* **ZLEMA (Zero Lag Exponential Moving Average):**
* *Logic:* This calculation attempts to remove lag by modifying the data source before smoothing. It calculates a "lag" value $(length-1)/2$ and applies an EMA to the data: $Source + (Source - Source )$. This creates a projection effect that tracks price tightly.
* **T3 (Tillson T3 Moving Average):**
* *Logic:* A complex smoothing technique that runs an EMA through a filter multiple times using a "Volume Factor" (set to 0.7 in this script).
* *Effect:* It produces a curve that is incredibly smooth and free of "overshoot," making it excellent for filtering out market chop.
* **ALMA (Arnaud Legoux Moving Average):**
* *Logic:* Uses a Gaussian distribution (bell curve) to assign weights. It allows the user to offset the moving average (moving the peak of the weight) to align it perfectly with the price, balancing smoothness and responsiveness.
* **LSMA (Least Squares Moving Average):**
* *Logic:* Calculates the endpoint of a Linear Regression line for the lookback period. It essentially guesses where the price "should" be based on the best-fit line of the recent trend.
* **VWMA (Volume Weighted Moving Average):**
* *Logic:* Weights the closing price by the volume of that bar.
* *Effect:* Prices on high volume days pull the MA harder than prices on low volume days. This is excellent for validating true trend strength (i.e., a breakout on high volume will move the VWMA significantly).
---
### 🛠 Features & Settings
* **Universal Switching:** Change the `Fast MA` and `Slow MA` types instantly via the settings menu.
* **Trend Cloud:** A dynamic background fill (Green/Red) highlights the crossover zone for immediate visual trend identification.
* **Strategy Mode:** Built-in Backtesting logic triggers `LONG` entries when Fast MA crosses over Slow MA, and `EXIT` when Fast MA crosses under.
### ⚠️ Disclaimer
This script is intended for educational and research purposes. The wide variety of MA combinations can produce vastly different results. Past performance is not indicative of future results. Please use proper risk management.

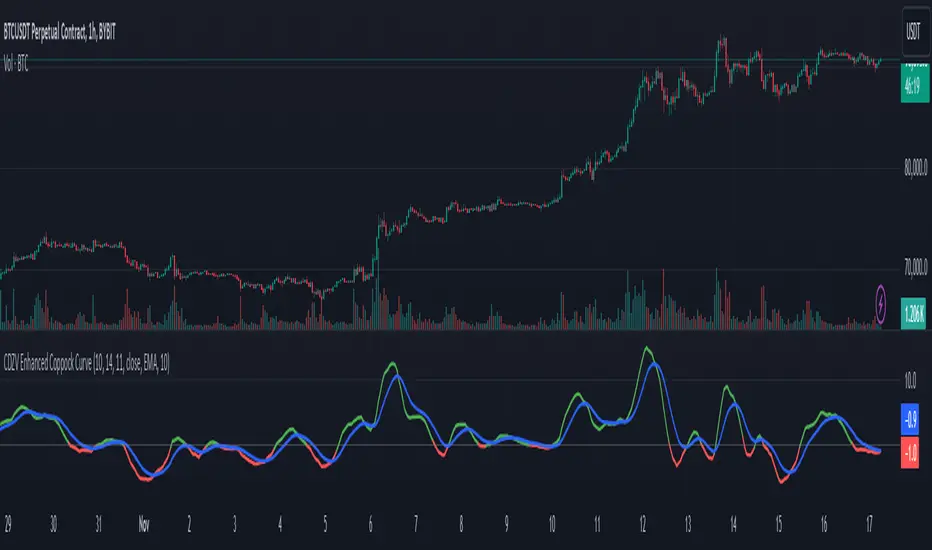
CDZV Enhanced Coppock CurveThis indicator is a part of the CDZV toolkit (backtesting and automation)
The Enhanced Coppock Curve is an upgraded version of the classic Coppock Curve indicator. It incorporates several additional features for greater flexibility and analysis capabilities. This indicator is used to analyze market trends by plotting a weighted moving average (WMA) of the sum of two Rate of Change (ROC) values.
Key Features of the Indicator:
Base Calculation of the Coppock Curve:
The Coppock Curve is calculated as a weighted moving average (WMA) of the sum of two ROC values (long and short periods).
The source for the calculation is customizable (default is close).
Added Custom Moving Average:
The indicator supports three types of moving averages:
EMA (Exponential Moving Average),
SMA (Simple Moving Average),
HMA (Hull Moving Average).
Users can choose the type and length of the moving average via input settings.
The selected moving average values are displayed in the Data Window for easier analysis.
Dynamic Coloring of the Coppock Curve:
The Coppock Curve line changes color based on its value:
Green if the value is positive,
Red if the value is negative.
The line's color is also displayed in the Data Window as a numeric value:
1 for green (positive),
-1 for red (negative).
Data Window Output:
The values of the selected moving average are displayed in the Data Window.
The Coppock Curve line's color state (1 or -1) is also shown in the Data Window.
Visual Representation:
The Coppock Curve is plotted with dynamic color coding.
The selected moving average is overlaid on the Coppock Curve for deeper trend analysis.
Usage Instructions:
Add the indicator to your chart on TradingView.
Configure the inputs:
Smoothing length for the Coppock Curve,
Long and short periods for ROC,
Type and length of the moving average.
Analyze the chart:
A green Coppock Curve line indicates a bullish trend, while a red line signals a bearish trend.
The selected moving average helps further filter and confirm signals.
Use the Data Window to view numeric values for the moving average and the Coppock Curve line color.
Applications:
This indicator is ideal for assessing trend direction and strength. The added customization options and additional data make it a versatile tool for traders, enabling them to tailor the Coppock Curve to their strategies.
Landry Light with Moving AverageLandry Light with Moving Average
Overview:
This Pine Script, titled "Landry Light with Moving Average", visualizes the relationship between price action and a chosen moving average (MA) over time. It helps users easily identify periods where the price stays consistently above or below the moving average, which can be a useful indicator of bullish or bearish trends.
Key Features:
Moving Average Type Selection:
The script allows users to choose between two types of moving averages:
Exponential Moving Average (EMA)
Simple Moving Average (SMA)
This is done via a user input option, enabling traders to tailor the indicator to their preferred analysis method.
Moving Average Length:
Users can set the length of the moving average (default is 21 periods). This allows customization based on the trader's time frame, whether short-term or long-term analysis.
Dynamic Moving Average Color:
The moving average line changes color based on the relationship between the price and the MA:
Green: Price is consistently above the MA (bullish condition).
Red: Price is consistently below the MA (bearish condition).
Blue: Price is crossing or close to the MA (neutral or indecisive condition).
Cumulative Days Above/Below MA:
The script tracks and displays the number of consecutive days the price remains above or below the moving average:
Cumulative Days Above: Shown as a green histogram above the zero line.
Cumulative Days Below: Shown as a red histogram below the zero line.
This feature helps users identify sustained trends or potential reversals.
Real-time Labels:
The script generates dynamic labels that display the count of cumulative days the price has stayed above or below the moving average.
These labels are positioned near the moving average on the chart, providing an easy reference for traders.
How Users Can Benefit:
Trend Identification:
By visually representing how long the price stays above or below a key moving average, traders can identify strong bullish or bearish trends. This can inform entry and exit points.
Visualizing Market Sentiment:
The colored moving average line and histogram help traders quickly assess market sentiment. A prolonged green MA line suggests a strong uptrend, while a prolonged red line indicates a downtrend.
Adaptability:
With customizable moving average types and lengths, the indicator can be tailored to fit various trading strategies, whether for day trading, swing trading, or long-term investing.
Reversal Signals:
A shift from cumulative days above to cumulative days below (or vice versa) can serve as an early signal of a potential market reversal, allowing traders to adjust their positions accordingly.
Simplified Decision-Making:
The combination of visual cues (colors, histograms, and labels) simplifies decision-making, allowing traders to focus on trend strength rather than complex calculations.
Usage:
To use this script:
Add the Indicator to Your Chart:
Select the desired moving average type and length.
The script will plot the moving average, colored by the trend, and display cumulative days above or below it.
Interpret the Signals:
Use the histogram and labels to gauge the strength of the trend.
Monitor color changes in the moving average for potential trend reversals.
Incorporate into Your Strategy:
Combine this indicator with other tools (e.g., volume analysis, RSI) to confirm signals and refine your trading strategy.
This indicator is particularly useful for traders who follow the "Landry Light" concept, emphasizing the importance of price staying above or below a moving average to determine trend strength.

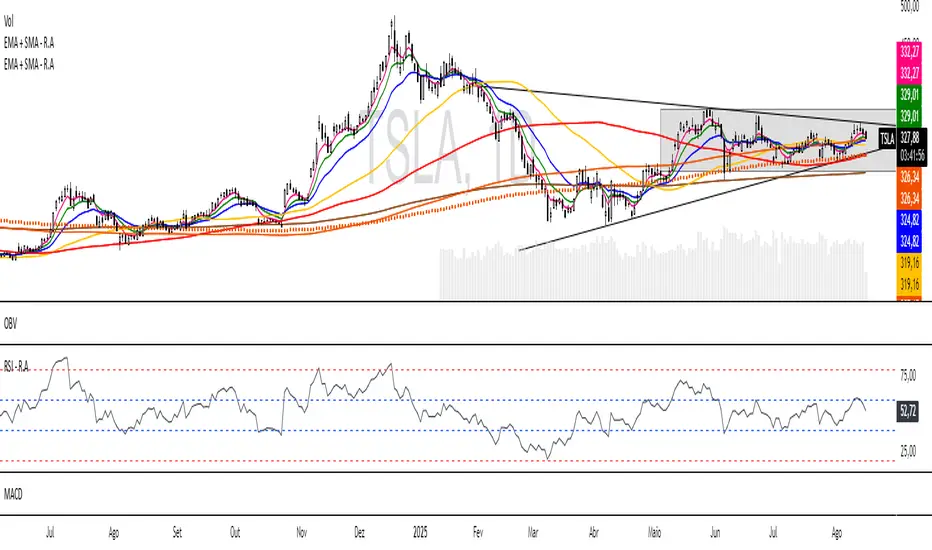
EMA + SMA - R.AR.A. Trader - Multi-MA Suite (EMA & SMA)
1. Overview
Welcome, students of R.A. Trader!
This indicator is a powerful and versatile tool designed specifically to support the trading methodologies taught by Rudá Alves. The R.A. Trader Multi-MA Suite combines two fully customizable groups of moving averages into a single, clean indicator.
Its purpose is to eliminate chart clutter and provide a clear, at-a-glance view of market trends, momentum, and dynamic levels of support and resistance across multiple timeframes. By integrating key short-term and long-term moving averages, this tool will help you apply the R.A. Trader analytical framework with greater efficiency and precision.
2. Core Features
Dual Moving Average Groups: Configure two independent sets of moving averages, perfect for separating short-term (EMA) and long-term (SMA) analysis.
Four MAs Per Group: Each group contains four fully customizable moving averages.
Multiple MA Types: Choose between several types of moving averages for each group (SMA, EMA, WMA, HMA, RMA).
Toggle Visibility: Easily show or hide each group with a single click in the settings panel.
Custom Styling: Key moving averages are styled for instant recognition, including thicker lines for longer periods and a special dotted line for the 250-period SMA.
Clean and Efficient: The code is lightweight and optimized to run smoothly on the TradingView platform.
Group 1 (Default: EMAs)
This group is pre-configured for shorter-term Exponential Moving Averages but is fully customizable.
Setting Label Description
MA Type - EMA Select the type of moving average for this entire group (e.g., EMA, SMA).
EMA 5 Sets the period for the first moving average.
EMA 10 Sets the period for the second moving average.
EMA 20 Sets the period for the third moving average.
EMA 400 Sets the period for the fourth moving average.
Show EMA Group A checkbox to show or hide all MAs in this group.
Exportar para as Planilhas
Group 2 (Default: SMAs)
This group is pre-configured for longer-term Simple Moving Averages, often used to identify major trends.
Setting Label Description
MA Type - SMA Select the type of moving average for this entire group.
SMA 50 Sets the period for the first moving average.
SMA 100 Sets the period for the second moving average.
SMA 200 Sets the period for the third moving average.
SMA 250 Sets the period for the fourth moving average (styled as a dotted line).
Show SMA Group A checkbox to show or hide all MAs in this group.
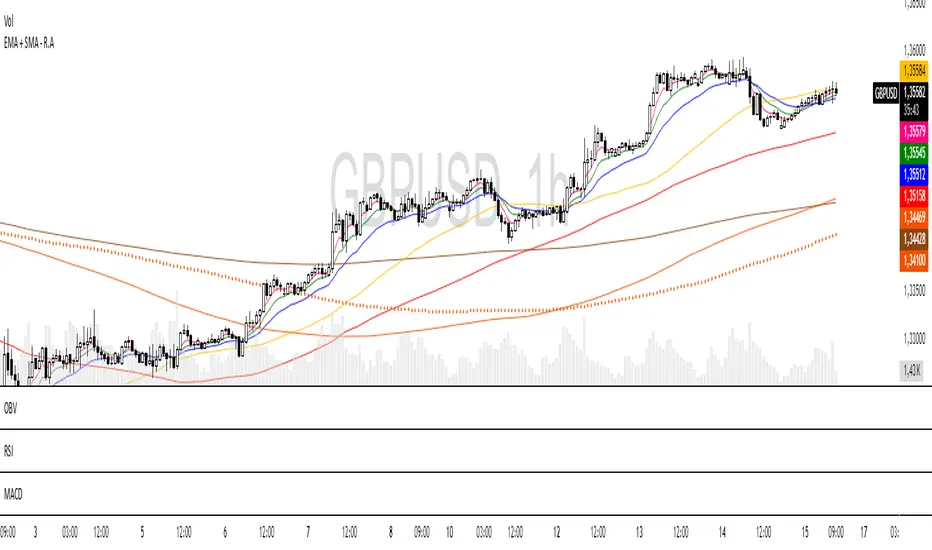
Exportar para as Planilhas
Responsive Moving Average with Trend Detection - MissouriTimThis indicator calculates a responsive moving average (RMA) that dynamically adjusts its sensitivity based on market volatility. This indicator is more responsive that SMAs, EMAs, WMAs, and HMAs. Here's how it functions:
Dynamic Length Adjustment: Utilizes the Average True Range (ATR) to adjust the length of the moving average. In times of increased volatility, the length decreases to make the average more responsive to price changes, and in quieter markets, it increases to reduce noise.
Responsive and Smoothed Moving Averages:
Responsive EMA: An initial Exponential Moving Average (EMA) is calculated with a dynamically adjusted length for responsiveness.
Smoothing: A secondary layer of smoothing is applied to this responsive EMA to further smooth out price fluctuations.
Trend Detection:
Detects trends by comparing the current smoothed EMA with its previous values:
Uptrend is identified when the current smoothed EMA is higher than the last two periods.
Downtrend is recognized when the current smoothed EMA is lower than the last two periods.
Consolidation occurs when neither an uptrend nor a downtrend is present.
Visual Representation:
The moving average line changes color:
Green for an uptrend.
Red for a downtrend.
Orange for consolidation.
Significant Trend Labels:
Labels are displayed when there's a significant change in the moving average:
Uptrend Labels appear when the EMA increases by more than the user-defined "Uptrend Label on % Change" threshold, placed at the high of the bar with green background.
Downtrend Labels are shown when the EMA decreases by more than the "Downtrend Label on % Change" threshold, positioned at the low of the bar with a red background.
Users can enable or disable these labels, and the thresholds for labeling uptrends and downtrends can be adjusted separately to match market conditions or user preferences.
This indicator is tailored for traders needing a moving average that adapts to market dynamics while providing clear visual feedback on significant trend changes via color-coded lines and labels.

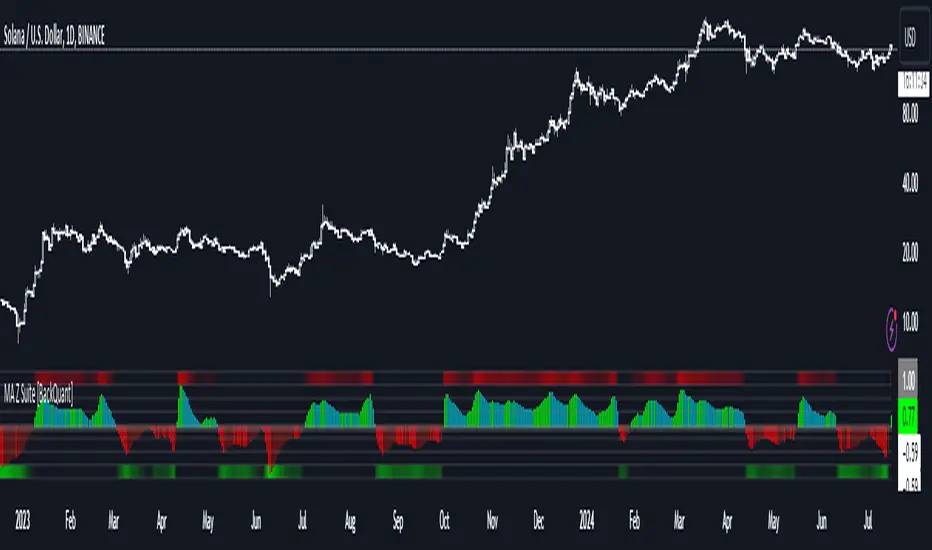
Moving Average Z-Score Suite [BackQuant]Moving Average Z-Score Suite
1. What is this indicator
The Moving Average Z-Score Suite is a versatile indicator designed to help traders identify and capitalize on market trends by utilizing a variety of moving averages. This indicator transforms selected moving averages into a Z-Score oscillator, providing clear signals for potential buy and sell opportunities. The indicator includes options to choose from eleven different moving average types, each offering unique benefits and characteristics. It also provides additional features such as standard deviation levels, extreme levels, and divergence detection, enhancing its utility in various market conditions.
2. What is a Z-Score
A Z-Score is a statistical measurement that describes a value's relationship to the mean of a group of values. It is measured in terms of standard deviations from the mean. For instance, a Z-Score of 1.0 means the value is one standard deviation above the mean, while a Z-Score of -1.0 indicates it is one standard deviation below the mean. In the context of financial markets, Z-Scores can be used to identify overbought or oversold conditions by determining how far a particular value (such as a moving average) deviates from its historical mean.
3. What moving averages can be used
The Moving Average Z-Score Suite allows users to select from the following eleven moving averages:
Simple Moving Average (SMA)
Hull Moving Average (HMA)
Exponential Moving Average (EMA)
Weighted Moving Average (WMA)
Double Exponential Moving Average (DEMA)
Running Moving Average (RMA)
Linear Regression Curve (LINREG) (This script can be found standalone )
Triple Exponential Moving Average (TEMA)
Arnaud Legoux Moving Average (ALMA)
Kalman Hull Moving Average (KHMA)
T3 Moving Average
Each of these moving averages has distinct properties and reacts differently to price changes, allowing traders to select the one that best fits their trading style and market conditions.
4. Why Turning a Moving Average into a Z-Score is Innovative and Its Benefits
Transforming a moving average into a Z-Score is an innovative approach because it normalizes the moving average values, making them more comparable across different periods and instruments. This normalization process helps in identifying extreme price movements and mean-reversion opportunities more effectively. By converting the moving average into a Z-Score, traders can better gauge the relative strength or weakness of a trend and detect potential reversals. This method enhances the traditional moving average analysis by adding a statistical perspective, providing clearer and more objective trading signals.
5. How It Can Be Used in the Context of a Trading System
In a trading system, it can be used to generate buy and sell signals based on the Z-Score values. When the Z-Score crosses above zero, it indicates a potential buying opportunity, suggesting that the price is above its mean and possibly trending upward. Conversely, a Z-Score crossing below zero signals a potential selling opportunity, indicating that the price is below its mean and might be trending downward. Additionally, the indicator's ability to show standard deviation levels and extreme levels helps traders set profit targets and stop-loss levels, improving risk management and trade planning.
6. How It Can Be Used for Trend Following
For trend-following strategies, it can be particularly useful. The Z-Score oscillator helps traders identify the strength and direction of a trend. By monitoring the Z-Score and its rate of change, traders can confirm the persistence of a trend and make informed decisions to enter or exit trades. The indicator's divergence detection feature further enhances trend-following by identifying potential reversals before they occur, allowing traders to capitalize on trend shifts. By providing a clear and quantifiable measure of trend strength, this indicator supports disciplined and systematic trend-following strategies.
No backtests for this indicator due to the many options and ways it can be used,
Enjoy
Adaptive Fisherized Z-scoreHello Fellas,
It's time for a new adaptive fisherized indicator of me, where I apply adaptive length and more on a classic indicator.
Today, I chose the Z-score, also called standard score, as indicator of interest.
Special Features
Advanced Smoothing: JMA, T3, Hann Window and Super Smoother
Adaptive Length Algorithms: In-Phase Quadrature, Homodyne Discriminator, Median and Hilbert Transform
Inverse Fisher Transform (IFT)
Signals: Enter Long, Enter Short, Exit Long and Exit Short
Bar Coloring: Presents the trade state as bar colors
Band Levels: Changes the band levels
Decision Making
When you create such a mod you need to think about which concepts are the best to conclude. I decided to take Inverse Fisher Transform instead of normalization to make a version which fits to a fixed scale to avoid the usual distortion created by normalization.
Moreover, I chose JMA, T3, Hann Window and Super Smoother, because JMA and T3 are the bleeding-edge MA's at the moment with the best balance of lag and responsiveness. Additionally, I chose Hann Window and Super Smoother because of their extraordinary smoothing capabilities and because Ehlers favours them.
Furthermore, I decided to choose the half length of the dominant cycle instead of the full dominant cycle to make the indicator more responsive which is very important for a signal emitter like Z-score. Signal emitters always need to be faster or have the same speed as the filters they are combined with.
Usage
The Z-score is a low timeframe scalper which works best during choppy/ranging phases. The direction you should trade is determined by the last trend change. E.g. when the last trend change was from bearish market to bullish market and you are now in a choppy/ranging phase confirmed by e.g. Chop Zone or KAMA slope you want to do long trades.
Interpretation
The Z-score indicator is a momentum indicator which shows the number of standard deviations by which the value of a raw score (price/source) is above or below the mean value of what is being observed or measured. Easily explained, it is almost the same as Bollinger Bands with another visual representation form.
Signals
B -> Buy -> Z-score crosses above lower band
S -> Short -> Z-score crosses below upper band
BE -> Buy Exit -> Z-score crosses above 0
SE -> Sell Exit -> Z-score crosses below 0
If you were reading till here, thank you already. Now, follows a bunch of knowledge for people who don't know the concepts I talk about.
T3
The T3 moving average, short for "Tim Tillson's Triple Exponential Moving Average," is a technical indicator used in financial markets and technical analysis to smooth out price data over a specific period. It was developed by Tim Tillson, a software project manager at Hewlett-Packard, with expertise in Mathematics and Computer Science.
The T3 moving average is an enhancement of the traditional Exponential Moving Average (EMA) and aims to overcome some of its limitations. The primary goal of the T3 moving average is to provide a smoother representation of price trends while minimizing lag compared to other moving averages like Simple Moving Average (SMA), Weighted Moving Average (WMA), or EMA.
To compute the T3 moving average, it involves a triple smoothing process using exponential moving averages. Here's how it works:
Calculate the first exponential moving average (EMA1) of the price data over a specific period 'n.'
Calculate the second exponential moving average (EMA2) of EMA1 using the same period 'n.'
Calculate the third exponential moving average (EMA3) of EMA2 using the same period 'n.'
The formula for the T3 moving average is as follows:
T3 = 3 * (EMA1) - 3 * (EMA2) + (EMA3)
By applying this triple smoothing process, the T3 moving average is intended to offer reduced noise and improved responsiveness to price trends. It achieves this by incorporating multiple time frames of the exponential moving averages, resulting in a more accurate representation of the underlying price action.
JMA
The Jurik Moving Average (JMA) is a technical indicator used in trading to predict price direction. Developed by Mark Jurik, it’s a type of weighted moving average that gives more weight to recent market data rather than past historical data.
JMA is known for its superior noise elimination. It’s a causal, nonlinear, and adaptive filter, meaning it responds to changes in price action without introducing unnecessary lag. This makes JMA a world-class moving average that tracks and smooths price charts or any market-related time series with surprising agility.
In comparison to other moving averages, such as the Exponential Moving Average (EMA), JMA is known to track fast price movement more accurately. This allows traders to apply their strategies to a more accurate picture of price action.
Inverse Fisher Transform
The Inverse Fisher Transform is a transform used in DSP to alter the Probability Distribution Function (PDF) of a signal or in our case of indicators.
The result of using the Inverse Fisher Transform is that the output has a very high probability of being either +1 or –1. This bipolar probability distribution makes the Inverse Fisher Transform ideal for generating an indicator that provides clear buy and sell signals.
Hann Window
The Hann function (aka Hann Window) is named after the Austrian meteorologist Julius von Hann. It is a window function used to perform Hann smoothing.
Super Smoother
The Super Smoother uses a special mathematical process for the smoothing of data points.
The Super Smoother is a technical analysis indicator designed to be smoother and with less lag than a traditional moving average.
Adaptive Length
Length based on the dominant cycle length measured by a "dominant cycle measurement" algorithm.
Happy Trading!
Best regards,
simwai
---
Credits to
@cheatcountry
@everget
@loxx
@DasanC
@blackcat1402

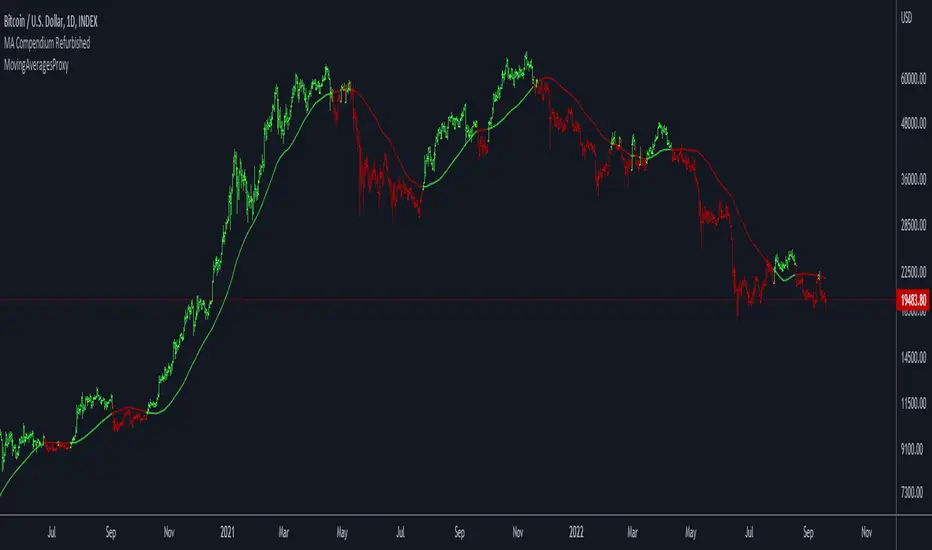
Moving Averages ProxyLibrary "MovingAveragesProxy"
Moving Averages Proxy - Library of all moving averages spread out in different libraries
rvwap(_src, fixedTfInput, minsInput, hoursInput, daysInput, minBarsInput)
Calculates the Rolling VWAP (customized VWAP developed by the team of TradingView)
Parameters:
_src : (float) Source. Default: close
fixedTfInput : (bool) Use a fixed time period. Default: false
minsInput : (int) Minutes. Default: 0
hoursInput : (int) Hours. Default: 0
daysInput : (int) Days. Default: 1
minBarsInput : (int) Bars. Default: 10
Returns: (float) Rolling VWAP
correlationMa(src, len, factor)
Correlation Moving Average
Parameters:
src : (float) Source. Default: close
len : (int) Length
factor : (float) Factor. Default: 1.7
Returns: (float) Correlation Moving Average
regma(src, len, lambda)
Regularized Exponential Moving Average
Parameters:
src : (float) Source. Default: close
len : (int) Length
lambda : (float) Lambda. Default: 0.5
Returns: (float) Regularized Exponential Moving Average
repma(src, len)
Repulsion Moving Average
Parameters:
src : (float) Source. Default: close
len : (int) Length
Returns: (float) Repulsion Moving Average
epma(src, length, offset)
End Point Moving Average
Parameters:
src : (float) Source. Default: close
length : (int) Length
offset : (float) Offset. Default: 4
Returns: (float) End Point Moving Average
lc_lsma(src, length)
1LC-LSMA (1 line code lsma with 3 functions)
Parameters:
src : (float) Source. Default: close
length : (int) Length
Returns: (float) 1LC-LSMA Moving Average
aarma(src, length)
Adaptive Autonomous Recursive Moving Average
Parameters:
src : (float) Source. Default: close
length : (int) Length
Returns: (float) Adaptive Autonomous Recursive Moving Average
alsma(src, length)
Adaptive Least Squares
Parameters:
src : (float) Source. Default: close
length : (int) Length
Returns: (float) Adaptive Least Squares
ahma(src, length)
Ahrens Moving Average
Parameters:
src : (float) Source. Default: close
length : (int) Length
Returns: (float) Ahrens Moving Average
adema(src)
Ahrens Moving Average
Parameters:
src : (float) Source. Default: close
Returns: (float) Moving Average
autol(src, lenDev)
Auto-Line
Parameters:
src : (float) Source. Default: close
lenDev : (int) Length for standard deviation
Returns: (float) Auto-Line
fibowma(src, length)
Fibonacci Weighted Moving Average
Parameters:
src : (float) Source. Default: close
length : (int) Length
Returns: (float) Moving Average
fisherlsma(src, length)
Fisher Least Squares Moving Average
Parameters:
src : (float) Source. Default: close
length : (int) Length
Returns: (float) Moving Average
leoma(src, length)
Leo Moving Average
Parameters:
src : (float) Source. Default: close
length : (int) Length
Returns: (float) Moving Average
linwma(src, period, weight)
Linear Weighted Moving Average
Parameters:
src : (float) Source. Default: close
period : (int) Length
weight : (int) Weight
Returns: (float) Moving Average
mcma(src, length)
McNicholl Moving Average
Parameters:
src : (float) Source. Default: close
length : (int) Length
Returns: (float) Moving Average
srwma(src, length)
Square Root Weighted Moving Average
Parameters:
src : (float) Source. Default: close
length : (int) Length
Returns: (float) Moving Average
EDSMA(src, len)
Ehlers Dynamic Smoothed Moving Average.
Parameters:
src : Series to use ('close' is used if no argument is supplied).
len : Lookback length to use.
Returns: EDSMA smoothing.
dema(x, t)
Double Exponential Moving Average.
Parameters:
x : Series to use ('close' is used if no argument is supplied).
t : Lookback length to use.
Returns: DEMA smoothing.
tema(src, len)
Triple Exponential Moving Average.
Parameters:
src : Series to use ('close' is used if no argument is supplied).
len : Lookback length to use.
Returns: TEMA smoothing.
smma(src, len)
Smoothed Moving Average.
Parameters:
src : Series to use ('close' is used if no argument is supplied).
len : Lookback length to use.
Returns: SMMA smoothing.
hullma(src, len)
Hull Moving Average.
Parameters:
src : Series to use ('close' is used if no argument is supplied).
len : Lookback length to use.
Returns: Hull smoothing.
frama(x, t)
Fractal Reactive Moving Average.
Parameters:
x : Series to use ('close' is used if no argument is supplied).
t : Lookback length to use.
Returns: FRAMA smoothing.
kama(x, t)
Kaufman's Adaptive Moving Average.
Parameters:
x : Series to use ('close' is used if no argument is supplied).
t : Lookback length to use.
Returns: KAMA smoothing.
vama(src, len)
Volatility Adjusted Moving Average.
Parameters:
src : Series to use ('close' is used if no argument is supplied).
len : Lookback length to use.
Returns: VAMA smoothing.
donchian(len)
Donchian Calculation.
Parameters:
len : Lookback length to use.
Returns: Average of the highest price and the lowest price for the specified look-back period.
Jurik(src, len)
Jurik Moving Average.
Parameters:
src : Series to use ('close' is used if no argument is supplied).
len : Lookback length to use.
Returns: JMA smoothing.
xema(src, len)
Optimized Exponential Moving Average.
Parameters:
src : Series to use ('close' is used if no argument is supplied).
len : Lookback length to use.
Returns: XEMA smoothing.
ehma(src, len)
EHMA - Exponential Hull Moving Average
Parameters:
src : Source
len : Period
Returns: Exponential Hull Moving Average (EHMA)
covwema(src, len)
Coefficient of Variation Weighted Exponential Moving Average (COVWEMA)
Parameters:
src : Source
len : Period
Returns: Coefficient of Variation Weighted Exponential Moving Average (COVWEMA)
covwma(src, len)
Coefficient of Variation Weighted Moving Average (COVWMA)
Parameters:
src : Source
len : Period
Returns: Coefficient of Variation Weighted Moving Average (COVWMA)
eframa(src, len, FC, SC)
Ehlrs Modified Fractal Adaptive Moving Average (EFRAMA)
Parameters:
src : Source
len : Period
FC : Lower Shift Limit for Ehlrs Modified Fractal Adaptive Moving Average
SC : Upper Shift Limit for Ehlrs Modified Fractal Adaptive Moving Average
Returns: Ehlrs Modified Fractal Adaptive Moving Average (EFRAMA)
etma(src, len)
Exponential Triangular Moving Average (ETMA)
Parameters:
src : Source
len : Period
Returns: Exponential Triangular Moving Average (ETMA)
rma(src, len)
RMA - RSI Moving average
Parameters:
src : Source
len : Period
Returns: RSI Moving average (RMA)
thma(src, len)
THMA - Triple Hull Moving Average
Parameters:
src : Source
len : Period
Returns: Triple Hull Moving Average (THMA)
vidya(src, len)
Variable Index Dynamic Average (VIDYA)
Parameters:
src : Source
len : Period
Returns: Variable Index Dynamic Average (VIDYA)
zsma(src, len)
Zero-Lag Simple Moving Average (ZSMA)
Parameters:
src : Source
len : Period
Returns: Zero-Lag Simple Moving Average (ZSMA)
zema(src, len)
Zero-Lag Exponential Moving Average (ZEMA)
Parameters:
src : Source
len : Period
Returns: Zero-Lag Exponential Moving Average (ZEMA)
evwma(src, len)
EVWMA - Elastic Volume Weighted Moving Average
Parameters:
src : Source
len : Period
Returns: Elastic Volume Weighted Moving Average (EVWMA)
tt3(src, len, a1_t3)
Tillson T3
Parameters:
src : Source
len : Period
a1_t3 : Tillson T3 Volume Factor
Returns: Tillson T3
gma(src, len)
GMA - Geometric Moving Average
Parameters:
src : Source
len : Period
Returns: Geometric Moving Average (GMA)
wwma(src, len)
WWMA - Welles Wilder Moving Average
Parameters:
src : Source
len : Period
Returns: Welles Wilder Moving Average (WWMA)
cma(src, len)
Corrective Moving average (CMA)
Parameters:
src : Source
len : Period
Returns: Corrective Moving average (CMA)
edma(src, len)
Exponentially Deviating Moving Average (MZ EDMA)
Parameters:
src : Source
len : Period
Returns: Exponentially Deviating Moving Average (MZ EDMA)
rema(src, len)
Range EMA (REMA)
Parameters:
src : Source
len : Period
Returns: Range EMA (REMA)
sw_ma(src, len)
Sine-Weighted Moving Average (SW-MA)
Parameters:
src : Source
len : Period
Returns: Sine-Weighted Moving Average (SW-MA)
mama(src, len)
MAMA - MESA Adaptive Moving Average
Parameters:
src : Source
len : Period
Returns: MESA Adaptive Moving Average (MAMA)
fama(src, len)
FAMA - Following Adaptive Moving Average
Parameters:
src : Source
len : Period
Returns: Following Adaptive Moving Average (FAMA)
hkama(src, len)
HKAMA - Hilbert based Kaufman's Adaptive Moving Average
Parameters:
src : Source
len : Period
Returns: Hilbert based Kaufman's Adaptive Moving Average (HKAMA)
getMovingAverage(type, src, len, lsmaOffset, inputAlmaOffset, inputAlmaSigma, FC, SC, a1_t3, fixedTfInput, daysInput, hoursInput, minsInput, minBarsInput, lambda, volumeWeighted, gamma_aarma, smooth, linweight, volatility_lookback, jurik_phase, jurik_power)
Abstract proxy function that invokes the calculation of a moving average according to type
Parameters:
type : (string) Type of moving average
src : (float) Source of series (close, high, low, etc.)
len : (int) Period of loopback to calculate the average
lsmaOffset : (int) Offset for Least Squares MA
inputAlmaOffset : (float) Offset for ALMA
inputAlmaSigma : (float) Sigma for ALMA
FC : (int) Lower Shift Limit for Ehlrs Modified Fractal Adaptive Moving Average
SC : (int) Upper Shift Limit for Ehlrs Modified Fractal Adaptive Moving Average
a1_t3 : (float) Tillson T3 Volume Factor
fixedTfInput : (bool) Use a fixed time period in Rolling VWAP
daysInput : (int) Days in Rolling VWAP
hoursInput : (int) Hours in Rolling VWAP
minsInput : (int) Minutrs in Rolling VWAP
minBarsInput : (int) Bars in Rolling VWAP
lambda : (float) Regularization Constant in Regularized EMA
volumeWeighted : (bool) Apply volume weighted calculation in selected moving average
gamma_aarma : (float) Gamma for Adaptive Autonomous Recursive Moving Average
smooth : (float) Smooth for Adaptive Least Squares
linweight : (float) Weight for Volume Weighted Moving Average
volatility_lookback : (int) Loopback for Volatility Adjusted Moving Average
jurik_phase : (int) Phase for Jurik Moving Average
jurik_power : (int) Power for Jurik Moving Average
Returns: (float) Moving average
Scalping The BullNome: Scalping The Bull (Indicatore)
Categoria: Scalping, Trend Following, Mean Reversion.
Timeframe: 1M, 5M, 30M, 1D, secondo la conformazione specifica.
(follow description in english)
Analisi tecnica: l’indicatore supporta le operatività descritte nei video di YouTube del canale “Scalping The Bull”. Di norma si basa su price action e medie mobili esponenziali.
Le varie tecniche che possono essere usate insieme all’indicatore sono sintetizzate nei settaggi dell’indicatore e si può fare riferimento ai video specifici per la spiegazione completa.
Utilizzo consigliato: Altcoin che presentano forti trend per scalping e operazioni intra-day.
Configurazione: È possibile configurare lo strumento in maniera semplice e completa.
Medie:
Medie per mercato: e’ possibile utilizzare le medie mobili esponenziali (EMA) esclusivamente per il mercato Crypto (5/10/60/223).
Media addizionale: e’ possibile visualizzare una media aggiuntiva, e.g. a 20 periodi.
Elementi del grafico:
Sfondo: segnala con lo sfondo del grafico in verde una situazione di uptrend ( EMA 60 > EMA 223) e in rosso sfondo rosso una situazione di downtrend (EMA 60 < EMA 223).
Separatori di sessioni: indica l’inizio della sessione corrente.
Punti Trigger:
Massimi e minimi di oggi: disegna sul grafico il prezzo di apertura della candela daily e i massimi e i minimi di giornata.
Massimi minimi di ieri: disegna sul grafico il prezzo di apertura della candela daily, i massimi e i minimi del giorno prima.
(English description)
Name: Scalping The Bull (Indicator)
Category: Scalping, Trend Following, Mean Reversion.
Timeframe: 1M, 5M, 30M, 1D depending on the specific signal.
Technical Analysis: The indicator supports the operations described in the YouTube videos of the channel "Scalping The Bull". Usually it is based on price action and exponential moving averages.
The various techniques that can be used in conjunction with the indicator are summarized in the indicator settings and you can refer to the specific videos for the full explanation.
Suggested usage: Altcoin showing strong trends for scalping and intra-day trades.
Configuration:
Exponential Moving Averages
Per market: you can display averages exclusively for the Crypto market (5/10/60/223).
Additional Average: You can display an additional average, e.g. 20-period average.
Chart elements:
Session Separators: indicates the beginning of the current session.
Background: signals with the background in green an uptrend situation ( 60 > 223) and in red background a downtrend situation (60 < 223).
Trigger points:
Today's highs and lows: draw on the chart the opening price of the daily candle and the highs and lows of the day.
Yesterday's highs and lows: draw on the chart the opening price of the daily candle, the highs and lows of the previous day.

2MA Cross with Glow Effects 2MA Cross with Glow Effects
Overview
This indicator enhances the classic moving average crossover strategy with a dynamic and visually appealing "glow" effect. It plots two customisable moving averages on the chart and illuminates the area around them when a crossover occurs, providing a clear and intuitive signal for potential trend changes.
Features
Dual Moving Averages: Configure two independent moving averages to suit your trading style.
Multiple MA Types: Choose from a wide range of moving average types for each line, including:
SMA (Simple Moving Average)
EMA (Exponential Moving Average)
WMA (Weighted Moving Average)
VWMA (Volume-Weighted Moving Average)
RMA (Relative Moving Average)
HMA (Hull Moving Average)
ALMA (Arnaud Legoux Moving Average)
LSMA (Least Squares Moving Average)
Customisable Appearance: Adjust the length, line width, and color for each moving average.
Unique Glow Effect: A configurable glow appears around the moving averages during a crossover, providing an unmistakable visual cue. You can control the intensity and width of this effect.
How It Works
The core of the indicator is the calculation of two moving averages based on the user's selected type and length. The script continuously monitors the relationship between these two MAs.
The "glow" is a sophisticated visual effect achieved by using Pine Script's `fill()` function to create a smooth, colored gradient around the MA lines. The glow is conditionally rendered:
When the first moving average (MA1) crosses above the second (MA2), MA1 will glow above its line.
When MA1 crosses below MA2, it will glow below its line.
The same logic is applied to MA2, creating a dual-glow effect that clearly shows which MA is dominant.
To ensure a consistent visual appearance across different chart timeframes, the indicator incorporates a `tfMultiplier` that automatically adjusts the glow's width.
How to Use
This indicator can be used in the same way as a standard moving average crossover strategy
Bullish Signal: Look for the shorter-period moving average to cross above the longer-period moving average. The glow effect will make this event highly visible.
Bearish Signal: Look for the shorter-period moving average to cross below the longer-period moving average.
Traders can use this for trend identification, entry/exit signals, and as a component of a more comprehensive trading system. For example, a common setup is using a 20-period EMA and a 50-period EMA to capture medium-term trends.
Disclaimer
This indicator is designed as a technical analysis tool and should be used in conjunction with other forms of analysis and proper risk management.
Past performance does not guarantee future results, and traders should thoroughly test any strategy before implementing it with real capital.

EMA/SMA Distance Percentage TableThis TradingView indicator, "EMA/SMA Distance Percentage Table," is designed to help traders and analysts quickly assess the current price's relationship to key Exponential Moving Averages (EMAs) and Simple Moving Averages (SMAs).
Here's a breakdown of what it does:
Calculates Multiple Moving Averages: It computes EMAs for lengths 10, 30, 50, and 200, and SMAs for lengths 50 and 200. These are commonly used moving averages in technical analysis.
Measures Percentage Distance: For each of these moving averages, it calculates the percentage difference between the current closing price and the moving average's value. This indicates how far, in percentage terms, the price has deviated from that average. A positive percentage means the price is above the MA, while a negative percentage means it's below.
Displays Data in a Table: All the calculated information (MA type and length, its current value, and the percentage distance) is presented in a clear, organized table on the chart. This allows for quick at-a-glance monitoring.
Customizable Visibility: Users have the flexibility to show or hide the plots of the EMAs and SMAs on the chart, as well as the entire data table, through the indicator's settings.
Purpose:
The primary purpose of this indicator is to provide a concise overview of price momentum and potential overbought/oversold conditions relative to various moving averages. Traders often use the distance from MAs to:
Identify Trend Strength: A large distance from a long-term MA might suggest a strong trend.
Spot Potential Reversals: If the price is significantly extended from an MA, it might indicate that a pullback or reversal is due.
Confirm Support/Resistance: Moving averages often act as dynamic support or resistance levels, and their distance can provide context.
In essence, it helps you quickly see if the price is "stretched" or "compressed" relative to its historical averages, which can be valuable for making trading decisions.

Uptrick: Fusion Trend Reversion SystemOverview
The Uptrick: Fusion Trend Reversion System is a multi-layered indicator designed to identify potential price reversals during intraday movement while keeping traders informed of the dominant short-term trend. It blends a composite fair value model with deviation logic and a refined momentum filter using the Relative Strength Index (RSI). This tool was created with scalpers and short-term traders in mind and is especially effective on lower timeframes such as 1-minute, 5-minute, and 15-minute charts where price dislocations and quick momentum shifts are frequent.
Introduction
This indicator is built around the fusion of two classic concepts in technical trading: identifying trend direction and spotting potential reversion points. These are often handled separately, but this system merges them into one process. It starts by computing a fair value price using five moving averages, each with its own mathematical structure and strengths. These include the exponential moving average (EMA), which gives more weight to recent data; the simple moving average (SMA), which gives equal weight to all periods; the weighted moving average (WMA), which progressively increases weight with recency; the Arnaud Legoux moving average (ALMA), known for smoothing without lag; and the volume-weighted average price (VWAP), which factors in volume at each price level.
All five are averaged into a single value — the raw fusion line. This fusion acts as a dynamically balanced centerline that adapts to price conditions with both smoothing and responsiveness. Two additional exponential moving averages are applied to the raw fusion line. One is slower, giving a stable trend reference, and the other is faster, used to define momentum and cloud behavior. These two lines — the fusion slow and fusion fast — form the backbone of trend and signal logic.
Purpose
This system is meant for traders who want to trade reversals without losing sight of the underlying directional bias. Many reversal indicators fail because they act too early or signal too frequently in choppy markets. This script filters out noise through two conditions: price deviation and RSI confirmation. Reversion trades are considered only when the price moves a significant distance from fair value and RSI suggests a legitimate shift in momentum. That filtering process gives the trader a cleaner, higher-quality signal and reduces false entries.
The indicator also visually supports the trader through colored bars, up/down labels, and a filled cloud between the fast and slow fusion lines. These features make the market context immediately visible: whether the trend is up or down, whether a reversal just occurred, and whether price is currently in a high-risk reversion zone.
Originality and Uniqueness
What makes this script different from most reversal systems is the way it combines layers of logic — not just to detect signals, but to qualify and structure them. Rather than relying on a single MA or a raw RSI level, it uses a five-MA fusion to create a baseline fair value that incorporates speed, stability, and volume-awareness.
On top of that, the system introduces a dual-smoothing mechanism. It doesn’t just smooth price once — it creates two layers: one to follow the general trend and another to track faster deviations. This structure lets the script distinguish between continuation moves and possible turning points more effectively than a single-line or single-metric system.
It also uses RSI in a more refined way. Instead of just checking if RSI is overbought or oversold, the script smooths RSI and requires directional confirmation. Beyond that, it includes signal memory. Once a signal is generated, a new one will not appear unless the RSI becomes even more extreme and curls back again. This memory-based gating reduces signal clutter and prevents repetition, a rare feature in similar scripts.
Why these indicators were merged
Each moving average in the fusion serves a specific role. EMA reacts quickly to recent price changes and is often favored in fast-trading strategies. SMA acts as a long-term filter and smooths erratic behavior. WMA blends responsiveness with smoothing in a more balanced way. ALMA focuses on minimizing lag without losing detail, which is helpful in fast markets. VWAP anchors price to real trade volume, giving a sense of where actual positioning is happening.
By combining all five, the script creates a fair value model that doesn’t lean too heavily on one logic type. This fusion is then smoothed into two separate EMAs: one slower (trend layer), one faster (signal layer). The difference between these forms the basis of the trend cloud, which can be toggled on or off visually.
RSI is then used to confirm whether price is reversing with enough force to warrant a trade. The RSI is calculated over a 14-period window and smoothed with a 7-period EMA. The reason for smoothing RSI is to cut down on noise and avoid reacting to short, insignificant spikes. A signal is only considered if price is stretched away from the trend line and the smoothed RSI is in a reversal state — below 30 and rising for bullish setups, above 70 and falling for bearish ones.
Calculations
The script follows this structure:
Calculate EMA, SMA, WMA, ALMA, and VWAP using the same base length
Average the five values to form the raw fusion line
Smooth the raw fusion line with an EMA using sens1 to create the fusion slow line
Smooth the raw fusion line with another EMA using sens2 to create the fusion fast line
If fusion slow is rising and price is above it, trend is bullish
If fusion slow is falling and price is below it, trend is bearish
Calculate RSI over 14 periods
Smooth RSI using a 7-period EMA
Determine deviation as the absolute difference between current price and fusion slow
A raw signal is flagged if deviation exceeds the threshold
A raw signal is flagged if RSI EMA is under 30 and rising (bullish setup)
A raw signal is flagged if RSI EMA is over 70 and falling (bearish setup)
A final signal is confirmed for a bullish setup if RSI EMA is lower than the last bullish signal’s RSI
A final signal is confirmed for a bearish setup if RSI EMA is higher than the last bearish signal’s RSI
Reset the bullish RSI memory if RSI EMA rises above 30
Reset the bearish RSI memory if RSI EMA falls below 70
Store last signal direction and use it for optional bar coloring
Draw the trend cloud between fusion fast and fusion slow using fill()
Show signal labels only if showSignals is enabled
Bar and candle colors reflect either trend slope or last signal direction depending on mode selected
How it works
Once the script is loaded, it builds a fusion line by averaging five different types of moving averages. That line is smoothed twice into a fast and slow version. These two fusion lines form the structure for identifying trend direction and signal areas.
Trend bias is defined by the slope of the slow line. If the slow line is rising and price is above it, the market is considered bullish. If the slow line is falling and price is below it, it’s considered bearish.
Meanwhile, the script monitors how far price has moved from that slow line. If price is stretched beyond a certain distance (set by the threshold), and RSI confirms that momentum is reversing, a raw reversion signal is created. But the script only allows that signal to show if RSI has moved further into oversold or overbought territory than it did at the last signal. This blocks repetitive, weak entries. The memory is cleared only if RSI exits the zone — above 30 for bullish, below 70 for bearish.
Once a signal is accepted, a label is drawn. If the signal toggle is off, no label will be shown regardless of conditions. Bar colors are controlled separately — you can color them based on trend slope or last signal, depending on your selected mode.
Inputs
You can adjust the following settings:
MA Length: Sets the period for all moving averages used in the fusion.
Show Reversion Signals: Turns on the plotting of “Up” and “Down” labels when a reversal is confirmed.
Bar Coloring: Enables or disables colored bars based on trend or signal direction.
Show Trend Cloud: Fills the space between the fusion fast and slow lines to reflect trend bias.
Bar Color Mode: Lets you choose whether bars follow trend logic or last signal direction.
Sens 1: Smoothing speed for the slow fusion line — higher values = slower trend.
Sens 2: Smoothing speed for the fast line — lower values = faster signal response.
Deviation Threshold: Minimum distance price must move from fair value to trigger a signal check.
Features
This indicator offers:
A composite fair value model using five moving average types.
Dual smoothing system with user-defined sensitivity.
Slope-based trend definition tied to price position.
Deviation-triggered signal logic filtered by RSI reversal.
RSI memory system that blocks repetitive signals and resets only when RSI exits overbought or oversold zones.
Real-time tracking of the last signal’s direction for optional bar coloring.
Up/Down labels at signal points, visible only when enabled.
Optional trend cloud between fusion layers, visualizing current market bias.
Full user control over smoothing, threshold, color modes, and visibility.
Conclusion
The Fusion Trend-Reversion System is a tool for short-term traders looking to fade price extremes without ignoring trend bias. It calculates fair value using five diverse moving averages, smooths this into two dynamic layers, and applies strict reversal logic based on RSI deviation and momentum strength. Signals are triggered only when price is stretched and momentum confirms it with increasingly strong behavior. This combination makes the tool suitable for scalping, intraday entries, and fast market environments where precision matters.
Disclaimer
This indicator is for informational and educational purposes only. It does not constitute financial advice. All trading involves risk, and no tool can predict market behavior with certainty. Use proper risk management and do your own research before making trading decisions.

Fortuna Trend Predictor**Fortuna Trend Predictor**
### Overview
**Fortuna Trend Predictor** is a powerful trend analysis tool that combines multiple technical indicators to estimate trend strength, volatility, and probability of price movement direction. This indicator is designed to help traders identify potential trend shifts and confirm trade setups with improved accuracy.
### Key Features
- **Trend Strength Analysis**: Uses the difference between short-term and long-term Exponential Moving Averages (EMA) normalized by the Average True Range (ATR) to determine trend strength.
- **Directional Strength via ADX**: Calculates the Average Directional Index (ADX) manually to measure the strength of the trend, regardless of its direction.
- **Probability Estimation**: Provides a probabilistic assessment of price movement direction based on trend strength.
- **Volume Confirmation**: Incorporates a volume filter that validates signals when the trading volume is above its moving average.
- **Volatility Filter**: Uses ATR to identify high-volatility conditions, helping traders avoid false signals during low-volatility periods.
- **Overbought & Oversold Levels**: Includes RSI-based horizontal reference lines to highlight potential reversal zones.
### Indicator Components
1. **ATR (Average True Range)**: Measures market volatility and serves as a denominator to normalize EMA differences.
2. **EMA (Exponential Moving Averages)**:
- **Short EMA (20-period)** - Captures short-term price movements.
- **Long EMA (50-period)** - Identifies the overall trend.
3. **Trend Strength Calculation**:
- Formula: `(Short EMA - Long EMA) / ATR`
- The higher the value, the stronger the trend.
4. **ADX Calculation**:
- Computes +DI and -DI manually to generate ADX values.
- Higher ADX indicates a stronger trend.
5. **Volume Filter**:
- Compares current volume to a 20-period moving average.
- Signals are more reliable when volume exceeds its average.
6. **Volatility Filter**:
- Detects whether ATR is above its own moving average, multiplied by a user-defined threshold.
7. **Probability Plot**:
- Formula: `50 + 50 * (Trend Strength / (1 + abs(Trend Strength)))`
- Values range from 0 to 100, indicating potential movement direction.
### How to Use
- When **Probability Line is above 70**, the trend is strong and likely to continue.
- When **Probability Line is below 30**, the trend is weak or possibly reversing.
- A rising **ADX** confirms strong trends, while a falling ADX suggests consolidation.
- Combine with price action and other confirmation tools for best results.
### Notes
- This indicator does not generate buy/sell signals but serves as a decision-support tool.
- Works best on higher timeframes (H1 and above) to filter out noise.
---
### Example Chart
*The chart below demonstrates how Fortuna Trend Predictor can help identify strong trends and avoid false breakouts by confirming signals with volume and volatility filters.*

GocchiMulti-Indicator: RSI & Moving Averages
This versatile TradingView indicator combines two essential tools for technical analysis—Relative Strength Index (RSI) and Moving Averages (MAs)—into one comprehensive solution. It is designed for traders seeking flexibility, customization, and efficiency in their charting experience.
Features:
Relative Strength Index (RSI):
Customizable RSI length.
Adjustable overbought and oversold levels.
Selectable source input (e.g., close, open, high, low).
Visual levels for overbought and oversold zones, aiding in quick trend and momentum identification.
Three Moving Averages:
Three independently customizable moving averages.
Options for Simple Moving Average (SMA) or Exponential Moving Average (EMA) for each line.
Adjustable lengths for short-, medium-, and long-term trend tracking.
Visual Enhancements:
Clear, color-coded plots for RSI and each moving average.
Overbought and oversold zones are highlighted with horizontal dotted lines.
Alerts:
Get notified when RSI crosses above the overbought level or below the oversold level.
Alerts help traders stay on top of potential market reversals or breakout opportunities.
Use Cases:
RSI Analysis: Spot overbought or oversold conditions to identify potential reversals.
Trend Following: Use moving averages to confirm trends or identify crossovers for potential entry and exit points.
Custom Strategies: Tailor the settings to fit specific trading styles, such as scalping, swing trading, or long-term investing.
This all-in-one indicator streamlines your analysis by reducing the need for multiple overlays, making your charts cleaner and more actionable. Whether you're a novice or an experienced trader, this tool provides the flexibility and insights you need to succeed in any market condition.

Distance From moving averageDistance From Moving Average is designed to help traders visualize the deviation of the current price from a specified moving average. Users can select from four different types of moving averages: Simple Moving Average (SMA), Exponential Moving Average (EMA), Weighted Moving Average (WMA), and Hull Moving Average (HMA).
Key Features:
User-Friendly Input Options:
Choose the type of moving average from a dropdown menu.
Set the length of the moving average, with a default value of 200.
Custom Moving Average Calculations:
The script computes the selected moving average using the appropriate mathematical formula, allowing for versatile analysis based on individual trading strategies.
Distance Calculation:
The indicator calculates the distance between the current price and the chosen moving average, providing insight into market momentum. A positive value indicates that the price is above the moving average, while a negative value shows it is below.
Visual Representation:
The distance is plotted on the chart, with color coding:
Lime: Indicates that the price is above the moving average (bullish sentiment).
Red: Indicates that the price is below the moving average (bearish sentiment).
Customization:
Users can further customize the appearance of the plotted line, enhancing clarity and visibility on the chart.
This indicator is particularly useful for traders looking to gauge market conditions and make informed decisions based on the relationship between current prices and key moving averages.
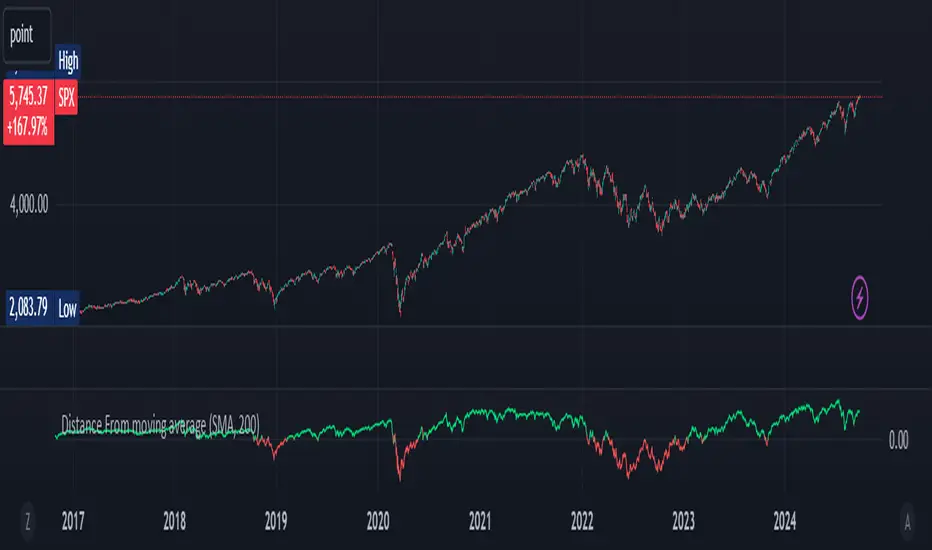
Combined EMA, SMMA, and 60-Day Cycle Indicator V2What This Script Does:
This script is designed to help traders visualize market trends and generate trading signals based on a combination of moving averages and price action. Here's a breakdown of its components and functionality:
Moving Averages:
EMAs (Exponential Moving Averages): These are indicators that smooth out price data to help identify trends. The script uses several EMAs:
200 EMA: A long-term trend indicator.
400 EMA: An even longer-term trend indicator.
55 EMA: A medium-term trend indicator.
89 EMA: Another medium-term trend indicator.
SMMA (Smoothed Moving Average): Similar to EMAs but with different smoothing. The script calculates:
21 SMMA: Short-term smoothed average.
9 SMMA: Very short-term smoothed average.
Cycle High and Low:
60-Day Cycle: The script looks back over the past 60 days to find the highest price (cycle high) and the lowest price (cycle low). These are plotted as horizontal lines on the chart.
Color-Coded Clouds:
Clouds: The script fills the area between certain EMAs with color-coded clouds to visually indicate trend conditions:
200 EMA vs. 400 EMA Cloud: Green when the 200 EMA is above the 400 EMA (bullish trend) and red when it’s below (bearish trend).
21 SMMA vs. 9 SMMA Cloud: Orange when the 21 SMMA is above the 9 SMMA and green when it’s below.
55 EMA vs. 89 EMA Cloud: Light green when the 55 EMA is above the 89 EMA and red when it’s below.
Trading Signals:
Buy Signal: This is shown when:
The price crosses above the 60-day low and
The EMAs indicate a bullish trend (e.g., the 200 EMA is above the 400 EMA and the 55 EMA is above the 89 EMA).
Sell Signal: This is shown when:
The price crosses below the 60-day high and
The EMAs indicate a bearish trend (e.g., the 200 EMA is below the 400 EMA and the 55 EMA is below the 89 EMA).
How It Helps Traders:
Trend Visualization: The colored clouds and EMA lines help you quickly see whether the market is in a bullish or bearish phase.
Trading Signals: The script provides clear visual signals (buy and sell labels) based on specific market conditions, helping you make more informed trading decisions.
In summary, this script combines several tools to help identify market trends and provide buy and sell signals based on price action relative to a 60-day high/low and the positioning of moving averages. It’s a useful tool for traders looking to visualize trends and automate some aspects of their trading strategy.
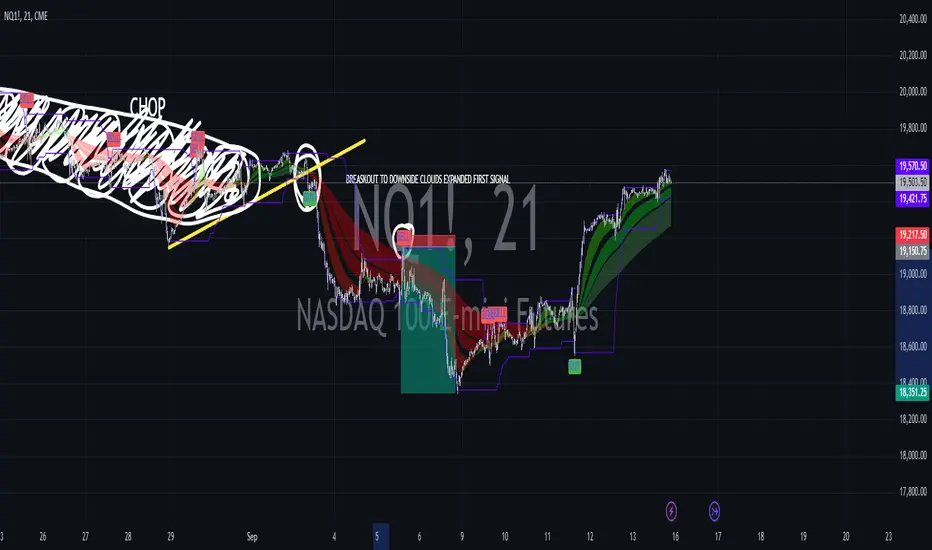
CCI+EMA Strategy with Percentage or ATR TP/SL [Alifer]This is a momentum strategy based on the Commodity Channel Index (CCI), with the aim of entering long trades in oversold conditions and short trades in overbought conditions.
Optionally, you can enable an Exponential Moving Average (EMA) to only allow trading in the direction of the larger trend. Please note that the strategy will not plot the EMA. If you want, for visual confirmation, you can add to the chart an Exponential Moving Average as a second indicator, with the same settings used in the strategy’s built-in EMA.
The strategy also allows you to set internal Stop Loss and Take Profit levels, with the option to choose between Percentage-based TP/SL or ATR-based TP/SL.
The strategy can be adapted to multiple assets and timeframes:
Pick an asset and a timeframe
Zoom back as far as possible to identify meaningful positive and negative peaks of the CCI
Set Overbought and Oversold at a rough average of the peaks you identified
Adjust TP/SL according to your risk management strategy
Like the strategy? Give it a boost!
Have any questions? Leave a comment or drop me a message.
CAUTIONARY WARNING
Please note that this is a complex trading strategy that involves several inputs and conditions. Before using it in live trading, it is highly recommended to thoroughly test it on historical data and use risk management techniques to safeguard your capital. After backtesting, it's also highly recommended to perform a first live test with a small amount. Additionally, it's essential to have a good understanding of the strategy's behavior and potential risks. Only risk what you can afford to lose .
USED INDICATORS
1 — COMMODITY CHANNEL INDEX (CCI)
The Commodity Channel Index (CCI) is a technical analysis indicator used to measure the momentum of an asset. It was developed by Donald Lambert and first published in Commodities magazine (now Futures) in 1980. Despite its name, the CCI can be used in any market and is not just for commodities. The CCI compares current price to average price over a specific time period. The indicator fluctuates above or below zero, moving into positive or negative territory. While most values, approximately 75%, fall between -100 and +100, about 25% of the values fall outside this range, indicating a lot of weakness or strength in the price movement.
The CCI was originally developed to spot long-term trend changes but has been adapted by traders for use on all markets or timeframes. Trading with multiple timeframes provides more buy or sell signals for active traders. Traders often use the CCI on the longer-term chart to establish the dominant trend and on the shorter-term chart to isolate pullbacks and generate trade signals.
CCI is calculated with the following formula:
(Typical Price - Simple Moving Average) / (0.015 x Mean Deviation)
Some trading strategies based on CCI can produce multiple false signals or losing trades when conditions turn choppy. Implementing a stop-loss strategy can help cap risk, and testing the CCI strategy for profitability on your market and timeframe is a worthy first step before initiating trades.
2 — AVERAGE TRUE RANGE (ATR)
The Average True Range (ATR) is a technical analysis indicator that measures market volatility by calculating the average range of price movements in a financial asset over a specific period of time. The ATR was developed by J. Welles Wilder Jr. and introduced in his book “New Concepts in Technical Trading Systems” in 1978.
The ATR is calculated by taking the average of the true range over a specified period. The true range is the greatest of the following:
The difference between the current high and the current low.
The difference between the previous close and the current high.
The difference between the previous close and the current low.
The ATR can be used to set stop-loss orders. One way to use ATR for stop-loss orders is to multiply the ATR by a factor (such as 2 or 3) and subtract it from the entry price for long positions or add it to the entry price for short positions. This can help traders set stop-loss orders that are more adaptive to market volatility.
3 — EXPONENTIAL MOVING AVERAGE (EMA)
The Exponential Moving Average (EMA) is a type of moving average (MA) that places a greater weight and significance on the most recent data points.
The EMA is calculated by taking the average of the true range over a specified period. The true range is the greatest of the following:
The difference between the current high and the current low.
The difference between the previous close and the current high.
The difference between the previous close and the current low.
The EMA can be used by traders to produce buy and sell signals based on crossovers and divergences from the historical average. Traders often use several different EMA lengths, such as 10-day, 50-day, and 200-day moving averages.
The formula for calculating EMA is as follows:
Compute the Simple Moving Average (SMA).
Calculate the multiplier for weighting the EMA.
Calculate the current EMA using the following formula:
EMA = Closing price x multiplier + EMA (previous day) x (1-multiplier)
STRATEGY EXPLANATION
1 — INPUTS AND PARAMETERS
The strategy uses the Commodity Channel Index (CCI) with additional options for an Exponential Moving Average (EMA), Take Profit (TP) and Stop Loss (SL).
length : The period length for the CCI calculation.
overbought : The overbought level for the CCI. When CCI crosses above this level, it may signal a potential short entry.
oversold : The oversold level for the CCI. When CCI crosses below this level, it may signal a potential long entry.
useEMA : A boolean input to enable or disable the use of Exponential Moving Average (EMA) as a filter for long and short entries.
emaLength : The period length for the EMA if it is used.
2 — CCI CALCULATION
The CCI indicator is calculated using the following formula:
(src - ma) / (0.015 * ta.dev(src, length))
src is the typical price (average of high, low, and close) and ma is the Simple Moving Average (SMA) of src over the specified length.
3 — EMA CALCULATION
If the useEMA option is enabled, an EMA is calculated with the given emaLength .
4 — TAKE PROFIT AND STOP LOSS METHODS
The strategy offers two methods for TP and SL calculations: percentage-based and ATR-based.
tpSlMethod_percentage : A boolean input to choose the percentage-based method.
tpSlMethod_atr : A boolean input to choose the ATR-based method.
5 — PERCENTAGE-BASED TP AND SL
If tpSlMethod_percentage is chosen, the strategy calculates the TP and SL levels based on a percentage of the average entry price.
tp_percentage : The percentage value for Take Profit.
sl_percentage : The percentage value for Stop Loss.
6 — ATR-BASED TP AND SL
If tpSlMethod_atr is chosen, the strategy calculates the TP and SL levels based on Average True Range (ATR).
atrLength : The period length for the ATR calculation.
atrMultiplier : A multiplier applied to the ATR to set the SL level.
riskRewardRatio : The risk-reward ratio used to calculate the TP level.
7 — ENTRY CONDITIONS
The strategy defines two conditions for entering long and short positions based on CCI and, optionally, EMA.
Long Entry: CCI crosses below the oversold level, and if useEMA is enabled, the closing price should be above the EMA.
Short Entry: CCI crosses above the overbought level, and if useEMA is enabled, the closing price should be below the EMA.
8 — TP AND SL LEVELS
The strategy calculates the TP and SL levels based on the chosen method and updates them dynamically.
For the percentage-based method, the TP and SL levels are calculated as a percentage of the average entry price.
For the ATR-based method, the TP and SL levels are calculated using the ATR value and the specified multipliers.
9 — EXIT CONDITIONS
The strategy defines exit conditions for both long and short positions.
If there is a long position, it will be closed either at TP or SL levels based on the chosen method.
If there is a short position, it will be closed either at TP or SL levels based on the chosen method.
Additionally, positions will be closed if CCI crosses back above oversold in long positions or below overbought in short positions.
10 — PLOTTING
The script plots the CCI line along with overbought and oversold levels as horizontal lines.
The CCI line is colored red when above the overbought level, green when below the oversold level, and white otherwise.
The shaded region between the overbought and oversold levels is plotted as well.
