"GOLD"に関するスクリプトを検索
Bollinger Band Strategy (Basic) Version 1 This strategy is for learning purposes only. Pay special attention to these strategies on longer aggregation periods (like 1 hr chart or more). Don't expect accurate results when you set a limit to 10 cents above your entry to be accurate. For example if you set the chart to 1 day, the price may move down and hit a stop 10 times then tag your limit. If this doesn't make sense, just don't use strategies here. Learn more first. That being said, I don't have specific recommendations for each aggregation period, backtesting isn't always perfect.
Now then, this strategy can be used as the traditional BB method by setting the "Stop" and "Limit Out" to like 10000, check "Reversal Entry" and uncheck "Limit Time of Day" This will keep the strategy running just reverse your position when price crosses outside each band.
INPUTS:
Length - length of WMA that I used for mean of Bollinger Band (this may suppose to be SMA, too bad)
Source - O-H-L-C basis for WMA
Deviation - normal Standard deviation that would be set when using Bollinger Band
Trailing stop check box - your stop value will be either a hard stop or trailing stop for an exit
Stop - the stop value - remember you can set this really high and it won't stop out
Limit Out - the limit value for exit
Reversal Entry check box - This changes each entry from a reversal (traditional idea of BB) to enter a trend trade - hopefully version 2 will have choice to trend one direction and reversal in the other.
Limit Time of Day - Especially when trading futures, you may want to only trade a specific time of day, when this box is checked, you can set the entry times below, exit will still only occur based on limit/stop or a flip entry order (the opposite entry condition is met)
Tips:
when I don't know a thing about a price range, like gold. I can set the limit out to 10000 and play with a trailing stop to get a better idea of what is even possible before tuning further.


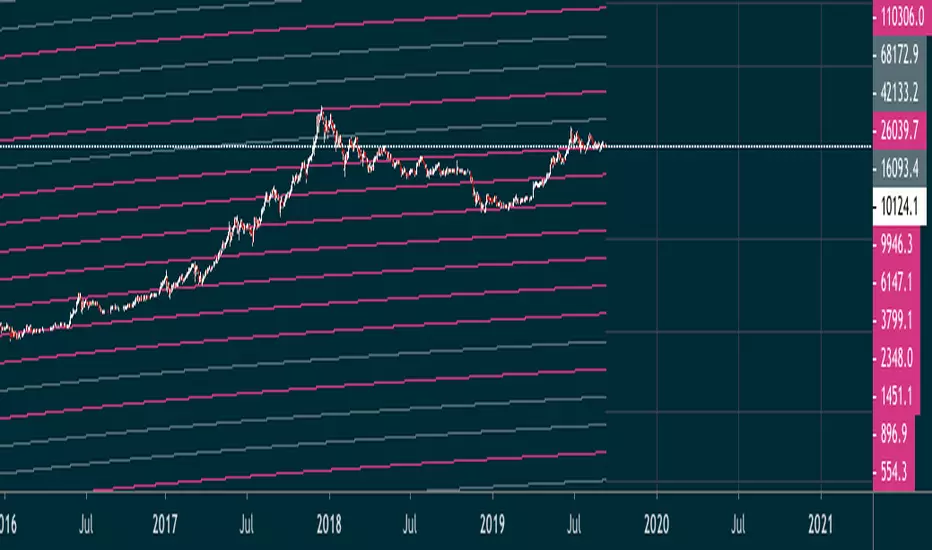
Kringold2[WOZDUX] gold equivalentThe indicator is a tool for global analysis. The default is the price of gold. The price of the instrument from the main window is divided by the price of gold. The result is the price of the instrument in units of gold. The screen uses the Dow Jones index as an example. In the indicator window, the price of the index in units of gold or the so-called gold Dow Jones. The use of the gold equivalent makes it possible to see more truthful trends. The Indicator has the ability to change gold to any other equivalent. It is enough to change the name of the exchange and the name of the instrument in the options tool and exchange. In addition, in the settings, the second box on top allows you to view the graph in a linear or logarithmic scale. The first box at the top switches the line chart or the CCI =WT indicator to this chart.
-------------------------------------------
Индикатор это инструмент для глобального анализа. По умолчанию используется цена золота. Цена инструмента из основного окна делится на цену золота. В результате получается цена инструмента в единицах золота. На экране для примера используется индекс Доу джонса. В окне индикатора цена индекса в единицах золота или так называемый золотой Доу Джонс. Использование золотого эквивалента дает возможность видеть более правдивые тенденции движения. В Индикаторе есть возможность поменять золото на любой другой эквивалент. Достаточно в опциях инструмент и биржа изменить название биржи и название инструмента. Кроме того, в настройках, второй бокс сверху дает возможность смотреть график в линейном или логарифмическом масштабе. Первый бокс сверу переключает линейный график или индикатор CCI =WT к данному графику.

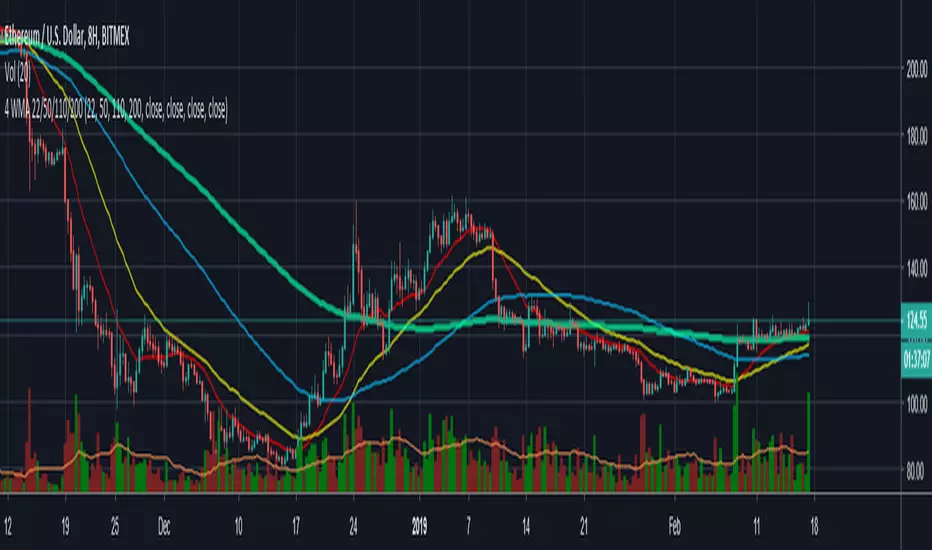
Macd_Reader_Signal_Moriceau_Thesis_indicatorThe idea is to create a MACD "Reader" that can tell you when you should buy (yellow candle sticks) and when to Sell (black one) you have also strong signal of with B and S write on graphic automatically. This indicator is set and back tested with BTCUSD and Gold. I used also for french equities and it works really good.
Let me know if you want any change or have comments.
Hugo Moriceau
Fractal Regression Bands [DW]This study is an experimental regression curve built around fractal and ATR calculations.
First, Williams Fractals are calculated, and used as anchoring points.
Next, high anchor points are connected to negative sloping lines, and low anchor points to positive sloping lines. The slope is a specified percentage of the current ATR over the sampling period.
The median between the positive and negative sloping lines is then calculated, then the best fit line (linear regression) of the median is calculated to generate the basis line.
Lastly, a Golden Mean ATR is taken of price over the sampling period and multiplied by 1/2, 1, 2, and 3. The results are added and subtracted from the basis line to generate the bands.
Williams Fractals are included in the plots. The color scheme indicated whether each fractal is engulfing or non-engulfing.
Custom bar color scheme is included.

Blake's Golden Cross IndicatorFor 2 special people..
Golden line matters. dont buy below red line. You can change these numbers that create the MA lines in the settings if you find something needs to be adjusted to what you like. Play with it and have fun.

BTC vs GOLD Macro RotationBTC vs GOLD Macro Rotation Indicator
BTC vs GOLD Macro Rotation Model
This indicator is a macroeconomic rotation model that compares the relative attractiveness of Bitcoin (BTC) versus Gold (GOLD) based on multiple fundamental macro factors.
How does it work?
The model analyzes weekly data from various macroeconomic indicators and generates a score for each asset. The taller bar indicates the preferred asset to rotate capital into.
- Green bars (above zero): BTC strength
- Yellow bars (below zero):GOLD strength
- Info table:Shows exact percentages and rotation recommendation
Macroeconomic Factors Analyzed:
1. DXY (US Dollar Index)
- Strong dollar → Favors GOLD
- Weak dollar → Favors BTC
2. Oil (WTI Crude)
- Oil rising → Favors GOLD
- Oil falling → Favors BTC
3. Copper
- Copper rising → Favors BTC (risk-on)
- Copper falling → Favors GOLD (risk-off)
4. Real Rates (Fed Funds - YoY Inflation)
- Real rates falling → Favors GOLD
- Real rates rising → Favors BTC
5. Fertilizer/Natural Gas Regime (Urea, Ammonia, Natural Gas)**
- Specific combinations of movements in these commodities generate inflationary/deflationary regime signals
Fertilizer Rules:**
| Urea | Ammonia | Gas | Signal |
|------|---------|-----|--------|
| ↑ | ↑ | ↓ | GOLD +2 |
| ↑ | ↑ | ↑ | GOLD +3, BTC -1 |
| ↓ | ↓ | ↓ | BTC +3, GOLD -1 |
| ↑ | ↓ | ↓ | BTC +3 |
| ↓ | ↑ | ↑ | GOLD +3, BTC -1 |
Technical Features:
- Operates on weekly timeframe regardless of chart
- Normalized changes for signal stability
- Configurable EMA smoothing
- Safe handling of invalid symbols (won't break if a ticker doesn't exist)
- All tickers are user-editable
Configurable Inputs:
- Symbols for all assets (BTC, GOLD, DXY, Oil, Copper, CPI, Fed Funds, Gas, Urea, Ammonia)
- Individual weights for each macro component
- Normalization length
- EMA smoothing
Interpretation:**
- **BTC dominant (taller green):** Macro conditions favor risk/digital assets
- **GOLD dominant (taller yellow):** Macro conditions favor safe-haven/tangible assets
This indicator is for educational and informational purposes only. It does not constitute financial advice. Always do your own research before making investment decisions.
Recommended Timeframe: Weekly (W) or Daily (D)

M.T.C. Gold Pocket Break of Structure (BOS)
Swing → impuls
Fib over impuls
Gold Pocket = entry
SL onder OB
TP1 = RR 1:1
TP2 = RR 1:2

KD Weekly Oversold Golden Cross (v6)KD Weekly Oversold Golden Cross (v6)
This is a screener for weekly KD indicator bullish crossovers at oversold levels, where the K value does not exceed 25.

BTC/Gold Breakout LevelScript to show the price Bitcoin would have to reach to break out against the December 2024 BTC/GOLD top of $41.

VaRz BTC/Gold Risk MeterVaRz Risk Meter (BTC vs Risk-On & Gold Safe-Haven Proxy)
The VaRz Risk Meter is a macro sentiment oscillator designed to measure Bitcoin’s relative strength and directional bias using key risk-appetite and safe-haven flows.
Indicator Components
VIX → Market fear & volatility benchmark
NASDAQ 100 (NDX) → Primary risk-on proxy (growth/tech capital flow)
Gold (XAUUSD) → Safe-haven strength alternative to USD index
Bitcoin (BTCUSDT) → Used only for normalization reference, not bias calculation
Core Logic
All assets are normalized on a 0–100 scale using a 100-period rolling window to create a balanced comparison across markets.
The Bitcoin Macro Bias Histogram is calculated as:
NASDAQ strength − VIX fear − Gold safe-haven strength
This produces a macro directional regime for Bitcoin:
Market Regimes Interpretation
Indicator State Meaning for BTC
NASDAQ high + VIX low + Gold weak Risk-On environment → Bullish for Bitcoin
Gold strong + VIX rising + NASDAQ weak Risk-Off / flight to safety → Bearish pressure on BTC
All assets near 50 with no trend Neutral / Sideways → Macro indecision
How to Use
This is not a direct entry signal, but a macro bias filter
Best combined with:
Market Structure, Liquidity zones, Orderflow, Volume analysis, and Elliott Wave context
Bias becomes more reliable on higher timeframes (1W, 1M) but works on any chart
Key Insight
Bitcoin behaves as a hybrid risk asset. This indicator helps track when capital is:
Rotating into risk markets (favorable for BTC)
or
Seeking protection in gold and volatility hedges (unfavorable for BTC)
The histogram visually maps these shifts to give traders a clear macro regime awareness in one window.

Global Macro Scanner & Relative PerformanceDescription: This indicator is an all-in-one Macro Dashboard that allows traders to track money flow across major global asset classes in real-time. It combines a floating data table with a normalized percentage-performance chart.
Features:
Macro Dashboard (Table): Displays the current value, daily % change, and status (Inflow/Outflow) for 9 key economic sectors:
US M2 Supply: Tracks monetary inflation/tightening.
DXY (US Dollar): Currency strength.
Bonds (AGG): US Aggregate Bond market.
Stocks (VT): Total World Stock Index.
Real Estate (VNQ): Vanguard Real Estate ETF.
Commodities: Oil (WTI), Gold, and Silver.
Crypto: Total Crypto Market Cap.
Relative Performance Chart (Lines): Instead of plotting raw prices (which have vastly different scales), this script plots the Percentage Return relative to a baseline.
Lookback Period: You can set a lookback (default 100 bars). The script sets the price 100 bars ago as "0%" and plots how much each asset has gained or lost since then.
Comparison: This allows you to visually see which assets are outperforming or underperforming relative to each other over the same time period.
Visual Aids:
Dynamic Labels: Each line is tagged with a label at the current candle so you can identify assets without needing a legend.
Colors: Each asset has a distinct, fixed color for consistency between the table and the chart.
How to use:
Add the script to your chart.
Adjust the "Lookback" setting in the inputs to change the starting point of the comparison (e.g., set it to the start of the year to see Year-to-Date performance).
Use the dashboard to spot daily money flow rotation (e.g., Money moving out of Stocks and into Gold).

Ahmed Gold Signals - 5M LIVE (Frequent)📈 Gold (XAUUSD) Trading Signals – Precision-Based Strategy
Our Gold signals are built on pure price action, not random indicators or guesswork.
🔍 How our signals are generated
We focus on:
🧲 Liquidity Sweeps
Identifying when price grabs stop-losses above highs or below lows and then reverses
📊 Clear trend direction using EMA 50 & EMA 200
✅ Strong confirmation candles after the sweep
🎯 Entries only in the direction of the trend to increase accuracy
🔵 BUY Signals
Bullish market structure
Price sweeps liquidity below recent lows
Strong bullish confirmation candle closes
➡️ High-probability BUY setup
🔴 SELL Signals
Bearish market structure
Price sweeps liquidity above recent highs
Strong bearish confirmation candle closes
➡️ High-probability SELL setup
⏱️ Timeframe
5-minute chart (5M)
Fast, precise signals ideal for scalping Gold
🛡️ Risk Management
Stop loss placed beyond the liquidity sweep
Clear take-profit targets
Risk-to-reward typically 1:2 or better
⚠️ Important Notes
We do not trade every move
We wait for confirmation
Quality over quantity — always

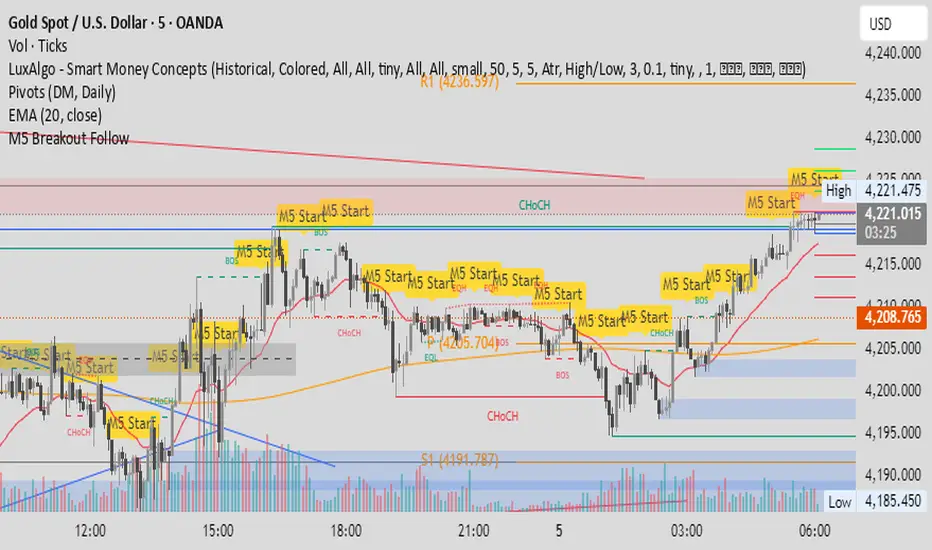
M5 Candle Follow Breakout - Teknik Gold Fanatic V2 This technique is entirely the property of Prof Sastra Gold Fanatic.
This technique uses a strategy of following breakouts from the first M5 of each hour.
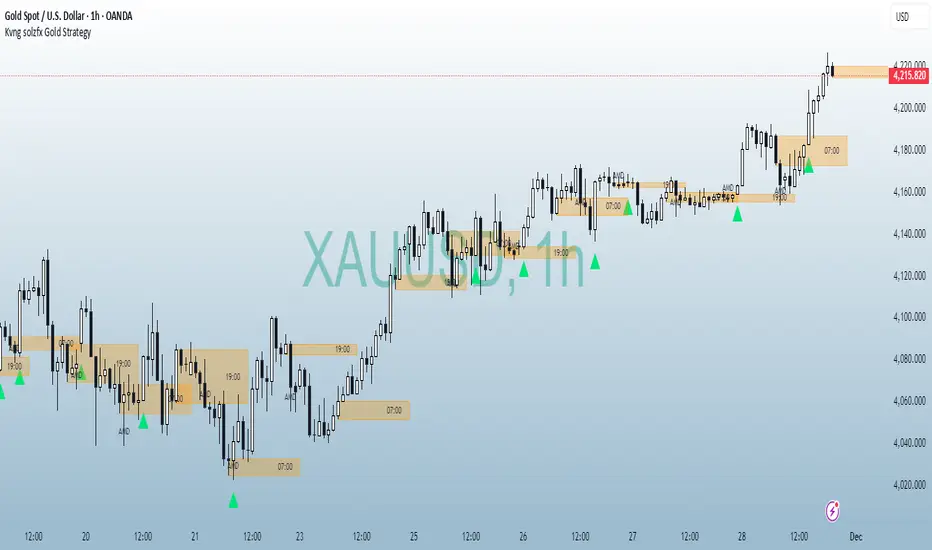
Kvng solzfx Gold StrategyThis indicator helps to find gold setups using kvng solz fx buy only strategy on gold
Smart Money Decoded [GOLD]Title: Smart Money Decoded
Description:
Introduction
Smart Money Decoded is a comprehensive, institutional-grade visualization suite designed to simplify the complex world of Smart Money Concepts (SMC). While many indicators flood the chart with noise, this tool focuses on clarity, precision, and high-probability structure.
This script is built for traders who follow the "Inner Circle Trader" (ICT) methodologies but struggle to identify valid Zones, Displacement, and Liquidity Sweeps in real-time.
💎 Key Features & Logic
1. Refined Market Structure (BOS & CHoCH)
Instead of marking every minor pivot, this script uses a filtered Swing High/Low detection system.
HH/LL/LH/HL Labels: Only significant structure points are mapped.
BOS (Break of Structure): Marks trend continuations in the direction of the bias.
CHoCH (Change of Character): Marks potential trend reversals.
2. Advanced Order Blocks (with "Strict Mode")
Not all down-candles before an up-move are Order Blocks. This script separates the weak from the strong.
Standard OBs: Visualized with standard transparency.
⚡ SWEEP OBs (High Probability): Order Blocks that explicitly swept liquidity (Stop Hunt) before the reversal are highlighted with a thicker border, brighter color, and a ⚡ symbol. These are your high-probability "Turtle Soup" entries.
Strict Mode Toggle: In the settings, you can choose to hide all weak OBs and only see the ones that swept liquidity.
3. Dynamic Breaker Blocks
A true ICT Breaker is a failed Order Block that trapped liquidity.
This script automatically detects when a valid OB is mitigated (broken through) and projects it forward as a Breaker Block.
This ensures you are trading off valid flipped zones (Support becomes Resistance, Resistance becomes Support).
4. Fair Value Gaps (FVG)
Automatically detects Imbalances (Imbalance/Inefficiency).
Includes an ATR Filter to ignore tiny, insignificant gaps, keeping your chart clean.
Option to show the Consequent Encroachment (50% CE) level for precision entries.
5. Liquidity Zones (BSL / SSL)
Automatically plots Buy Side Liquidity (BSL) and Sell Side Liquidity (SSL) at key swing points.
Once price sweeps these levels, the zone is removed or marked as "Swept," helping you identify when the draw on liquidity has been met.
6. Institutional Data Panel
A dashboard in the top right corner displays:
Market Bias: Bullish/Bearish/Neutral based on structure.
Premium/Discount: Tells you if price is in the expensive (Premium) or cheap (Discount) part of the current dealing range.
Active Zones: Counts of current open arrays.
⚙️ How To Use This Indicator
Identify Bias: Look at the Structure Labels (HH/LL) and the Panel. Are we making Higher Highs?
Wait for the Trap: Look for a Liquidity Sweep (BSL/SSL taken) or a ⚡ Sweep OB.
Entry Confirmation: Watch for a return to a Fair Value Gap (FVG) or a retest of a Breaker Block (BRK).
Manage Risk: Use the visuals to place stops above/below invalidation points.
Customization:
Go to the settings to toggle "Strict Mode" for Order Blocks, change colors to match your theme, or adjust the lookback periods to fit your specific asset (Forex, Crypto, or Indices).
📚 Credits & Acknowledgments
This script is an educational tool based on the public teachings of Michael J. Huddleston (The Inner Circle Trader - ICT).
Concepts used: Order Blocks, Breakers, FVGs, Market Structure, Liquidity Pools.
Credit is fully given to ICT for originating these concepts and sharing them with the world.
⚠️ Disclaimer
This script is NOT affiliated with, endorsed by, or connected to Michael J. Huddleston (ICT) in any way. It is an independent coding project intended for educational purposes and visual assistance.
Trading involves substantial risk. This indicator does not guarantee profits. Always use proper risk management. Trust your analysis first, and use indicators as confluence.
#Smart Money Concepts, #SMC, #ICT,#Liquidity, #Market Structure, #Trend, #Price Action.

Thirdeyechart Global Gold PercentageThe global gold percentage – Percentage Change Indicator is a TradingView tool developed to help traders monitor multiple currency pairs and precious metals in one glance. This indicator was coded personally, using custom formulas to calculate the percentage change for each symbol over selected timeframes, making it unique and fully tailored to individual analysis needs.
Users can input any symbols they wish to track as a comma-separated list, making it highly flexible. The script automatically calculates percentage changes for Daily (D), 1-Hour (H1), and 4-Hour (H4) timeframes. Positive changes are highlighted in blue and negative changes in red, allowing for an instant visual representation of market movements. The table updates in real-time, giving traders immediate feedback without needing to switch between charts.
Designed with simplicity and functionality in mind, this indicator is ideal for intraday traders, swing traders, or anyone who wants to keep an eye on multiple markets efficiently. It works for currency pairs, metals like gold (XAUUSD, XAUJPY), or any TradingView-available symbol. The table is positioned at the top-right corner of the chart and automatically adapts to the number of symbols entered.
This script is purely informational and educational, providing a clear view of price movements but not offering buy or sell signals. Traders should perform their own analysis and risk management before making any trading decisions.
Disclaimer / Copyright:
© 2025 Thirdeyechart. All rights reserved. This indicator is for educational and informational purposes only. The author is not responsible for any trading losses or financial decisions made based on this script. Redistribution, copying, or commercial use of this code without permission is strictly prohibited.

Universal Scalper Indicator [Crypto/Forex/Gold]Universal Scalper Pro is an all-in-one scalping system designed for the 15-Minute Timeframe. It automates the analysis of trend, volatility, and risk management into a single, high-contrast dashboard.
Unlike standard crossover indicators, this system filters out low-volatility "noise" using a built-in ADX engine and automatically calculates dynamic Stop Loss and Take Profit levels based on market volatility (ATR).
It is engineered to work universally on:
Crypto (BTC, ETH, SOL, Altcoins)
Commodities (Gold, Silver, Oil)
Forex (Major & Minor Pairs)
Stocks (High volume tech stocks like NVDA, TSLA)
📈 How It Works (The Strategy)
1. The Trend Engine (9/21 EMA) The core logic utilizes a Fast (9) and Slow (21) Exponential Moving Average crossover.
Bullish Signal: The 9 EMA crosses above the 21 EMA.
Bearish Signal: The 9 EMA crosses below the 21 EMA. This specific combination is chosen for its responsiveness to 15-minute intraday trends.
2. The Noise Filter (ADX > 15) To prevent "whipsaws" (fake signals during sideways markets), the script includes a Volatility Filter based on the Average Directional Index (ADX).
Signals are rejected if the ADX is below 15.
This ensures you only receive alerts when there is sufficient momentum to sustain a move.
3. Dynamic Risk Management (ATR) The script uses the Average True Range (ATR) to calculate Stop Loss and Take Profit levels that adapt to the specific asset's volatility.
Stop Loss: Placed at 1.5x ATR from the entry. (Tight enough to preserve capital, wide enough to survive standard market noise).
Take Profit: Placed at 2.0x ATR from the entry. (Provides a healthy 1:1.3 Risk/Reward ratio).
🚀 Key Features
Universal Dashboard: A bottom-right panel displays the live Trend Status, Entry Price, Stop Loss, and Take Profit. It automatically formats decimals for any asset (e.g., 2 decimals for Gold, 5 for Forex, 8 for Crypto).
"Sticky" Memory: The dashboard retains the prices of the last valid signal, allowing you to manage your trade even after the signal candle closes.
Trend Cloud: A visual Green/Red zone between the EMAs helps you instantly identify the market bias.
Unified Alerts: A single alert setup ("Any alert() function call") sends the Asset Name, Entry, SL, and TP directly to your phone.
🛠️ How to Use
Timeframe: Set your chart to 15 Minutes (15m).
Wait for the Signal: Look for the "BUY" (Green) or "SELL" (Red) label on the chart.
Check the Dashboard: Ensure the "STATUS" is BULLISH (for buys) or BEARISH (for sells). If the status says "WAIT", do not trade.
Execute: Enter the trade using the exact Stop Loss and Take Profit levels shown on the dashboard.
⚠️ Risk Disclaimer
Trading financial markets involves high risk and may not be suitable for all investors. This indicator is a technical analysis tool and does not constitute financial advice. Past performance is not indicative of future results. Always practice with a demo account before trading real capital.

9/15 EMA Scalper 9/15 EMA Scalper — by uzairbaloch
This script is a price-action based scalping system built around the 9 EMA and 15 EMA trend structure.
It identifies short-term reversal points where the market pulls back into the EMAs and confirms direction with a strong candle signal.
The strategy looks for:
• A clear EMA trend (9 above 15 for buys, 9 below 15 for sells)
• Pullback into EMA9/EMA15 with candle bodies touching the fast EMA
• Strong confirmation candle (engulfing / strong momentum / controlled wick)
• Optional slope filter to avoid flat, choppy sessions
• Automatic trade labels showing Entry, SL and TP (based on R:R)
The script is designed for scalping on gold, indices, and high-volatility FX pairs.
It resets trade logic immediately after SL or TP is hit, so it can catch the next valid signal without delay.
This tool is meant as an indicator — not a full strategy — and can be used to visually mark high-probability EMA pullback setups with precise levels.
Author: uzairbaloch

Fear & Greed Oscillator - Risk SentimentThe Fear & Greed Oscillator – Risk Sentiment is a macro-driven sentiment indicator inspired by the popular Fear & Greed Index , but rebuilt from the ground up using real, market-based economic data and statistical normalization.
While the traditional Fear & Greed Index uses components like volatility, volume, and social media trends to estimate sentiment, this version is powered by the Copper/Gold ratio — a historically respected gauge of macroeconomic confidence and risk appetite.
📈 Expansion vs. Contraction Theory
At the heart of this oscillator is a simple macroeconomic insight:
🟢 Copper performs well during periods of economic expansion and risk-on behavior (industrials, construction, manufacturing growth).
🔴 Gold performs well during periods of economic contraction , as a classic risk-off, capital-preserving asset.
By tracking the ratio of Copper to Gold prices over time and converting it into a Z-score , this tool shows when macro sentiment is statistically stretched toward greed or fear — based on how unusually strong one side of the ratio is relative to its historical average.
⚙️ How It Works
The script takes two user-defined tickers (default: Copper and Gold) and calculates their ratio.
It then applies Z-score normalization over a user-defined period (default: 200 bars).
A color gradient line is plotted:
🔴 Z < -2 = Extreme Fear
🟣 -2 to 0 = Mild Fear to Neutral
🔵 0 to 2 = Neutral to Greed
🟢 Z > 2 = Extreme Greed
Visual guides at ±1, ±2, ±3 standard deviations give immediate context.
Includes alert conditions when the Z-score crosses above +2 (Greed) or below -2 (Fear).
🔔 Alerts
“Z-Score has entered the Greed Zone ” when Z > 2
“Z-Score has entered the Fear Zone ” when Z < -2
These are designed to help catch macro sentiment extremes before or during large shifts in market behavior.
⚠️ Disclaimer
This indicator is a macro sentiment tool, not a direct trading signal. While the Copper/Gold ratio often reflects economic risk trends, correlation with risk assets (like Bitcoin or equities) is not guaranteed and may vary by cycle. Always use this indicator in conjunction with other tools and contextual analysis.
