Gold DropGold Drop – Intraday Trading System (India Markets)
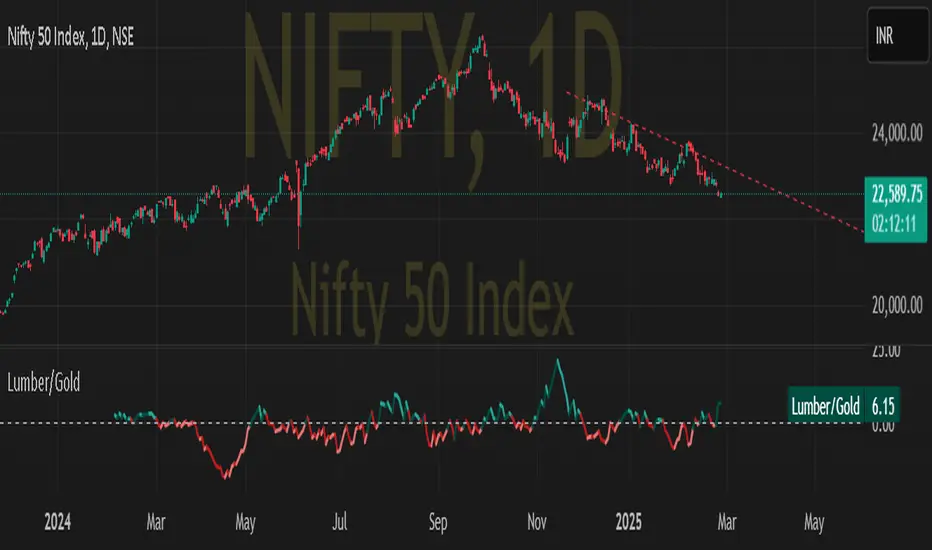
Gold Drop is a rule-based intraday trading strategy designed specifically for Indian index trading (BANKNIFTY / NIFTY), combining trend, momentum, strength, and fixed reference levels to deliver consistent and disciplined trade execution.
The system is built to avoid emotional trading, over-trading, and shifting levels during the session
Pine Script® インジケーター